Article Text

Abstract
Objectives To develop projections of the resources required (person-years of drug supply and healthcare worker time) for universal access to antiretroviral treatment (ART) in Zimbabwe.
Methods A stochastic mathematical model of disease progression, diagnosis, clinical monitoring and survival in HIV infected individuals.
Findings The number of patients receiving ART is determined by many factors, including the strategy of the ART programme (method of initiation, frequency of patient monitoring, ability to include patients diagnosed before ART became available), other healthcare services (referral rates from antenatal clinics, uptake of HIV testing), demographic and epidemiological conditions (past and future trends in incidence rates and population growth) as well as the medical impact of ART (average survival and the relationship with CD4 count when initiated). The variations in these factors lead to substantial differences in long-term projections; with universal access by 2010 and no further prevention interventions, between 370 000 and almost 2 million patients could be receiving treatment in 2030—a fivefold difference. Under universal access, by 2010 each doctor will initiate ART for up to two patients every day and the case-load for nurses will at least triple as more patients enter care and start treatment.
Conclusions The resources required by ART programmes are great and depend on the healthcare systems and the demographic/epidemiological context. This leads to considerable uncertainty in long-term projections and large variation in the resources required in different countries and over time. Understanding how current practices relate to future resource requirements can help optimise ART programmes and inform long-term public health planning.
- Epidemiology
- HIV
- mathematical model
This is an open-access article distributed under the terms of the Creative Commons Attribution Non-commercial License, which permits use, distribution, and reproduction in any medium, provided the original work is properly cited, the use is non commercial and is otherwise in compliance with the license. See: http://creativecommons.org/licenses/by-nc/3.0/ and http://creativecommons.org/licenses/by-nc/3.0/legalcode
Statistics from Altmetric.com
Introduction
The unfolding humanitarian crisis associated with the general spread of HIV in many African countries has led to an unprecedented financial and logistical commitment to providing antiretroviral treatment (ART) to those in need.1–3 However, providing ART is a long-term intervention that will impose a great burden on the fragile healthcare systems in low-income settings.4–7 Projections of the costs and benefits of providing ART relative to other types of intervention have been influential in setting international public health priorties8 ,9 and mobilising resources.10 In order to optimise current practices and make adequate provisions for the future, it is necessary to understand how the long-term impact of ART programmes is linked to current strategy and conditions.7 In this paper, we develop a mathematical model to investigate this relationship.
Two of the main resources required in ART programmes are the treatment itself (drugs and other associated materials) and the time of the doctors and nurses monitoring patients and initiating treatment.4 ,7 ,9 ,11 ,12 As a first approximation, we can assume that these costs will be proportional to the number on ART and the number of ‘appointments’ with doctors and nurses, although certain anticipated economies of scale could increase efficiencies.13 United Nations Programme on HIV and AIDS (UNAIDS)/WHO calculate the number in need of ART as the sum of individuals in need of treatment (within 2 years of death in the absence of the treatment) and the number that have already started ART after a 10% yearly attrition rate.9 ,14 ,15 While this method has provided useful guideline estimates, it is also important to understand how the epidemiological context and properties of the ART programme determine such quantities. ART programmes in different countries will manage patients and initiate ART in different ways and the pattern of ART uptake may change over time. The total resources required by alternative patient management strategies can be estimated by considering the range of disease states in a population,7 ,16 but this does not consider how monitoring effort or methods of ART initiation interact and are associated with survival outcomes and years spent on ART.17 Analyses that have examined the relative resource requirements of different initiation strategies11 have not represented practicalities in ART delivery, such as errors in CD4 counts, non-continuous monitoring of individuals or changes over time in the profile of patients entering care. Therefore, it is worth exploring how these epidemiological and programmatic factors could modify projections for the resources required in providing ART.
We have developed a mathematical model that follows theoretical cohorts of HIV infected individuals as their disease progresses, tracking when symptoms occur, how their HIV infection is diagnosed, how the clinician monitors their condition, the decision to initiate ART and the effect this has on survival. In collaboration with the Zimbabwe Ministry of Health and Child Welfare and local health service professionals, we have parameterised the model to reflect the prevailing conditions in Zimbabwe. Although the quantitative model output will be specific to this setting, we believe that our methodology and findings will be generalisable.
Methods
Details of the mathematical model have been described previously17 but we briefly explain the key features again here.
The model stochastically simulates disease progression in a cohort of HIV positive adults and tracks the services they receive, when they start ART and when they die. The size of each annual cohort is 5000 and preliminary analyses showed that cohort sizes greater than this did not lead to materially different means or variances in output statistics. Each individual is modelled independently and the properties of the individual and the timing of events are calculated probabilistically based on a series of rules and parametric distributions. The data used to parameterise the disease-progression part of the model are taken from several African studies (on the assumption that the natural history of HIV will be broadly similar in African populations) and the composition of the model cohort is based on the age and sex distribution of incident infections between 1998 and 2002 in eastern Zimbabwe.18
Each individual is assigned a CD4 count after seroconversion and a fixed rate of CD4 decline19 so that in the cohort there is a range of fast and slow progressors. The parameters determining the CD4 count at which clinical signs of severe immune suppression may be detected by a trained clinician is based on data from Uganda20 and Ethiopia.21 After the CD4 count reaches 200 cells/μl, the time until death without treatment is exponentially distributed with median 11 months.22 The median time between infection and death in the model is ∼9.5 years, which is in good agreement with independent observation.23
A range of possible points at which an individual can be diagnosed with HIV is represented. Individuals can discover they are infected when presenting at a clinic after developing symptoms. The CD4 count at which an individual develops symptoms sufficiently severe to seek medical attention is drawn stochastically from a distribution based on data from clinic attendees in Côte d'Ivoire.24 Women can find they are infected when tested at an antenatal clinic (ANC). Age and disease-state specific fertility rates25–27 are used to capture the timing of pregnancies and two hypothetical scenarios are defined for the chance that a pregnant women attends an ANC and is referred to the ART programme: ‘low referral rate’ (10% of pregnant women) and ‘high referral rate’ (90%). Individuals can also be tested for HIV when attending a voluntary counselling and testing session, through provided-initiated testing with symptoms unrelated to HIV28 or, for men, through extended ANC services if their partner is pregnant29; in the model these possibilities are combined and called ‘testing’. HIV testing uptake can be ‘low’, where 5% of individuals are tested before they develop symptoms or ‘high’, where 70% are tested. Alternatively, the individual may die before they are diagnosed with HIV.
Once an individual is known to be infected with HIV, they are managed by the ART programme. Immediately after diagnosis there is a ‘pre-ART monitoring appointment’ and the need for ART is assessed. If the individual does not start ART at the first appointment and ART is currently available, another ‘pre-ART monitoring appointment’ is scheduled after a set interval (6 months unless otherwise specified). If the patient develops symptoms before the next appointment they can nevertheless attend another appointment for immediate assessment. If ART is not available at the time of the first appointment, no further appointments are arranged. The chance that individuals diagnosed before ART is available access the ART programme decreases exponentially over time since the initial appointment; in the model there are three hypothetical scenarios whereby most (∼90% after 5 years), some (∼50%) or few (∼10%) such individuals are found.
Whether an individual should start ART is determined by an ‘initiation rule’. This can be based on symptoms (symptomatic initiation) or also on a CD4 count in the way recommended by WHO (CD4 initiation)—that is, to initiate if the count is less than 200 cells/μl of peripheral blood, or if it is less than 350 and the patient has symptoms of severe immune suppression.30
In the absence of long-term follow-up studies from low-income settings, three sets of assumptions are made about survival on ART: ‘best’, ‘medium’ and ‘worst’. First-year mortality is parameterised using data from the ART-LINC collaboration of cohort studies in low-income settings31 with the medium scenario set by the point estimates and the other scenarios set by the bounds of the 95% CIs. The relationship between CD4 count, symptoms and hazard of death after the first year is based on data from high-income settings.32 In the ‘best’ scenario the hazard of mortality observed in the first 3 years is assumed to stay constant over time on ART, in the ‘medium’ scenario it increases gradually and in the ‘worst’ scenario the hazard of death increases sharply. The ‘medium’ scenario (used in simulations unless otherwise stated) produces 4-year survival rates of ∼75% for those starting with CD4 counts below 50, and 90% for those starting with CD4 count between 200 and 349, which is in good agreement with longer-term analyses of the ART-LINC.33
Patients are also monitored while they are on ART, although in the model this does not affect ART survival outcomes. Unless otherwise specified, ‘on ART follow-up’ appointments are scheduled every 6 months.
Estimates and projections of new infections in Zimbabwe were based on previous modelling work34–36 (figure 1A). The overall ‘best incidence estimate’ was derived by fitting a transmission model of HIV to observed prevalence data. This scenario includes reductions in risk behaviour during the 1990s representing the broad behavioural changes that are thought to have occurred at this time.18 ,37 ,38 To quantify the influence that these changes may have on future projections of ART need, an alternative scenario is created without these changes in risk behaviour but with all other parameters the same. A final scenario is used to investigate the impact of prevention interventions scaled up between 2005 and 2010 that successfully reduce HIV incidence. Although this could plausibly represent many types of intervention, we have chosen to base it on the scale-up of high-impact testing and counselling services.36 ,39 ,40
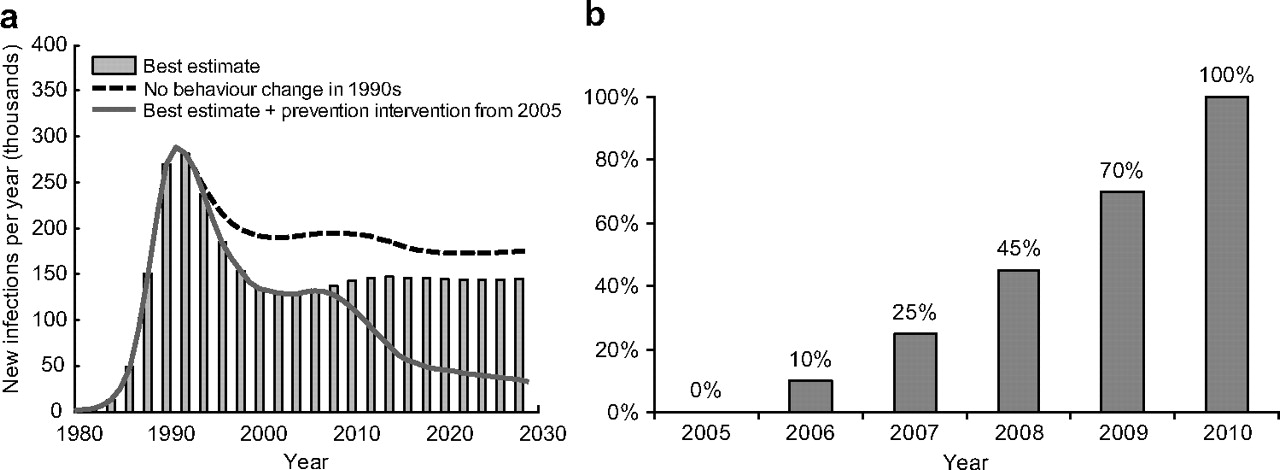
Assumptions about course of epidemic and scale-up of antiretroviral treatment (ART) programme. A. Estimated and projected numbers of new HIV infections in Zimbabwe between 1980 and 2030. B. Estimated and projected fraction of population to whom ART is available.
Non-AIDS related mortality rates were based on World Bank estimates from the pre-AIDS era.41 ,42 Reflecting changes reported in successive surveys,43–45 fertility rates are assumed to decline linearly from 1980 (total fertility rate ∼7) to 1999 (total fertility rate ∼4) and to remain constant thereafter. The population size in the simulation is matched to census data from 2002.46 The model population has an annual growth rate of 1.7% in the period 1998–2005, which is in good agreement with direct field observation.47
It is assumed that access to ART before 2006 was minimal, optimistically, that universal access will be achieved by 2010 and that the rate of scale-up increases steadily over time (figure 1B). (These provide a standard set framework within which to test the influence of other factors. Alternative assumptions about the rate of scale-up do not materially affect the conclusions.) The number of doctors and nurses trained to initiate ART is based on the latest available data (December 2006) from the Ministry of Health and Child Welfare in Zimbabwe. These show that 174 doctors have been trained to initiate ART and 1530 nurses have been trained to monitor those not yet on ART and care for those already receiving ART.
Results
Understanding trends in ART need and resource requirements over the course of HIV infection
We approach the problem by considering the monitoring and ART needs in a theoretical cohort of 1000 individuals infected with HIV at the same time. In each model cohort, the number of pre-ART monitoring appointments increases over the first years of infection as more individuals enter the healthcare system after being diagnosed with HIV (figure 2A). Five years after infection, the monitoring load has peaked and more patients are being started on ART. The magnitude and timing of the peak in monitoring load and initiation on ART are determined by how efficiently women testing positive at ANCs are referred to ART programmes and on the uptake of testing; when individuals are diagnosed earlier, the monitoring case-load is greater and peaks earlier.

Antiretroviral treatment (ART) and monitoring requirement in a HIV infected cohort. A. Number of simulated appointments in a cohort of 1000 HIV infected individuals over time since infection. B. The number of individuals currently receiving ART in a cohort of 1000 infected individuals over time since infection. C. The number of individuals currently receiving ART in cohorts of 1000 individuals infected in 1993, 1998, 2003 and 2007 over calendar year. Here ART is assumed to become available to all cohorts equally in 2008. D. The number of healthcare appointments to assess the need for ART with individuals in cohorts infected in 1993, 1998, 2003 and 2007 over calendar year. Unless stated otherwise, in all plots, patients are monitored every 6 months and ART is started using CD4 counts. (Note: in all these cohort simulations, it assumed that all individuals are infected at the same time.)
The variation in the time until progression to AIDS means that a steady stream of individuals should be started on ART between (approximately) 5 and 15 years after infection. Ten years after infection, with more individuals on ART, following-up on treatments patients becomes the most common type of appointment with the healthcare workers (figure 2A). The number of follow-up appointments required is closely related to the period between such appointments, the number initiated on ART and survival time on ART.
The number of individuals from a cohort of infected individuals on ART will be determined by the balance between the number newly starting treatment and the mortality rate on treatment. Programmes can initiate ART when individuals develop symptoms of severe suppression (symptomatic initiation) or use CD4 counting machines as well (CD4 initiation). With CD4 initiation, individuals can start ART earlier because a low CD4 count can precede the onset of symptoms, and overall more individuals can start because some will not develop symptoms in time to start ART (dying before the first appointment after symptoms develop). Furthermore, survival rates on ART are much better if the CD4 count is higher when it started.31 ,32 In total, compared to symptomatic initiation, CD4 initiation will lead to the number on ART increasing sooner to a higher level and declining more slowly over time since infection (figure 2B).
The long-term effects of ART on survival have not been directly observed leaving considerable uncertainty in any long-term projections. We modelled the impact of three alternative scenarios for how mortality on ART could change over time, which are consistent with the rates of mortality observed in the first months on ART in low-income settings31 (figure 2B). For the first 10 years after infection, the projected number on ART is the same under each of these scenarios because the principal determinant is the rate of individuals starting treatment (which is linked to the method of initiation). The projections diverge after 10 years and the disparity is greatest 20 years after infection where twice as many individuals are estimated to be receiving treatment under ‘best case’ rather than ‘worst case’ assumptions.
As ART becomes available, the patients starting treatment will come from several different cohorts that were infected in the previous years. Since ART initiation is usually 5–15 years after infection, the mix of patients will be dominated by those infected in the last 5–15 years (figure 2C). When ART is not available, those individuals who progress to AIDS fastest will die first leaving behind the few individuals that naturally progress slowest. This means that older cohorts will have fewer remaining patients to start ART, but those patients will probably have atypically high CD4 counts and are likely to survive longer on ART. In contrast, those who start treatment first in cohorts infected recently are likely to be ‘fast progressors’ who will likely fail on ART sooner. In figure 2C this can be seen by the slightly steeper downward gradient of the number on ART for those infected in 2003 versus those infected in 1993. The different shapes of the curves is also influenced by the timing of ART need in the older cohorts being more varied than in the more recently infected cohorts. As ART scale-up continues, the mix of clients will become increasingly dominated by those infected recently and so average survival might tend to decline over time.
In the first years of the ART programme, the mixture of those starting ART will also be influenced by whether or not patients that were diagnosed with HIV before ART was available can enter the programme. If the older cohorts are lost (eg, through moving away, not being reminded to return to the clinic, etc) then the monitoring load and ART delivery will be directed to only those entering healthcare since ART became available. If, instead, some can be found, then the monitoring load when ART does become available will be much greater because these older patients represent ‘stored-up demand’ for clinical attention (figure 2D). Therefore, projections of monitoring needs and numbers on ART need to consider the extent to which older cohorts access the current programme.
Making projections of ART need and resource requirements
To make projections for the population overall (instead of specific cohorts), it is necessary to calculate the experiences of many theoretical cohorts representing all those infected since the beginning of the epidemic. These cohorts have to vary both in their relative size (determined by the estimate of incidence and population size) and in the time between infection and ART becoming available (set by the rate of ART access scale-up). The latter is important because universal access cannot be achieved instantaneously and some individuals will have to wait longer than others to receive ART even if they need treatment at the same time. The overall projection is the sum of the requirements in all these representative cohorts.
The overall estimate for the number of appointments required and the number on ART in Zimbabwe between 2000 and 2030 is shown in figure 3 and a univariate sensitivity analysis is given in table 1. Approximately 4000 patients are started on ART each month during this period. The pre-ART monitoring case-load increases over time when ART becomes available—up to ∼80 000 appointments per month in 2030. The number of follow-up appointments with patients on ART follows the same trend as the numbers on ART; with follow-up monitoring every 6 months, this equates to more than 100 000 appointments each month.

Projected numbers on antiretroviral treatment (ART) and healthcare requirements in Zimbabwe. The assumptions made are the defaults listed in table 1: symptomatic initiation, monitoring all patients every 6 months, ‘medium’ survival assumptions, high antenatal clinical referral but low testing uptake, some surviving individuals diagnosed before ART available enter the programme and no further high-impact behaviour change intervention.
Univariate sensitivity analysis. The overall estimate (top row) gives the projection with the default parameter values (underlined). The additional number of appointments, number on antiretroviral treatment (ART) and life-years saved are given in lower rows with one parameter changed at a time
If the ART programme is scaled-up as shown in figure 1, universal access in 2010 will equate to ∼110 000 individuals receiving treatment (figure 3 and table 1). Sustaining universal access will lead to approximately ∼670 000 individuals receiving ART in 2030. With alternative survival assumptions but all other conditions the same, the projection for the number receiving ART in 2030 ranges between 480 000 and 780 000.
Besides survival, the long-term (2030) estimates are most sensitive to changes in incidence over time and patterns of ANC referral and testing uptake (table 1). The ART programme in Zimbabwe is already benefiting from the behavioural changes of the 1990s, which may have reduced by 38 000 (26%) the number of individuals expected to be receiving ART in 2010. High-impact infection prevention intervention scaled up between 2005 and 2010 will not affect the short-term projections, but, if they reduce incidence, could lead to ∼310 000 fewer people receiving ART in 2030—a 46% reduction that could increase further over time.
Monitoring individuals from early in their infection allows more individuals to enter care and for ART to be initiated at the right time.17 Currently, testing uptake is low in Zimbabwe39 ,40 ,48 but if 70% of infected individuals are tested sometime before they develop symptoms, and 90% of HIV infected pregnant women are referred from ANC, then 2 000 000 (30%) more individuals would be on ART by 2030 and 64 000 extra life-years would have been saved each year between 2005 and 2030.
In the model, monitoring patient's pre-ART every 12 months instead of every 6 months leads to ∼37% fewer appointments with healthcare workers but means that ART cannot always be started at the right time and fewer start ART and less life-years are saved.17 Monitoring every 3 months leads to ∼78% more pre-ART appointments but increases the chance that ART is started at the right time. The clinical advantage of more frequent monitoring depends on the initiation rule: with symptomatic initiation, 160 000 more life-years are saved by 2030, but with CD4 initiation instead, 520 000 more life-years are saved.
Taking these factors together, for the same ‘universal access’ scenario, the model predicts that as few as 160 000 or as many as almost 2 million could be receiving treatment in 2030—more than a 10-fold difference (table 1, lower rows). With the same assumptions about incidence (but with all other parameters varied), the projection ranges between 336 000 and 2 million (a fivefold difference), and with the same assumptions about incidence and survival on ART, the projection ranges between 500 000 and 180 000 individuals on ART (a threefold difference). This large variation is generated entirely by making alternative assumption about delivery, which have not been incorporated in other projections.
In Zimbabwe, monitoring and follow-up appointments can be with nurses but ART must be started by a doctor. Under the current conditions, it is estimated that in 2010 nurses will have to meet ∼27 pre-ART monitoring appointments and ∼12 follow-up appointments each month. Doctors will have to meet ∼22 patients to initiate ART each month (figure 4A—‘current conditions’). Anticipated changes, such as increased HIV testing, initiation with CD4 counts and more frequent monitoring, could save 50% more life-years but will require ∼70 additional appointments for nurses and ∼20 additional appointments for doctors (figure 4A—‘optimal conditions’). This amounts to every doctor initiating two patients each working day. By 2030, the follow-up case-load will have substantially increased (figure 4B). Reductions in incidence could reduce the monitoring load for nurses and initiation load for doctors by 2030, but the follow-up load for nurses will remain very high (figure 4A—‘optimal conditions + intv’).

Alternative projections in increasing case-load for doctors and nurses in A) 2010 and B) 2030. Under the ‘current’ management strategy, antiretroviral treatment (ART) is started and patients are monitored as in the default assumptions in figure 3 and table 1. In the ‘optimal’ scenario, instead ART is started using CD4 counts, patients are monitored every 3 months, testing uptake is high and many surviving individuals diagnosed before ART available enter the programme. The ‘optimal + intv’ scenario is the same as ‘optimal’ scenario but HIV incidence is assumed to decline in response to scale-up of a highly effective HIV prevention intervention. It is assumed that the number of doctors and nurses trained and in active service is constant.
Discussion
Using a mathematical model that incorporates observational data about HIV/AIDS disease progression, clinical monitoring and the impact of ART, we have made hypothetical projections of the number of individuals on ART and the number of appointments with doctors and nurses in Zimbabwe over the next 25 years. The burden of the ART programme on the healthcare system is expected to be great and will increase over time. For example, in one simulation, by 2030 some 670 000 individuals could be receiving ART, which is equivalent to ∼8% of the current adult (aged 15+ years) population.46 By 2010, every day doctors will have to initiate approximately two patients and nurses will have to monitor up to five patients pre-ART and on ART. This is in addition to their many other duties, which are also set to increase.7 The aggregation of healthcare workers in the main cities6 means that the increased case-load could be even greater in rural areas. The increase in case-load could be more severe in the many other African countries with fewer doctors and nurses49 that are experiencing an HIV epidemic of the same magnitude as Zimbabwe. For example, in Free State, South Africa, the stored-up demand for clinical attention among those infected long before ART became available has already overwhelmed provision leading to lengthening queues for ART initiation, and it has been found that individuals waiting have suffered high rates of mortality.50
Our model indicates that without frequently monitoring individuals' need for ART from early in the infection, the population level impact of ART programmes will fall far short of their potential. Therefore, it is vital that more doctors and nurses are trained to deliver ART as the programme and testing services are scaled-up. In the context of substantial out-migration of healthcare workers in low-income settings,51 ,52 especially in Zimbabwe,37 ,51 it is crucial that those receiving training are retained. Currently ART is only initiated by doctors causing a bottle-neck in service provision that could critically delay patients starting ART. Allowing nurses to initiate ART could only ease this problem in the short-term; that is, before the anticipated demand for follow-up care by nurses accumulates.
A mechanistic model of the processes involved in ART delivery can help expose how the context and strategy of an ART programme can lead to substantial differences in the total number that receive ART, average survival on ART and the number of appointments with healthcare workers. In some settings, CD4 machines are used to determine when to start ART.53 A low CD4 count can precede symptoms of immune suppression and more reliably indicates the need for ART.20 ,21 ,24 This enables more individuals to start ART and the typical starting CD4 count to be higher leading to longer survival times31 and more individuals on ART at a given time. Over time, monitoring needs and average survival on ART could change as programmes recruit infected individuals earlier,28 including fast progressors who may fail on ART sooner. On the other hand, increased referral from ANCs will typically contribute relatively healthy, young women to the programme who will be monitored for many years before starting ART with a relatively high CD4 count. Variation in these programmatic factors generates projections for the number on ART in 2030 that deviate by ∼1.3 million (with the same survival, incidence and scale-up assumptions).
Further sources of uncertainty in these projections are the assumptions about incidence in the past and the future, which can only be roughly estimated. Because short-term projections rely most on incidence in the recent past, survival on ART in the first few years and the current programmatic set-up, these estimates are much more certain than long-term projections. The model, in fact, does not incorporate the potential for treatment to itself influence the rate of new infection.54–56 However, the model does clearly show that, with all others things remaining the same, ∼310 000 fewer patients would be receiving treatment in 2030 if a high-impact prevention intervention (such as testing and counselling36 ,39 ,40) is scaled-up immediately, and this considerable cost saving should be recognised.9
As with all projections, it is not possible to accurately represent all factors (such as the actual rate of scale-up of services, availability of second-line drugs changes in mode of criteria for ART initiation, changes in the way ART is delivered or the roles of doctors and nurses, socio-political environments, future rates of training doctors, trends in migration). Therefore, we recognise that these long-term estimates do not constitute reliable literal forecasts, although we do believe they provide a useful guideline and indicate the structural factors that have most influence. The factors with the strong influence (timing of entry to care, the frequency of monitoring patients not yet on treatment and the method used to initiate treatment) are likely to vary between countries and over time, and we believe that this work supports using mechanistic models to make projections for many settings, which must be updated to reflect changes in conditions and policy. Our models also shows how long-term resource requirements are determined by clinical and programmatic decision made today, which should contribute to the design and management of ART programmes that is currently under way.
There are certain limitations to the design of the mathematical model we used in this analysis.17 There is a paucity of data on the precise relationship between the WHO staging criteria and CD4 count, although the data we have used20 ,21 is in good agreement with a greater number of reports associating the average CD4 count among patients with certain conditions.57–59 In the absence of more detailed data, the model does not differentiate between WHO stage 3 and 4 disease and cannot replicate the clinical judgement, which should be used to determine how soon patients with stage 3 symptoms should be started on ART.30 Instead, it identifies individuals that develop ‘severe symptoms of immune suppression’, which is analogous to WHO stage 3, and patients with stage 4 symptoms will only be started if their CD4 count falls below the threshold being used for starting any symptomatic patient (the WHO recommendation is for such patients to be initiated irrespective of CD4 count). However, patients with stage 4 disease will seldom have higher CD4 counts than this threshold so the model will only slightly underestimate the impact of following the WHO guidelines. The model also does not include differential patterns of adherence to treatment nor individuals failing first-line treatments and moving to second-line. We implicitly assume that variance in adherence is captured in the distribution of survival on treatment that we used, and that switching treatment occurs during the scheduled follow-up appointments, and its availability and success is reflected in the range of assumption about long-term survival. We have also not explicitly modelled the financial or human resources required for the particular amount of ART drug or appointments per year projected. In reality, important ‘economies of scale’ effects may operate to increase the efficiency of providing the service to a larger number of patients—for example, though specialisation of healthcare workers—and this has been considered elsewhere.13
In conclusion, we have shown that projections for resource requirements that do not capture the impact of different patient management and initiation strategies and the shifting composition of patients entering programmes may deviate substantially from the actual future requirements of ART programmes.4 ,9 ,11 ,14–16 Understanding the relationship between current programmatic policy and long-term resource requirements and quantifying the uncertainty inherent in many parameters can enable better programme management now as well as better planning for the future.
Key messages
-
To provide sustained access to antiretroviral treatment (ART) in the coming years it will be essential to anticipate how demands for essential material and human resources will change.
-
We used a mathematical model of treatment delivery to make projections for some of the resource required for universal access to ART in Zimbabwe.
-
The model shows how the demand for treatment will increase monotonically for the next decade in Zimbabwe even if the number of new HIV infection is reduced.
-
Appointments for assessing the need for ART will increase in the short-term, while demand for appointments monitoring patients will increase to greater levels in the medium and long-term. This argues for an urgent reassessment of the roles of health workers, as well as investment in recruitment and retention.
-
Our models show how long-term resource requirements are determined by clinical and programmatic decisions made today, which should contribute to the design and management of ART programmes that is currently under way.
-
Since programmes vary between countries and over time, these results suggest that long-term resource projections should be made locally and be continually re-evaluated.
Acknowledgments
The authors are grateful for the contributions of all those attending two workshop in Harare in July 2006 and January 2007, which was jointly organised by the authors and the Centers for Disease Control and Prevention.
References
Footnotes
-
Funding The Wellcome Trust and the Medical Research Council.
-
Competing interests We declare that there are no conflicts of interest. SG owns shares in GlaxoSmithKline and Astra Zeneca.
-
Provenance and peer review Not commissioned; externally peer reviewed.
-
Open Access This is an Open Access article distributed in accordance with the Creative Commons Attribution Non Commercial (CC BY-NC 3.0) license, which permits others to distribute, remix, adapt, build upon this work non-commercially, and license their derivative works on different terms, provided the original work is properly cited and the use is non-commercial. See: http://creativecommons.org/licenses/by-nc/3.0/