Article Text

Abstract
Background Countries measure trends in HIV incidence to assess the impact of HIV prevention and treatment programmes. Most countries have approximated trends in HIV incidence through modelled estimates or through trends in HIV prevalence among young people (aged 15–24 years) assuming they have recently become sexually active and have thus only been recently exposed to HIV.
Methods Trends in HIV incidence are described and results are compared using three proxy measures of incidence: HIV prevalence among young women attending antenatal clinics (ANCs) in 22 countries; HIV prevalence among young male and female nationally representative household survey respondents in 14 countries; and modelled estimates of adult (ages 15–49 years) HIV incidence in 26 countries. The significance of changes in prevalence among ANC attendees and young survey respondents is tested.
Results Among 26 countries, 25 had evidence of some decline in HIV incidence and 15 showed statistically significant declines in either ANC data or survey data. Only in Mozambique did the direction of the trend in young ANC attendees differ from modelled adult incidence, and in Mali and Zambia trends among young men differed from trends in adult incidence. The magnitude of change differed by method.
Conclusions Trends in HIV prevalence among young people show encouraging declines. Changes in fertility patterns, HIV-infected children surviving to adulthood, and participation bias could affect future proxy measures of incidence trends.
- AFRICA
- HIV
- SURVEILLANCE
This is an open-access article distributed under the terms of the Creative Commons Attribution Non-commercial License, which permits use, distribution, and reproduction in any medium, provided the original work is properly cited, the use is non commercial and is otherwise in compliance with the license. See: http://creativecommons.org/licenses/by-nc/3.0/ and http://creativecommons.org/licenses/by-nc/3.0/legalcode
Statistics from Altmetric.com
Introduction
Since the 2001 United Nations General Assembly Special Session Declaration on HIV/AIDS and with the renewed pledge of the 2011 Political Declaration on HIV and AIDS, governments have committed themselves to reducing and eventually eliminating new HIV infections.1 ,2 Reducing HIV infections requires a rapid scale-up of HIV prevention activities. In addition, countries must be able to measure trends in new HIV infections in order to establish the success of this scale-up. However, measuring HIV incidence and trends in incidence remains a significant challenge. Despite over a decade of research into a clinical measure to determine whether an HIV infection is recent, the technology is still not available in most countries. Recent progress has been made in developing algorithms employing two or more incidence assays in sequence to reduce the number of tests that are falsely categorised as recent infections. Guidelines on how to use these algorithms in resource-limited countries have recently been published.3 Yet challenges remain due to the technical requirements to collect data on multiple biological variables and to correctly interpret results.3–6 As a result, many countries with generalised HIV epidemics rely on proxy measures or modelled estimates of HIV incidence trends.7
In epidemics where new HIV infections are primarily among the general population (ie, generalised epidemics), trends in HIV prevalence among young people aged 15–24 years have been used as an indicator of trends in new infections among the adult population aged 15–49 years.8–10 This proxy measure is assumed to be appropriate if HIV infections among young people occur only through sexual transmission. As individuals in this age group are likely to have only recently started sexual activity, infections would be recent. However, this assumption is challenged if more children who were infected through mother-to-child transmission (vertical transmission) survive into adulthood because of increasing access to antiretroviral therapy (ART). One model for southern Africa estimates that up to one-third of children infected with HIV will survive to their reproductive years.11 Large changes to the levels of non-sexually transmitted HIV infections (such as through unsafe injections) also could potentially impact the validity of this indicator.
To measure trends in HIV prevalence among adults and young people specifically, countries with generalised epidemics have been advised to carry out routine HIV surveillance among women who attend antenatal clinics (ANCs).12 Left over blood samples, which are routinely collected for syphilis testing, are additionally tested for HIV in an unlinked, anonymised method usually without consent, thus minimising self-selection bias. Most countries carry out surveillance exercises either every year or every other year in a convenience sample of ANCs.13 When surveillance efforts were first introduced in the 1990s, countries often selected sites in urban centres.14 However, more recently, countries have expanded to rural areas to provide estimates that are more representative of the population generally. Despite improvements, the surveillance sites are still not necessarily nationally representative; thus it is recommended by UNAIDS that estimates of prevalence from ANCs should only be used to monitor trends and not to estimate prevalence levels.13 ,15
Previous studies have noted the importance of the impact of changes in fertility patterns on ANC prevalence data.8 ,9 ,16 Since 2005 there have been dramatic increases in the coverage of services to prevent mother-to-child transmission and to provide ART to people living with HIV, especially in sub-Saharan Africa.17 These changes have reduced the probability of vertical transmission of HIV and improved the survival outcomes of adults living with HIV.18 ,19 These improvements are likely to change the fertility intentions of HIV-positive women. Similarly, as more women are started on ART their ability to conceive and carry a pregnancy to term will improve, increasing their biological ability to have children.20 At the same time, with the roll-out of integrated HIV treatment and family planning programmes, HIV-positive women may have improved access to contraception that allows them to reduce their exposure to unintended or unwanted pregnancy, potentially diminishing fertility among HIV-positive women. These changes in fertility patterns could result in a change in the number of HIV-positive women attending ANCs. In turn, this could alter the usefulness of ANC data to monitor trends in HIV prevalence.
Since 2000 more than 40 countries have included HIV testing in nationally representative household surveys. These studies avoid the potential bias of excluding women who do not become pregnant or do not attend ANCs, and collect data on both men and women. However, these surveys can potentially introduce their own bias. For example, respondents who refuse to participate in the survey might have different HIV prevalence levels than the general population.21
There have been limited studies to determine if trends in HIV prevalence among young people are a good proxy for trends in adult HIV incidence22 and no studies systematically compare these trends for countries with available data. In this paper we assess the evidence for declines in HIV incidence by reviewing current trends in HIV prevalence among young people aged 15–24 years derived by two different methods and by reviewing modelled estimates of adult HIV incidence for 26 generalised epidemic countries. We compare the results from the three sources and consider the potential biases of the different sources.
Methods
Three methods of approximating incidence were used in this analysis. Data collected for HIV sentinel surveillance among 15–24-year-old women attending ANCs were compiled for 22 countries with generalised epidemics. Median HIV prevalence among women aged 15–24 years by ANC site was collated from national reports submitted to UNAIDS. Only sites with data for at least three rounds of surveillance were included. Some ANC surveillance systems have changed the sites participating in the surveillance over time. Therefore, to avoid sites with different prevalence levels added over time potentially introducing bias, only sites with data for the first or second rounds of surveillance and the last round of surveillance were included. For South Africa the historical data were only available by province and not by site, and so there was no censoring of sites. A regression using an exponential curve was calculated based on the years with observed data. For years between 2000 and 2011 in which no ANC surveillance was conducted, projected values were predicted based on the regression parameters using Stata V.12 (StataCorp, College Station, Texas, USA). Upper bounds and lower bounds to the trend lines were calculated based on 95% CIs.
As of mid-2012, 14 countries with a generalised epidemic had carried out multiple rounds of nationally representative household surveys with HIV testing, thus providing comparable trend data over time. Prevalence data reported in the survey reports are weighted to reflect the two-stage sampling and to compensate for non-response. HIV testing was carried out using dried blood spots on filter paper, which were then analysed at a national reference laboratory for most countries. In Zambia in 2001 and Uganda in 2005, venous blood was used instead of dried blood spots. Further information and survey data are available from the Measure DHS website (http://www.measuredhs.com). Reports for the South Africa and the Botswana surveys are available from the respective websites http://www.hsrc.ac.za and http://www.gov.bw.
Adult HIV incidence values were estimated using Spectrum V.4.50 (http://www.futuresinstitute.org).23 Estimates of adult incidence were extracted from country files submitted to UNAIDS in April 2012. HIV incidence is estimated through the Estimates and Projections Package (EPP) within Spectrum. Users enter information on HIV prevalence measured in ANC surveillance among attendees aged 15–49 years and household survey respondents for men and women aged 15–49 years and the number of adults receiving ART and women receiving prophylaxis to prevent mother-to-child transmission. EPP then back calculates HIV incidence from the measured HIV prevalence and the number of people on ART, and generates an HIV incidence curve for the years 1970 through 2011 using a Bayesian melding technique to identify the best fit to the retrospective prevalence data.24 The derived incidence curve is then used by Spectrum to estimate the number of people living with HIV by age group and year. Although EPP only uses information on persons aged 15–49 years, Spectrum adapts these data to estimate infections occurring through vertical transmission, and HIV prevalence among all age groups over time. Children who are determined to be infected through mother-to-child transmission progress until they become adults and are then captured in the adult prevalence and incidence estimates.
Spectrum uses data from the same ANC sentinel surveillance and household surveys that are used in this analysis to calculate proxy trends in incidence among people aged 15–24 years. However, the data used in Spectrum are for adults aged 15–49 years. In addition, to calculate HIV incidence Spectrum applies the effect of ART on HIV prevalence to account for the longer survival of those on ART.
Despite the potential differences in prevalence by sub-regions and sub-populations within countries, for the purposes of this paper and simplicity in summarising trends in 26 countries, we do not present sub-national data. All ANC sites regardless of urban or rural classification were analysed together.
Statistical methods
Regression analysis was used to determine the statistical significance of the change in the projected ANC prevalence between the years 2000 and 2011. An exponential curve was assumed for all countries. A p value of less than 0.05 was considered a statistically significant change. A χ2 test for the difference in prevalence between the two survey years was used to determine statistical significance for the nationally representative household surveys.
Spectrum calculates uncertainty bounds for incidence by running 1000 Monte Carlo simulations using randomly selected parameter values from within a set range. The uncertainty calculations are described elsewhere.25 However, it was determined that the uncertainty bounds did not reflect the full uncertainty of the models and thus these bounds are not used in this analysis.
To compare whether the trends from different methods showed similar results, the proportional change between two years was calculated for each of the methods. Modelled adult HIV incidence data were available for each year between 2000 and 2011. HIV prevalence data among young ANC attendees were projected for each year between 2000 and 2011 based on the trend line calculated from the data. Nationally representative household survey data were only available for 2 years over the 11-year period and the two years varied by country. The start and end years for the ANC data or modelled incidence data were changed to reflect the years of the surveys when comparisons were made with survey data. No statistical test for these changes was conducted because of the large amount of uncertainty in the different methods.
Results
Trends in proxy measures of HIV incidence
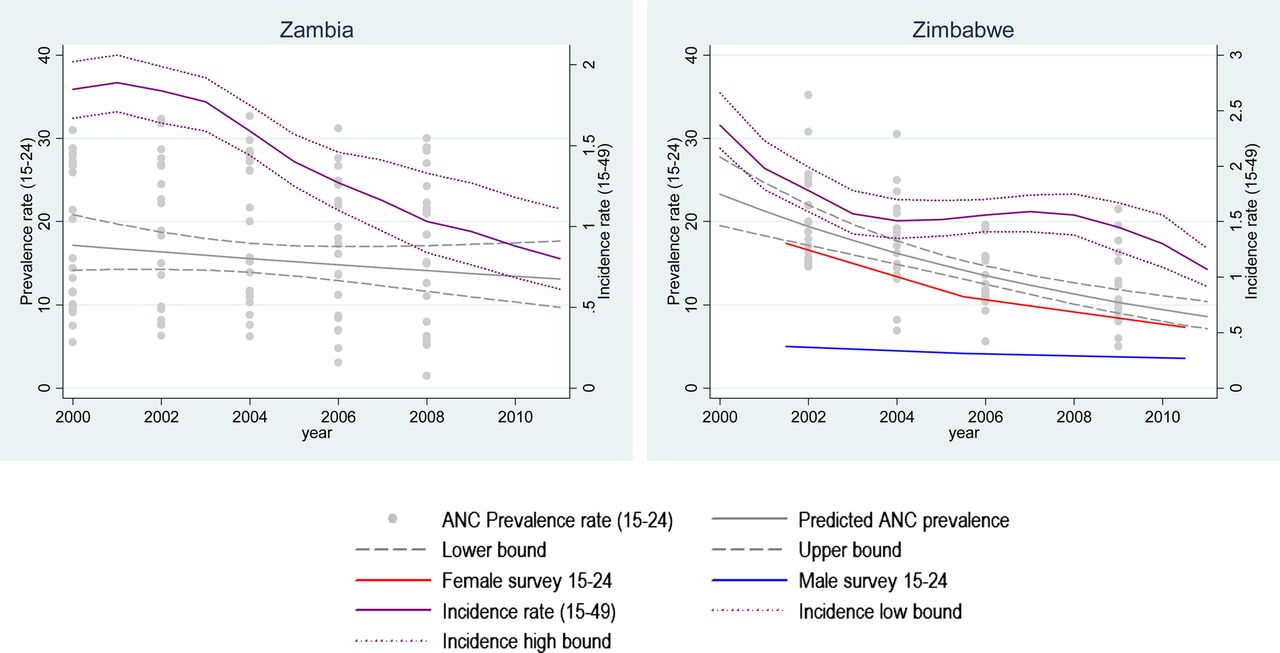
Except for Mozambique and Uganda, each of the 22 countries that provided ANC data had declines in HIV prevalence among young ANC attendees aged 15–24 years. Only 10 of the 22 countries had statistically significant declines in HIV prevalence (Botswana, Burkina Faso, DRC, Ethiopia, Ghana, Kenya, Malawi, Namibia, Togo and Zimbabwe). All but two of the 10 countries (Togo and Ghana) had declines of more than 50% between 2000 and 2011 (figure 1 and table 1).
Percent change in HIV prevalence among young women 15–24 years attending ANC, young respondents in nationally-representative household surveys, and modelled adult HIV incidence, 2000–2011
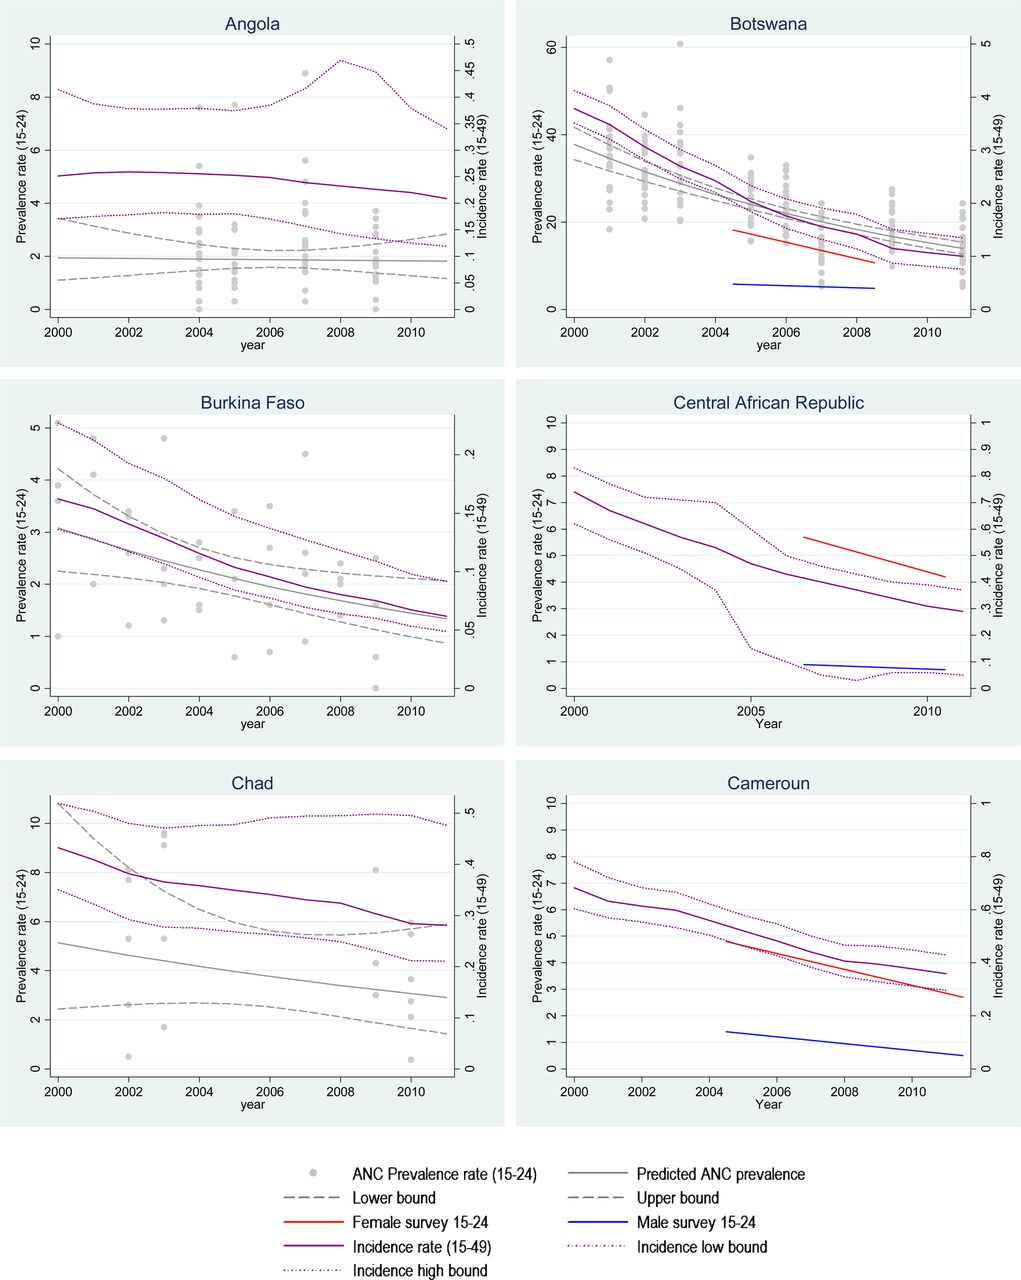


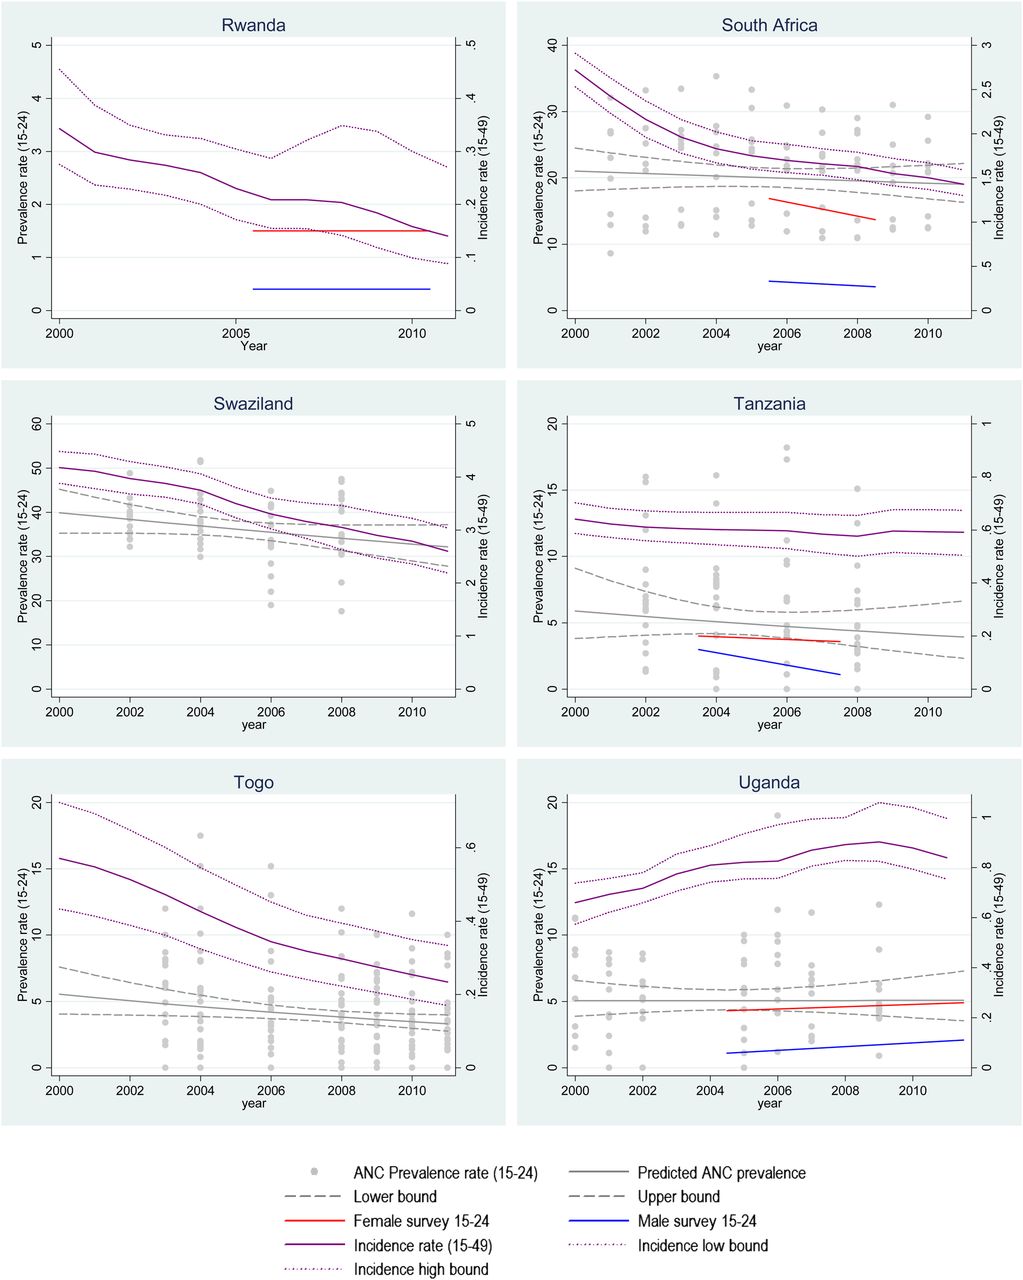

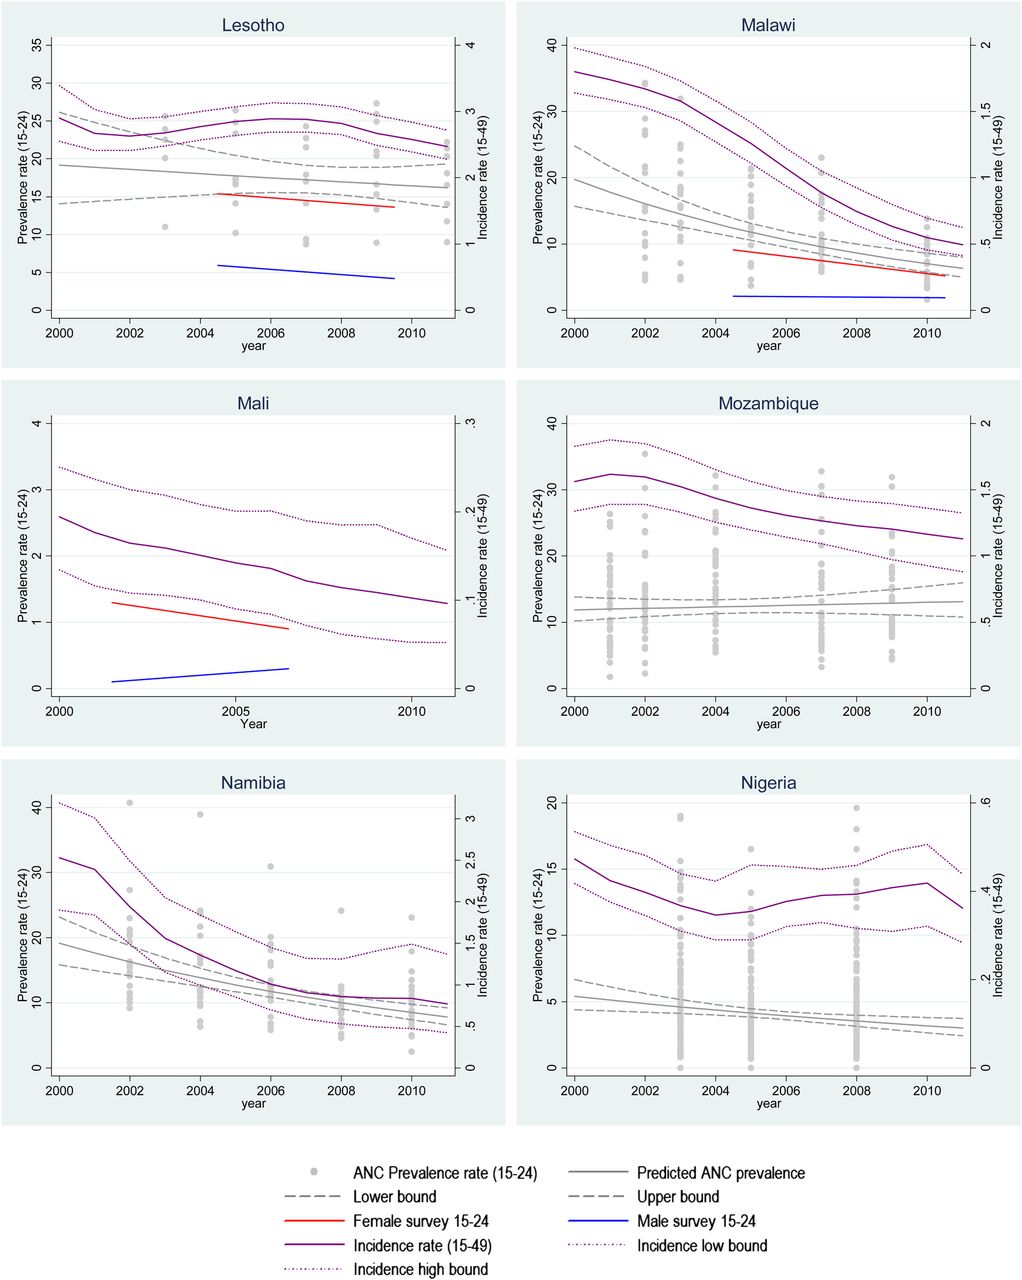
Trends in HIV prevalence among young women attending ANC, HIV prevalence among young survey respondents, and modelled HIV incidence, 2000 to 2011. ANC, antenatal clinic.
The household survey data showed that eight of the 14 countries had significant declines among young men and women when the two sexes were combined (Botswana, Cameroon, Central African Republic, Ethiopia, Malawi, South Africa, Tanzania and Zimbabwe). Uganda had a significant increase between 2005 and 2011. Nine countries had significant declines among women only (Botswana, Cameroon, Central African Republic, Ethiopia, Mali, Malawi, South Africa, Zambia and Zimbabwe) and only two countries had significant declines among young men (Cameroon and Tanzania). Uganda had a significant increase in prevalence among young men. Only Ethiopia had a decline of over 50% among young men and women.
Only Uganda had increases in modelled adult incidence. Fourteen of the remaining 25 countries had declines of 50% or more between 2000 and 2011.
Seven countries had no significant evidence of decline in ANC or survey HIV prevalence among young people and had declines in modelled incidence of less than 50% (Angola, Chad, Lesotho, Mozambique, Nigeria, Swaziland and Uganda).
Comparing incidence trends derived from different methods
Ten countries had both ANC and survey data for young women. The two methods indicated trends in the same direction for all countries. The proportional change varied by less than 20 percentage points in all countries (figure 2).
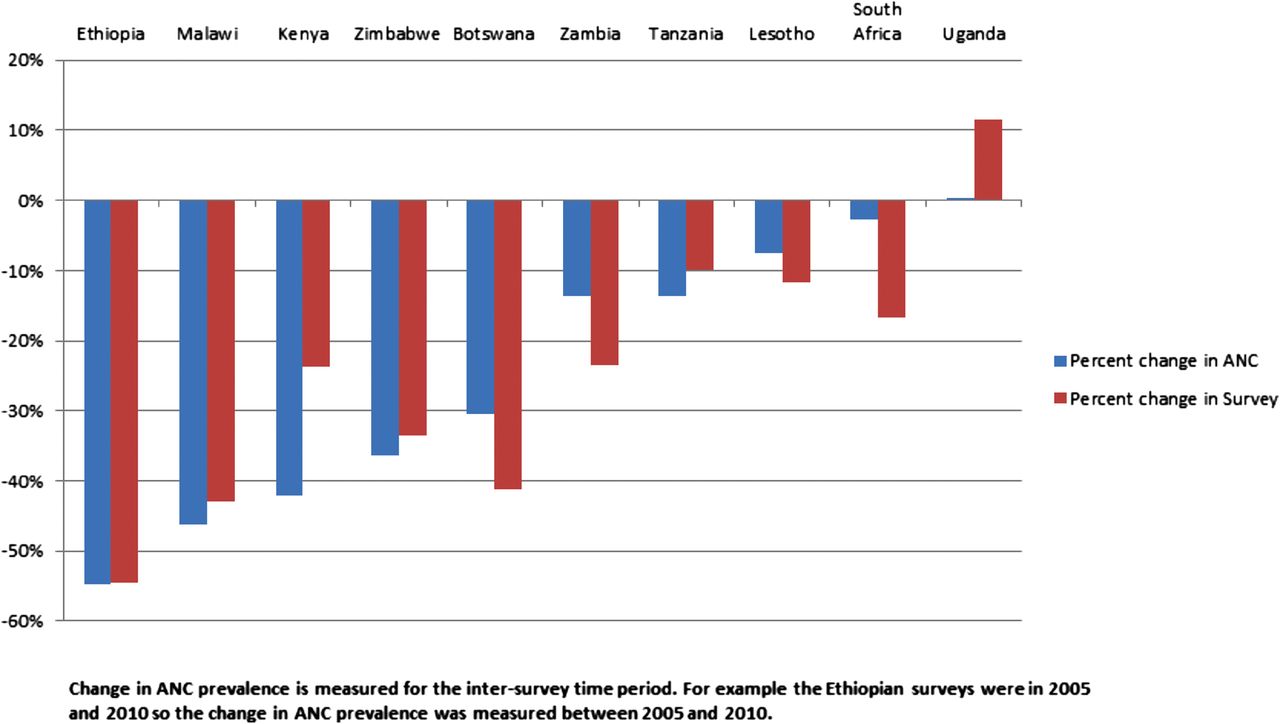
Percent change in HIV prevalence among young ANC attendees and young female survey respondents, various years between 2000 and 2011. ANC, antenatal clinic.
Comparison of trends in modelled adult incidence (both sexes combined) and prevalence among young women attending ANCs again showed good agreement in the direction of trends. Mozambique was the only country in which modelled adult incidence decreased while prevalence among young ANC attendees increased. However, the magnitude of the decline varied by method. Ten countries had more than a 20 percentage point difference in the proportional change in ANC prevalence and modelled adult incidence (Gabon, Ghana, Haiti, Kenya, Mozambique, Nigeria, South Africa, Uganda, Tanzania, and Zambia). Botswana, Burkina Faso, Ethiopia, Malawi, Namibia and Zimbabwe had a more than 50% decline in both methods (figure 3).

Percent change in HIV prevalence among young ANC attendees and percent change in modelled adult HIV incidence, 2000 to 2011. ANC, antenatal clinic.
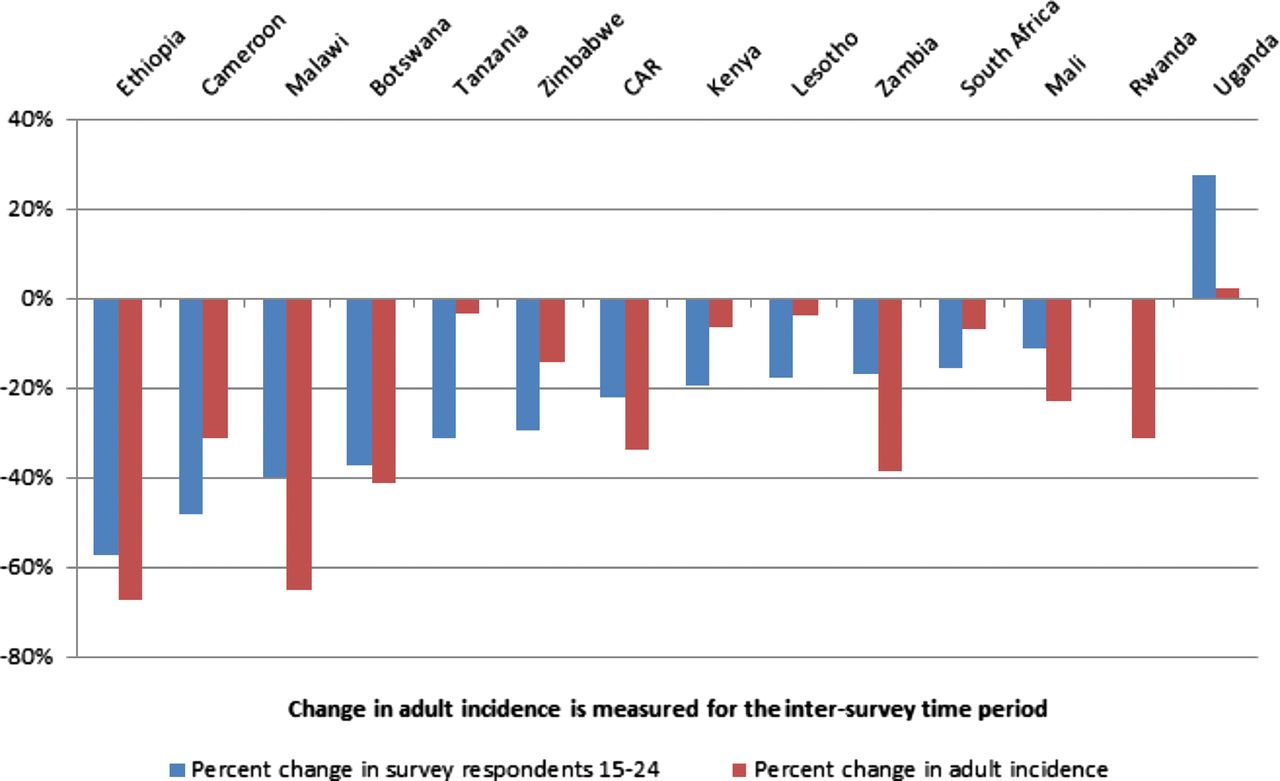
When the proportional change in the 14 countries with survey data (both sexes combined) was compared to modelled adult incidence (for both sexes combined), both methods showed results in the same direction. However, five countries had proportional differences of more than 20 percentage points. (Malawi, Rwanda, Uganda, Tanzania and Zambia) (figure 4).

Percent change in HIV prevalence among young survey respondents and percent change in modelled adult HIV incidence, various years between 2000 and 2011.
The modelled adult incidence reflects new infections in both men and women based on HIV prevalence data from women aged 15–49 years attending ANCs and combined HIV prevalence data from men and women aged 15–49 years responding in household surveys. Comparison of the modelled incidence with survey data for young men describes how well trends in prevalence among young men reflect estimated incidence. The difference in the proportional change was over 20% in 11 of the 14 countries with available data. In Mali and Zambia the survey data suggested increasing trends for men aged 15–24 years, while adult incidence suggested decreasing trends (see figure 1 and table 1).
Discussion
Twenty-five of 26 countries showed some evidence of a decline in proxy measures of HIV incidence between 2000 and 2011. Fifteen countries had statistically significant declines in either ANC prevalence data or survey prevalence data. HIV prevalence among young ANC attendees and young household survey respondents were triangulated with modelled adult HIV incidence to strengthen the evidence. HIV prevalence in ANC data, survey data and modelled adult incidence showed consistent results across 25 of the 26 countries considered here. There were inconsistencies in the results between young women attending ANCs and modelled adult incidence in Mozambique and between young men in household surveys and modelled adult incidence. The magnitude of the declines (or increase, in the case of Uganda) varied by method. Other research has suggested declining trends in HIV incidence for South Africa,26 ,27 Zambia28 and Kenya22 using various methods for measuring incidence trends.
National-level results do not provide enough specific details about changes in prevalence or incidence to allow programmatic decisions to be made. Within countries and populations there are differences in trends in new infections.28 Similar to the results presented here, Marsh, in a separate analysis, compared ANC surveillance data to prevalence data among young men and found that ANC data do not accurately measure trends among young men.29 This analysis provides a broad overview of the situation in countries with generalised epidemics. Further analysis should make the comparisons at sub-national levels to understand trends within countries.
There are three reasons why data on HIV prevalence among young ANC attendees and prevalence among young survey respondents might be more challenging to interpret in the future. First, increasing numbers of children infected through vertical transmission will graduate into the reproductive years because of increased access to ART. Once children exposed to current prevention of mother-to-child transmission (PMTCT) programmes reach adulthood this number will decrease due to effective PMTCT interventions reducing the number of children infected with HIV. Second, changes in fertility patterns among HIV-positive women due to increased access to ART could result in changes in HIV prevalence among women attending ANCs. Third, as more young people know their HIV status they might be more likely to refuse HIV testing in surveys or surveillance. ANCs will be affected by all three factors, while household surveys will be affected by the first and third factors only. The impacts of these factors on measuring trends in new HIV infections are described below.
Initial increases in the number of vertically infected children entering the 15–24-year-old age group might result in over-estimation of ‘new’ infections among young people and the proxy measure of HIV incidence trends might hide a decline in new infections.
Changes in fertility patterns among HIV-positive women and changes in the use of ART for prevention (whether for vertical or lateral transmission) will potentially change trends in HIV prevalence among young ANC attendees. If fertility patterns change, HIV prevalence among young ANC attendees might increase or decrease due to changes in the characteristics of women becoming pregnant and attending ANCs. As fertility changes and ART rolls out, interpretation of the HIV prevalence data collected at ANC sites might become more challenging and less representative of the general population. Numerous studies have described the potential biases to prevalence estimates if fertility patterns change.8 ,16 ,30 ,31 Recent efforts have been made to shift surveillance efforts to the use of routine data from PMTCT programmes.32 However, few countries use these data for surveillance purposes due to concerns regarding participation bias in the PMTCT programmes.
If household survey respondents select to opt out of being tested for HIV or refuse to participate in the survey, the population included in surveillance will change. Current ANC methods use anonymous HIV testing, avoiding the option for women to opt out of HIV testing. If ANC surveillance was replaced by surveillance using PMTCT data, the proportion of women opting out might change and the population included in the surveillance may be different. In addition, the HIV testing strategy for surveillance might be different than that for diagnosis in some countries, thus providing different results. If the response and refusal rates of household surveys change over time and vary by the HIV status of the respondent, HIV prevalence estimates could be biased.21 Refusals among HIV-positive respondents might increase, for example, if respondents know their HIV status before the survey and thus refuse to be tested to reduce the time required for their participation in the survey. If refusal rates rise among HIV-positive individuals, the proxy measure of HIV incidence trends may overestimate a decline in incidence.
The comparisons in this analysis might be limited by variations in the testing strategies used in the population survey and ANC surveillance testing algorithms. However, as extensive quality assurance testing is an integral component of both activities, we assume that those variations are small enough not to affect our results.
Another option for estimating a point estimate or incidence trends is by comparing age cohort data between two or more household surveys.33 This method provides a measure of incidence during the inter-survey period. Calculating trends in incidence with this method will require data from at least four repeated surveys to estimate change over time. Currently no countries have more than three comparable surveys with published results.
Among the countries reviewed here, apart from Uganda, there was evidence of declining HIV incidence between 2000 and 2011 using three different proxy measures. The three methods all showed trends in similar directions among women, although there were variations in the magnitude of the changes by method. Future efforts to triangulate trends in incidence should incorporate additional measures of incidence including direct biological measures of incidence and cohort measures from four or more nationally representative household surveys.
Key messages
-
Proxy measures of HIV incidence confirm declining trends in 25 of 26 generalised epidemic countries.
-
Direct measures and alternative proxy measures are needed to better understand the magnitude of changes in HIV incidence.
-
Current proxy measures of HIV incidence could become increasingly biased as more people access antiretroviral therapy.
Acknowledgments
We appreciate the contributions of country teams who have developed and submitted national estimates and projections files and information on antenatal clinic sentinel surveillance among women aged 15–24 years to UNAIDS.
References
Footnotes
-
Contributions MM drafted the manuscript and conducted the analysis. KAM and JMGC contributed to the study design and revisions of the manuscript.
-
Funding None.
-
Competing interests None.
-
Provenance and peer review Commissioned; externally peer reviewed.
Open Access This is an Open Access article distributed in accordance with the Creative Commons Attribution Non Commercial (CC BY-NC 3.0) license, which permits others to distribute, remix, adapt, build upon this work non-commercially, and license their derivative works on different terms, provided the original work is properly cited and the use is non-commercial. See: http://creativecommons.org/licenses/by-nc/3.0/