Article Text

Abstract
Background A retrospective analysis of deaths registered in the Brazilian Mortality System was conducted to quantify the under-reporting of HIV/AIDS deaths and those misclassified to AIDS-related conditions in the 15–49 years old population in Brazil.
Methods Death rates for AIDS-related diseases were calculated by age and sex for 1985–2009. Changes in the age-sex-specific death rates over time were used to identify conditions likely to be misclassified AIDS deaths and to quantify the corresponding number of misclassified deaths. Deaths due to ill-defined causes were redistributed across all other natural causes of death. The resulting total number of AIDS deaths was further adjusted for incompleteness of the mortality reporting system.
Results Out of the 28 potential causes of death investigated, five increased in the same distinct age pattern as AIDS: pneumonia, Kaposi's sarcoma, other immunodeficiencies, other septicaemia and toxoplasmosis. 18 490 deaths due to these five causes were recoded to HIV/AIDS from 1985 to 2009. 38 145 deaths due to ill-defined causes were redistributed to AIDS and 15 485 were added to the number of AIDS deaths to correct for completeness of the mortality system in Brazil. Altogether, 72 120 deaths were recoded to AIDS between 1985 and 2009 and added to the reported 194 445 AIDS related deaths in the country, representing 27% misclassification of AIDS deaths in Brazil.
Conclusions This study demonstrated that AIDS mortality is underestimated by the official mortality information system in Brazil. Efforts need to be made to reduce misclassification of causes of death in the future and identify ways in which the confidentiality of information regarding cause of death can be maintained.
- AIDS
- Epidemiology (General)
- HIV
This is an open-access article distributed under the terms of the Creative Commons Attribution Non-commercial License, which permits use, distribution, and reproduction in any medium, provided the original work is properly cited, the use is non commercial and is otherwise in compliance with the license. See: http://creativecommons.org/licenses/by-nc/3.0/ and http://creativecommons.org/licenses/by-nc/3.0/legalcode
Statistics from Altmetric.com
Introduction
The Joint United Nations Programme on HIV/AIDS (UNAIDS) assists countries in producing HIV estimates and analysing the levels and trends of the epidemic and its demographic impact using the Estimation and Projection Package (EPP) and Spectrum software. The models and assumptions used are based on recommendations of the UNAIDS Reference Group on Estimates, Modelling and Projections and incorporate the latest research findings on the epidemiology of HIV. The EPP and Spectrum software tools have been described in detail elsewhere.1 ,2 Spectrum provides estimates on several indicators related to HIV/AIDS, among them the number of AIDS deaths, the number of people living with HIV/AIDS, treatment coverage and the number of new HIV infections.
In countries with concentrated epidemics like Brazil, a disparity has been observed between the estimated AIDS mortality produced by the model and the AIDS mortality reported by the countries. For these countries the model produces an estimated number of deaths from AIDS which is higher when compared to the reported figures. A possible explanation is that the model overestimates AIDS mortality. On the other hand, the fact that the Mortality Information System may not cover the entire population and that AIDS deaths might have been certified and coded as other diseases could lead to an underestimation of AIDS mortality statistics.
The purpose of this study is to discover the causes that may be sources of misclassification of AIDS deaths and to quantify the misclassified and under-reported AIDS deaths in the 15–49-year-old population in Brazil from 1985 to 2009, comparing the results with the estimates yelled by the EPP and Spectrum software tools and with the number of AIDS deaths reported by Brazil
Methods
The study is a retrospective analysis of deaths reported in the Brazilian Mortality System.
Data
The Department of sexually transmitted diseases (STD), AIDS and Viral Hepatitis of Brazil (D-DST/AIDS) reports and monitors the trends of AIDS mortality by the number of deaths reported in the Mortality Information System (Sistema de Informações sobre Mortalidade—SIM) that have HIV/AIDS as the underlying cause of death, coded as B20 to B24 in the International Statistical Classification of Diseases and Related Health Problems—tenth revision (ICD-103). Information on death certificates issued in Brazil is entered in datasets without personal identifiers and is available online at http://tabnet.datasus.gov.br/tabdata/sim/dados/cid10_indice.htm.
To select the proper underlying cause of death, the Brazilian Ministry of Health has adopted the ICD-10 coding rules. It is not the authors’ intention to describe these rules due to their complexity, but the reader can find them, if needed, on the second volume of the ICD-10.4 In order to put these rules into operation, an automated coding system, named Primary Causes Selection System (Seletor de Causas Básicas—SCB-10) was implemented in Brazil. It interprets the codes of the diagnoses contained on the death certificates and automatically selects the underlying cause of death.5
For a death to be coded as HIV/AIDS there must be mention to HIV/AIDS in the death certificate and, if more than one cause of death is listed, there must be a causal relation between the causes listed and the underlying cause of death. Hence, the absence of mention to HIV/AIDS on the death certificate could lead to misclassification of AIDS deaths.
There are a number of factors that could explain the absence of HIV/AIDS on these death certificates: (1) the HIV status of the patient may be unknown and the immediate cause of death may be reported; (2) there is a strong social stigma attached to HIV/AIDS and patients may be reluctant to reveal their HIV status and request their doctors not to do so; and, (3) doctors’ concerns about the maintenance of confidentiality of cause-of-death details on the death certificate .
Also, according to the ICD-10 underlying cause of death selection rules, a death may also be considered as HIV/AIDS if there is mention to HIV/AIDS in any line of the death certificate and there is also mention to a condition that should be considered a direct consequence of HIV/AIDS. The conditions that are assumed to be direct consequences of HIV/AIDS are: Kaposi's sarcoma, Burkitt's tumour, and any other malignant neoplasm of lymphoid, haematopoietic and related tissue, classifiable to C46 or C81–96; and any infectious diseases classifiable to A00–B19, B25–B49, B58–B64, B99 or J12–J18. This list was elaborated in 1993, before antiretroviral therapy had become available. Since in more recent years people living with HIV/AIDS who are on antiretroviral therapy are presenting excess mortality when compared to the general population from causes that were not in the initial list,6 ,7 there may be additional misclassified AIDS related deaths that are not being captured by the initial list of AIDS related causes.
Finally, the coverage of the Mortality Information System has to be taken into account. Not all deaths that occur in Brazil are reported. The Brazilian Ministry of Health calculates that in 2007, 89.7% of deaths in Brazil were registered in the system.8 Figure 1 illustrates the reasons for underestimation of AIDS deaths.

Reasons for underestimation of AIDS deaths by the countries’ official mortality system.
In this paper the term ‘misclassified’ refers to deaths which in reality were due to AIDS but which were not reported as such in the death certificates by the certifiers. ‘Under-reported’ refers to those deaths which were not declared or registered in the civil registries.
Individual mortality records of all deaths which occurred from 1985 to 2009 in Brazil with information on age, year of death, gender and underlying cause of death were analysed. To calculate the death rate per specific causes of death, the population information by year, age and gender estimated by The Brazilian Institute of Geography and Statistics based on census and on population projections was used as denominator.
Analysis
The methodology used in this study is based on the use of common descriptive statistics rather than inferential statistics to detect misclassification and under-reporting of AIDS deaths. It is easily replicable and could help producers of statistics at country level to improve their mortality information. The method is presented in steps and the formulas used are shown in each step to facilitate replication of the method.
Step 1: analyse AIDS death rates by sex, age and year
AIDS (ICD-9: 279.5 and 279.6; and ICD-10 codes: B20 to B24) death rates by age group and sex were calculated and graphed over time to allow their trends to be analysed and to check if 1985 could be selected as the year pre-AIDS-epidemic to serve as reference to calculate excess mortality. The AIDS death rates (DRAIDS) were calculated by dividing the number of deaths due to AIDS (NAIDS a,s,y) for each age group (a), sex (s) and year of death (y) by the population size for the same age group, sex and year (Pa,s,y) (Formula 1). 1
1
Step 2: calculate death rates for causes most likely to contain AIDS deaths
To verify which causes of death may hide HIV/AIDS deaths, the death rate was calculated by disease (d), age group, sex and year of death (DRd,a,s,y) (Formula 2). The death records with no information on age were redistributed proportionally to all the other age groups for the same year of death and gender. The causes that were investigated were the diseases that indicate HIV/AIDS according to the Centers for Disease Control and Prevention (CDC) classification9 and the causes of death that were shown to hide AIDS deaths in another study10 (table 1). 2
2
Diseases to be investigated as possible sources of AIDS deaths misclassifications, and their ICD codes
Step 3: graph death rates of the causes to be investigated over time
The death rates due to diseases described on table 1 were graphed over time so that their trends could be assessed. If trends similar to HIV/AIDS were found in the graphs the disease was considered a source of misattributed AIDS deaths. This criterion was applied to determine a set of ‘source’ causes from which deaths would be taken and allocated to HIV/AIDS.
When analysing the mortality trends, one important issue must be observed: the ICD revision used over the period analysed. In Brazil, causes of death were coded by ICD-9 rules from 1985 to 1995 and by ICD-10 from 1996 onwards. Since the ICD-10 is more detailed, some diseases that were coded specifically in ICD-10 did not have a unique code in ICD-9, for example, Kaposi's sarcoma. For that reason, when it was not possible to compare the ICD revision 9 and 10 codes, the analysis was performed in two separate time periods: 1985–1995 and 1996–2009.
Step 4: calculate excess mortality from causes likely to contain misclassified AIDS deaths
The excess mortality was calculated for those causes that were found to be AIDS deaths sources in step 3. For the 1985–1995 period, when ICD-9 codes were used, the number of expected deaths (Exp) due to that specific cause was calculated by applying the death rate of 1985, the year considered pre-AIDS-epidemic, by sex and age group to the population of each year by sex and age group (Formula 3). For the second period, from 1996 to 2009, when ICD-10 was used to code the causes of death, the death rate of 2009 was used to calculate excess mortality, as this was the year considered to have the best quality data and the lowest number of miscodifications (Formula 4). Next, the expected number of deaths per age and sex group was subtracted from the observed number of deaths (Obs), resulting in the excess number of deaths (Exc) which were recoded to AIDS (Formula 5). 3
3 4
4 5
5
Step 5: redistribute deaths due to ill-defined causes
Deaths due to ill-defined causes were distributed proportionally to the other natural causes, including AIDS. To do so, first the number of deaths due to natural causes (NNat) was tabulated by age, sex and year. The expected proportion of AIDS deaths (PropAIDS) in the total number of deaths by natural causes was calculated by age, sex and year (Formula 6). Then, the proportion of AIDS deaths (PropAIDS) was applied to the total number of deaths due to ill-defined causes (Nill-def) to calculate the expected number of AIDS deaths that were coded as ill-defined causes (ExpAIDS-Ill-def) (Formula 7). 6
6 7
7
Step 6: adjust for level of completeness
The last step was to adjust the results according to the level of incompleteness of the mortality system (Incomp). This level was estimated by dividing the overall death rate calculated using the Brazilian mortality data (ObsDR) by the WHO overall estimated death rate (EstDR) for Brazil by age group, sex and year,11 and subtracting the result from 1 (Formula 8). Finally, to achieve the total number of AIDS deaths by age, sex and year (TAIDS,a,s,y), the number of AIDS deaths obtained in steps 4 and 5 (NAIDS,4-5,a,s,y) was scaled-up by the proportion of incompleteness (Formula 9). The final number of AIDS deaths per year (FAIDS,y) was calculated by the sum of the total number of AIDS deaths calculated for all age groups and both genders, per year (Formula 10). 8
8 9
9 10
10
The estimates derived from this study were graphed and compared with the official Brazilian statistics and to the estimates resulted from EPP/Spectrum.
The tabulation of the number of deaths and of death rates by sex, age and year, the construction of line graphs for the analysis of trends, and the quantification of misclassified and under-reported AIDS deaths were performed in Excel spreadsheets. The calculation of the 95% Poisson CIs was done in SPSS 13.
Results
The analysis of the AIDS death rates by age group and year showed that 1985 could be considered a pre-AIDS-epidemic year, since it shows rates close to zero for both genders. The graphs also depict the AIDS mortality trends by age group and sex in Brazil showing that after 1985 death rates started to rise, reaching their peak in 1995. After that, death rates decrease and the curves move to the right reflecting the increase of age at the moment of death with time (figure 2).

Death rate due to AIDS (per 100 000 inhab.) by age, sex and year. Brazil 1985–1995.
Five specific causes demonstrated the same age pattern distribution over the years as AIDS and were considered to be sources of AIDS deaths misclassification in Brazil: toxoplasmosis, Kaposi's sarcoma, other immunodeficiencies, other septicaemia and pneumonia.
The Kaposi's sarcoma death rate distribution shows two different patterns of curves. One formed from 1985 to 1995 when ICD-9 was used and another formed from 1996 and on, when ICD-10 was in operation. The malignant skin melanomas death rate (figure 3) shows peaks in 1995 when compared to 1985 for some age groups. Since the overall mortality decreased from 1985 to 1995 and AIDS mortality increased in the same period, it is logical to think that AIDS deaths were coded as Kaposi's. Figure 4 shows that Kaposi's death rate reaches high figures for some age groups in 1996, when AIDS mortality was high in Brazil and after that, similar to AIDS, it decreases. Since it is not possible to compare across periods with different versions of ICD, the death rate from 2009, the year considered to have the best quality data, was applied to the population from 1996 to 2009 to calculate excess mortality.
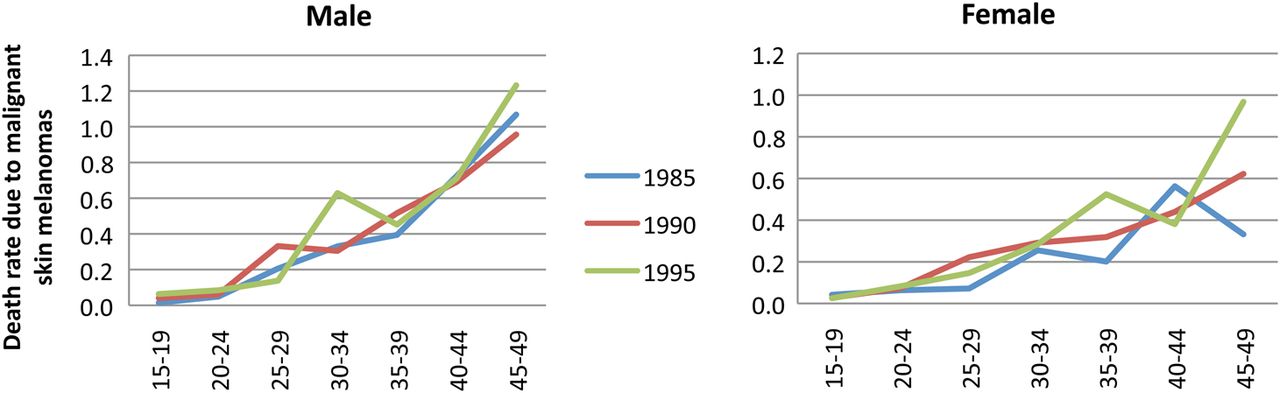
Death rate due to malignant skin melanomas (per 100 000 inhab.) by age, sex and year. Brazil 1985–1995.

Death rate due to Kaposi's sarcoma (per 100 000 inhab.) by age, sex and year. Brazil 1996–2009.

Death rate due to other immunodeficiencies (per 100 000 inhab.) by age, sex and year. Brazil 1985–1995.
The analysis of other immunodeficiencies was also done by the ICD version. In 1990 and 1995 there are peaks of high death rate when compared to 1985 for some age groups (figure 5). The 1985 death rate was used to calculate excess mortality for this first period. Figure 6 shows that for the year 1996, when AIDS mortality was still high, the death rate for other immunodeficiencies is lower for most age groups when compared to subsequent years, meaning that in the second period other immunodeficiencies were not a source of AIDS deaths misclassifications. Therefore, the excess mortality for other immunodeficiencies was calculated only for the first period.

Death rate due to other immunodeficiencies (per 100 000 inhab.) by age, sex and year. Brazil 1996–2009.
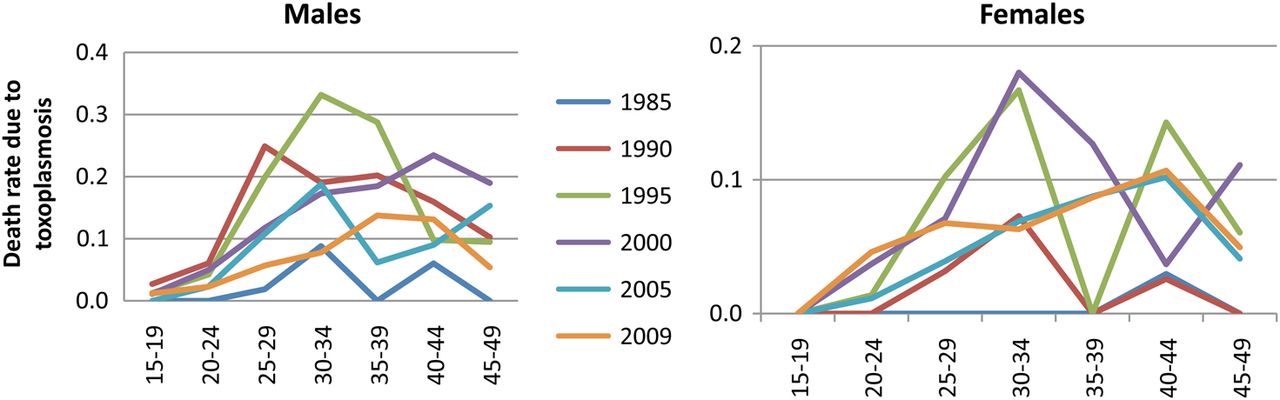
Death rate due to toxoplasmosis (per 100 000 inhab.) by age, sex and year. Brazil 1985–2009.
It is observed in figure 7 that mortality due to toxoplasmosis increased considerably with increasing mortality from AIDS, and after 1995 decreased and moved to the right showing a similar pattern to AIDS. The coefficient for 1985 was applied to the population from 1985 to 2009 to calculate excess mortality.

Death rate due to pneumonia (per 100 000 inhab.) by age, sex and year. Brazil 1985–1995.
All pneumonias should be considered as consequences of conditions that damage the immune system such as AIDS, malignant neoplasms, malnutrition and diseases causing paralysis, such as cerebral haemorrhage and thrombosis.4 However, in Brazil from 1985 to 2009 there were 882 881 deaths with pneumonia as the underlying cause of death. Chart analysis was done by ICD version because there is no direct relation between ICD-9 and ICD-10 codes for pneumonia. It was observed in figure 8 that the death rate for pneumonia in 1995 was higher than previous years. The death rate for 1985 was applied to the population from 1986 to 1995 to calculate excess mortality. In figure 9 one can see that the death rates for 1996 are higher than those of other years except 2009, when there was an epidemic of H1N1 influenza and many deaths due to this flu were coded as pneumonia. Thus, the 2008 death rate was applied to population from 1996 to 2008 to calculate excess mortality.
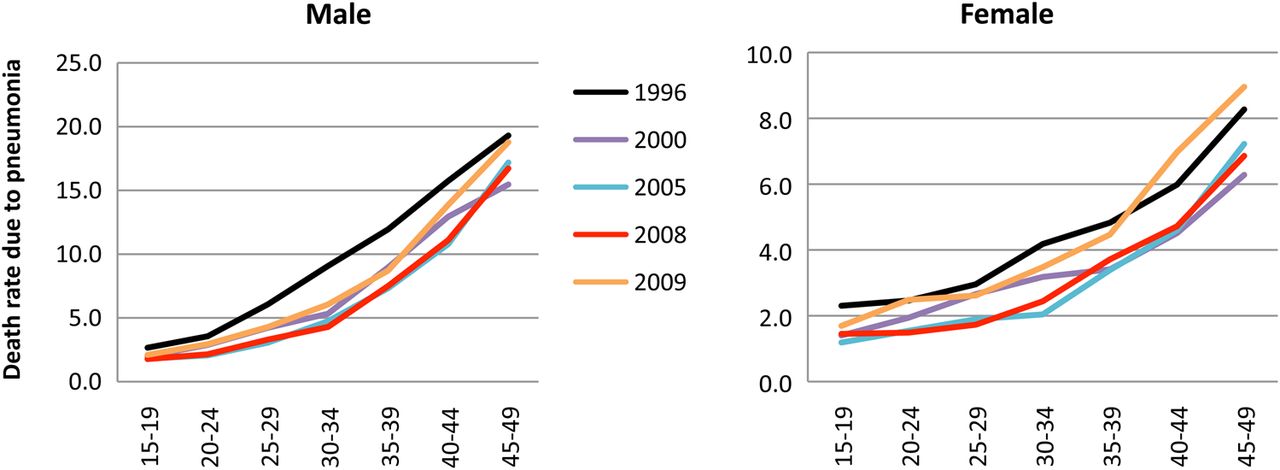
Death rate due to pneumonia (per 100 000 inhab.) by age, sex and year. Brazil 1996–2009.
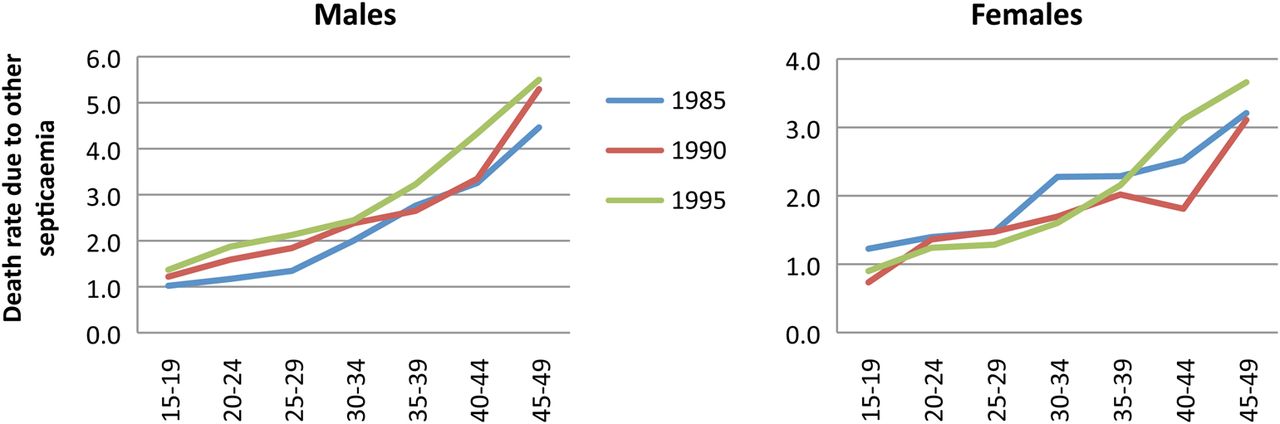
Death rate due to other septicaemias (per 100 000 inhab.) by age, sex and year. Brazil 1985–1995.
It is observed in figure 10 that the death rate from other septicaemia in 1995 is higher than that for the previous years for all age groups in men and for women over 35 years. The death rate for 1985 was applied to the population from 1986 to 1995 to calculate excess mortality. Figure 11 shows that the death rates for 1996 are higher than other years in the age groups most affected by AIDS and then decrease, similar to AIDS. The 2009 death rate was applied to the population from 1996 to 2009 to calculate excess mortality.

Death rate due to other septicaemias (per 100 000 inhab.) by age, sex and year. Brazil, 1996–2009.
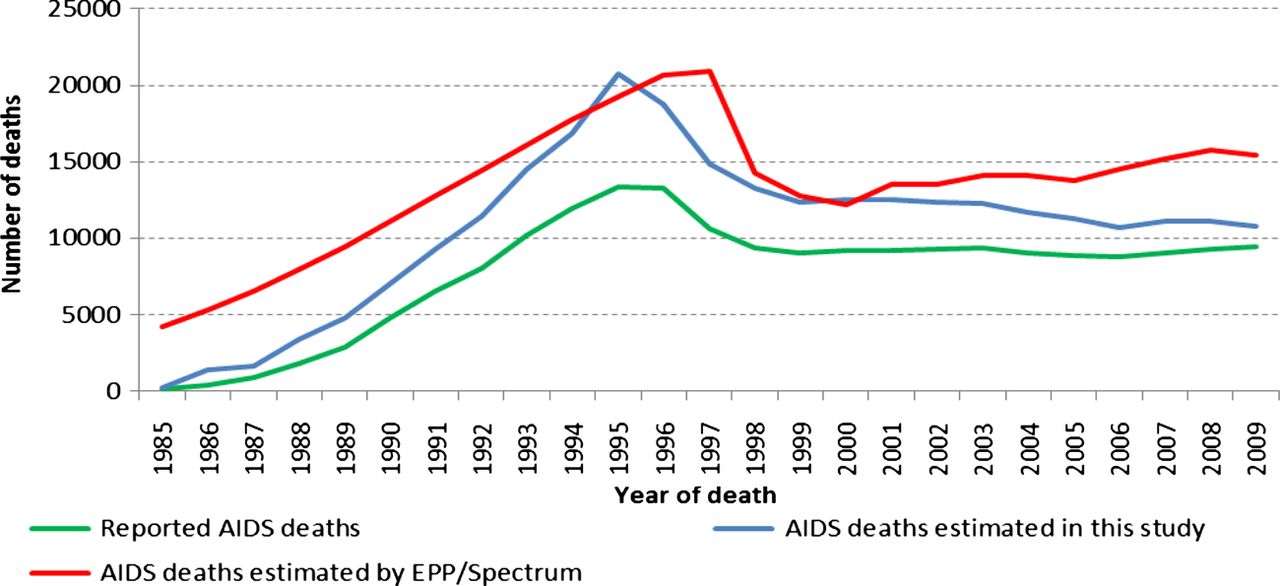
Number of reported AIDS deaths, number of AIDS deaths estimated by this study and number of AIDS deaths estimated by EPP/Spectrum for the 15–49 years old Brazilian population, 1985–2009.
520 deaths due to Kaposi's sarcoma, 8090 deaths due to pneumonias, 198 deaths due to other immunodeficiencies, 8479 deaths due to other septicaemia and 1203 deaths due to toxoplasmosis were recoded to HIV/AIDS from 1985 to 2009, comprising a total of 18 490 AIDS deaths misclassified as other diseases (table 2). 38 145 deaths due to ill-defined causes were redistributed to AIDS and 15 485 were added to the number of AIDS deaths to correct for completeness of the mortality system in Brazil. Altogether, 72 120 deaths were recoded to AIDS between 1985 and 2009, representing 27% of all AIDS deaths. The number of AIDS deaths before and after recoding is shown in table 2.
AIDS deaths, excess mortality, adjustments for ill-defined diseases and completeness, AIDS deaths after recoding and per cent of AIDS deaths misclassified/under-reported in the 15 to 49-year-old Brazilian population, 1985–2009
Figure 12 compares the number of AIDS deaths reported to the Brazilian Mortality Information System with the number estimated by EPP/Spectrum and the number estimated by the present study. The results point to an underestimation of AIDS deaths by the Brazilian Mortality Information System and an overestimation of AIDS deaths by EPP/Spectrum.
Discussion
This is, to our knowledge, the first study that has aimed to identify and quantify AIDS deaths misclassification and under-report at a National level in Brazil. Other authors have estimated the extent of AIDS death misclassifications in the state of Rio de Janeiro by linking data of patients from two HIV/AIDS cohorts with data from the Mortality Information System in Rio de Janeiro.7 Their methodology is, unfortunately, impossible to apply at a National level. However, the method presented in this study has been demonstrated to be a simple and easy replicable way for countries to assess misclassification and under-report of AIDS deaths and yielded similar results to the study conducted in Rio de Janeiro (23% of misclassification in our study for 2000–2006 and 25% in the study conducted in Rio de Janeiro for the same period).
This study identified five HIV/AIDS related causes of death that are sources of HIV/AIDS deaths misclassification. Other septicaemias and pneumonias accounted for the majority of the excess deaths attributed to AIDS. Ideally, these cases should have had HIV/AIDS mentioned in their death certificate to ensure coding of these deaths to HIV/AIDS.
One of the five causes, other immunodeficiencies, presented a different pattern when compared to the others considered sources of AIDS deaths misclassification. It demonstrated a pattern similar to AIDS in the first period analysed (1985–1995), but a pattern different from AIDS in the second one (1996–2009), suggesting that other immunodeficiencies were only a source of HIV/AIDS deaths misclassification in the first period. One explanation is that in the beginning of the first period, when ICD-9 was used, there was no official code for HIV/AIDS. At that time HIV/AIDS was considered to be a disorder involving other immune mechanisms and it is likely that HIV/AIDS deaths were coded as other immunodeficiencies. In the second period, when ICD-10 was enforced, there was a specific code for HIV/AIDS and clearer instructions for HIV/AIDS coding; also, the fact that HIV/AIDS was moved from the chapter of ‘endocrine, nutritional and metabolic diseases and immune disorders’ in ICD-9 to the ‘infectious and parasitic diseases’ chapter in ICD-10 could have contributed to reduce the misclassification of HIV/AIDS deaths as other immunodeficiencies from 1996 to 2009.
Some causes that are considered to be HIV/AIDS related could not be investigated due to the small number of deaths. This is the case for coccidioidomicosis, cryptococcosis, cryptosporidiosis, cytomegaloviral disease, herpes simples, histoplasmosis, isosporiasis, pneumocystosis, progressive multifocal leukoencephalopathy, salmonella septicaemia, herpes zoster, purpura and other haemorrhagic conditions and lymphoadenopathy. They were considered the underlying cause of death in 0.08% of the deaths in the 15–49-year-old population from 1985 to 2009. If all deaths due to these causes were to be considered AIDS deaths, an extreme assumption, an increase of 1% in misclassification would apply for each year.
Tuberculosis, which is likely to be a source of AIDS deaths misclassification could not be analysed because its death rate decreased during the period analysed. Because our methodology depends on the identification of an excess of cause-specific deaths compared to the pre-AIDS period, it was not possible to assess misclassification of AIDS deaths as tuberculosis. The fact that tuberculosis deaths could not be accounted for may have led to an underestimation of the true number of AIDS deaths.
Of all deaths recoded to HIV/AIDS, 53% were due to ill-defined diseases. This result is higher than that found by the study carried out in Rio de Janeiro, Brazil by Pacheco et al.7 They documented that 25% of deaths among people living with HIV did not have HIV/AIDS codes listed in their death certificate, and 26% of those deaths were coded as ill-defined causes. One reason that could explain the difference between the figures is that in this study we considered the chances of an AIDS death to be coded as ill-defined to be equal to the chances of any other natural death to be coded as ill-defined, and we redistributed ill-defined deaths proportionally among all natural causes of death. The same rationale was applied to address completeness of reporting. We considered completeness among AIDS deaths to be the same as among other causes of deaths. But, since 86% of reported AIDS deaths occur in hospitals compared with 40% of all the other natural deaths (non published data), it is possible that completeness of reporting is higher for AIDS deaths compared to other natural causes of death.
The results revealed a decrease over time in the proportion of AIDS deaths which were misclassified. Several factors may have accounted for this decrease. (1) The introduction of the highly active antiretroviral therapy (HAART) treatment in 1996 which decreased the number of AIDS deaths, hence there were fewer deaths to be misclassified; (2) the shift from ICD-9 to ICD-10 version resulted in a smaller number of deaths being classified as ill-defined (from 18.2% in 1990 to 7.2% in 2009)8 which would have hidden some AIDS deaths; (3) completeness has increased gradually over time (from 87% in 1990 to 99% in 2009 for males; and from 80% to 95% for females in the same period), contributing less to the misclassification of AIDS deaths. In summary, from 1985 to 2009 all these improvements have substantially contributed to lowering the number of misclassified AIDS deaths.
Nevertheless, there is one limitation of the study that could also lead to a decrease in the proportion of misclassified AIDS deaths over time: the fact that diseases not traditionally related to HIV/AIDS were not accounted for. Since people living with HIV are increasingly dying of causes not traditionally considered to be direct consequences of HIV/AIDS6 ,12–16 it is likely that the number of deaths due to AIDS in this study was underestimated for the most recent years.
Unlike the study of South African data which revealed that up to 94% of all AIDS deaths were misclassified and identified in a broad range of causes from intestinal infections and meningitis to nephritis, cancer and cardiovascular diseases, amongst others,10 this study showed clearly that in Brazil the source causes of misclassified deaths were restricted solely to the causes which are well-documented AIDS-defining conditions, leaving other cause-of-death patterns undistorted.
In conclusion, this study has shown that AIDS mortality is underestimated by the official mortality information system in Brazil. Efforts need to be made to reduce misclassification of causes of death in the future and identify ways in which the confidentiality of information regarding cause of death can be maintained.
Key messages
-
The findings have shown that AIDS mortality is underestimated by the official mortality information system in Brazil.
-
This study identified five HIV/AIDS related causes of death that are sources of HIV/AIDS deaths misclassification: pneumonia, Kaposi's sarcoma, other immunodeficiencies, other septicaemia and pneumonia.
-
Altogether, 72 210 deaths were recoded to AIDS between 1985 and 2009, representing 27% of misclassification of AIDS deaths in Brazil.
-
Efforts need to be made to reduce misclassification of causes of death in the future.
References
Footnotes
-
Contributors All authors contributed to the conception and design of the study, to the interpretation of data, to the review of the paper for important intellectual content, and to final approval of the version to be published. EF, PC and DMF were also responsible for the acquisition of data.
-
Competing interests None.
-
Ethics approval Ethics committee from the Universidade de Brasília.
-
Provenance and peer review Commissioned; externally peer reviewed.
Open Access This is an Open Access article distributed in accordance with the Creative Commons Attribution Non Commercial (CC BY-NC 3.0) license, which permits others to distribute, remix, adapt, build upon this work non-commercially, and license their derivative works on different terms, provided the original work is properly cited and the use is non-commercial. See: http://creativecommons.org/licenses/by-nc/3.0/