Article Text

Abstract
Objectives To produce valid seroincidence estimates, the serological testing algorithm for recent HIV seroconversion (STARHS) assumes independence between infection and testing, which may be absent in clinical data. STARHS estimates are generally greater than cohort-based estimates of incidence from observable person-time and diagnosis dates. The authors constructed a series of partial stochastic models to examine whether testing motivated by suspicion of infection could bias STARHS.
Methods One thousand Monte Carlo simulations of 10 000 men who have sex with men were generated using parameters for HIV incidence and testing frequency from data from a clinical testing population in Seattle. In one set of simulations, infection and testing dates were independent. In another set, some intertest intervals were abbreviated to reflect the distribution of intervals between suspected HIV exposure and testing in a group of Seattle men who have sex with men recently diagnosed as having HIV. Both estimation methods were applied to the simulated datasets. Both cohort-based and STARHS incidence estimates were calculated using the simulated data and compared with previously calculated, empirical cohort-based and STARHS seroincidence estimates from the clinical testing population.
Results Under simulated independence between infection and testing, cohort-based and STARHS incidence estimates resembled cohort estimates from the clinical dataset. Under simulated motivated testing, cohort-based estimates remained unchanged, but STARHS estimates were inflated similar to empirical STARHS estimates. Varying motivation parameters appreciably affected STARHS incidence estimates, but not cohort-based estimates.
Conclusions Cohort-based incidence estimates are robust against dependence between testing and acquisition of infection, whereas STARHS incidence estimates are not.
- STARHS
- HIV incidence
- clinical populations
- recency of infection
- bias
- HIV testing
- seroepidemiology
- sexual behaviour
Statistics from Altmetric.com
- STARHS
- HIV incidence
- clinical populations
- recency of infection
- bias
- HIV testing
- seroepidemiology
- sexual behaviour
Introduction
The serological testing algorithm for recent HIV seroconversion (STARHS) was designed to permit estimation of HIV seroincidence using a single blood specimen from each tester.1 Specimens reactive to the enzyme-linked immunosorbant assay (ELISA), and confirmed by Western Blot (WB), are retested using an assay that reacts to a greater level of antibody produced some average number of days following production of antibodies detectable by ELISA. For less-sensitive ELISA (LS-EIA), that mean number of days is estimated at 129 days; the proportion of specimens reactive by ELISA and non-reactive by LS-EIA is taken to reflect the proportion of testers who acquired HIV during a 129-day period, and used to calculate annual seroincidence. Prior to STARHS, HIV seroincidence in clinical populations could be calculated among cohorts of initially ELISA-negative, repeat testers, using seroconversion events and person-time during the period of observation. While valid, cohort incidence estimates are of limited generalisability due to selection bias the limitation STARHS was designed to overcome. Using simulation, Song and Karon have shown that estimates from STARHS and cohort methods will be similar when testing is independent of acquisition of HIV.2 However, comparison of cohort and STARHS estimates of seroincidence using specimens and data from the same clinical testing population (see page 254) shows STARHS estimates to be biased upward.3 Seroincidence was estimated using STARHS and cohort methods for men who have sex with men (MSM) who tested for HIV at Public Health—Seattle & King County (PHSKC). All initially tested negative for HIV antibody and were subsequently retested. STARHS seroincidence estimates were greater than cohort estimates by a factor of 1.5.
In populations who choose the time of their HIV tests, independence between dates of HIV infection and HIV testing cannot be assumed. Some proportion of MSM who have taken risks for HIV acquisition (unprotected anal intercourse, sexual contact with a seropositive) experience symptoms of primary HIV infection or experience symptoms of (or are notified of contact to) another sexually transmitted disease (STI) may test for HIV soon after. Such motivated testing will increase the proportion of ELISA/WB-positive testers who test LS-EIA non-reactive, and the proportion of LS-EIA non-reactive results among all testers, biasing STARHS seroincidence estimates upward.4
To examine whether motivated testing may exert bias on STARHS estimates, hypothetical populations of MSM with a moderate incidence of HIV infection, and testing for HIV over a 5-year period, were simulated using partial stochastic modelling. A series of models was created in which testing was not motivated by potential HIV exposure, and dates of potential HIV exposure and testing were independent. Data were simulated using parameter values taken from the dataset of Seattle MSM for which STARHS and cohort incidence estimates were obtained.3 Another series of models was created in which some testers perceived that they may have been exposed to HIV and whose testing was motivated by those potential exposures; thus, dates of potential exposure and testing dates were dependent. Parameter values for simulations under which some testing was motivated were derived from interview data from Seattle MSM recently diagnosed as having HIV infection, some of whom suspected HIV exposure prior to testing. Seroincidence estimates were calculated from simulated data using both the STARHS and cohort methods used in the original analysis. Motivation parameters were varied to assess whether STARHS and cohort incidence estimates are robust against differing degrees of motivation.
Methods
Data sources for parameter values in all models
The frequency with which simulated MSM tested was obtained from the distribution of observed intervals between next-to-most-recent and most recent HIV tests of MSM at PHSKC sites. The intertest intervals for those men had an inverse γ, a mean value of 582.0 days and an SD of 509.3 days. This distribution was termed parameter d. Simulated individuals were randomly assigned a test date from the distribution of d.
The frequency with which testers seroconverted was obtained from the cohort incidence estimate for initially ELISA-negative MSM testing at PHSKC during 1996–2000, which was 1.4 new infections per 100 person-years. Based on the observed incidence among MSM in the PHSKC dataset, the mean time to seroconversion was parameterised at a mean 83.3 years, with a uniform distribution. All simulated individuals were assigned seroconversion dates following their most recent negative test, randomly drawn from that distribution.
Construction of model of unmotivated testing
A simulation of 10 000 individuals was created in which dates of acquisition of infection were independent from dates of testing. The initial time was set at their most recent HIV test. The time to test was reparameterised slightly from empirical data for a better fit, resulting in a mean of 650.0 days and an SD of 398.0 days. If an individual's seroconversion date preceded his next test date, his result was ELISA/WB-positive. For all individuals' ELISA/WB-positive results, an LS-EIA result was simulated. If the seroconversion date preceded the test date by ≤129 days, the LS-EIA result was non-reactive; otherwise it was reactive. One thousand Monte Carlo simulations were performed, generating HIV incidence estimates using STARHS and the cohort method. These estimates were compared with seroincidence estimates from the PHSKC dataset.
Data sources for parameter values in models under which testing was motivated
Parameters for motivated testing were taken from participants in the Seattle Area MSM study (SAMS), MSM recently diagnosed as having HIV infection who had recently acquired HIV; this study is described in detail elsewhere.5 Participants were asked about their three most recent male anal sex partners and, in the case of individuals testing ELISA/WB-positive, whether they believed they knew which partner was the source of their infection. Dates of first sexual contact with that partner and last unprotected sexual contact were collected. If a participant believed some other partner to be the source of his infection, he was asked for those dates for that partner. Distributions of both duration of partnership and interval between last sexual contact and testing took on γ distributions. In SAMS, 24 of 77 seropositive men (31%) felt that they knew which of their previous or current partners had transmitted HIV to them. Of these, seven had sex with that partner only once, 10 were in a sexual partnership with that partner at the time of HIV diagnosis, and seven had sex with the partner multiple times but were no longer having sex with the partner when diagnosed. Given the low per-act transmissibility of HIV, all testers were assigned a date of a potential exposures that would prompt them to test. Therefore, the time between most recent ELISA-negative result and a potential exposure took on a uniform distribution with a mean of 5.0 years, under which 31% of testers would have such an event within the mean intertest interval of 650.0 days. For seroconverters, the date of infection was used as their potential exposure, taken from their predicted seroconversion date.
Construction of model of motivated testing
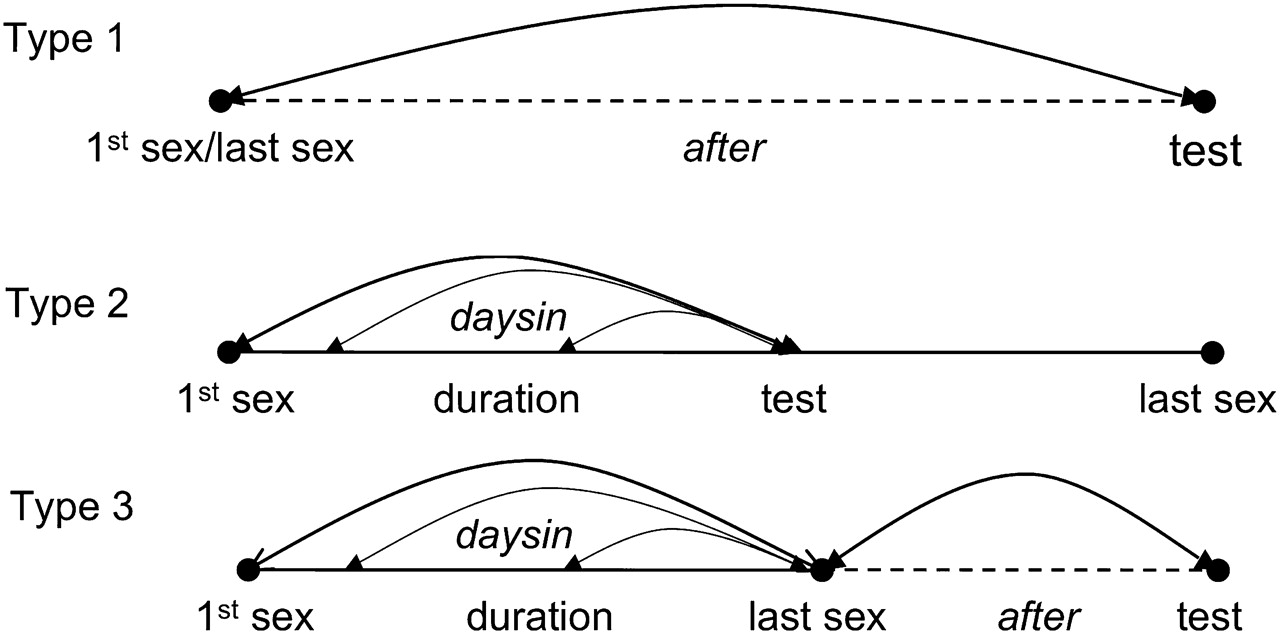
A simulation incorporated testing motivated by perception of potential exposure. Dates of testing were informed by date of potential exposure or, in the case of ELISA/WB-positive testers, infection. Two waiting times were developed from the SAMS data from the three types of partnerships ELISA/WB-positive testers suspected to be the source of their infection (figure 1).

Creation of parameter values from empirical data for two types of waiting times for three categories of motivated testers.
Type 1 partnerships were those in which testing followed a single encounter with the partner. Type 1 partnerships required assignment of one category of waiting time, taken from the distribution of after, the interval between last sex with the suspected source partner and HIV testing. The empirical value for after had a mean of 415.9 days and an SD of 451.2 days, slightly reparameterised to better depict the γ distribution with a mean of 450.0 days and SD of 425.0 days. As 7/77 of ELISA/WB-positive testers were Type 1 testers, the test date followed infection/potential exposure by after for 9.1%.
Type 2 partnerships were characterised by testing, while the suspected source partnership was ongoing. Type 2 partnerships required a single category of waiting time. This was taken from the uniform duration, the number of days between first sexual encounter with the partner and last unprotected sex prior to testing (date of first unprotected sex was unavailable). The empirical value for this waiting time had a mean of 123.1 days and an SD of 176.2 days; the SD was reparameterised to better depict the γ distribution as 135.0 days. It was assumed that acquisition of HIV could have occurred at any point since the beginning of the partnership and the last unprotected sex prior to testing; therefore, the waiting time daysin was drawn from a uniformly distributed point within duration to last unprotected sex. To represent the 10/77 Type 2 testers, the test date followed infection/potential exposure by daysin for 13.0%.
In Type 3 partnerships, individuals tested following suspected exposure during a partnership of some duration, which had ended. To represent the 7/77 Type 3 testers among ELISA/WB-positive testers, the test date followed infection or potential exposure by daysin+after for 9.1% of testers.
For motivated testers with ELISA/WB-positive results, determination of LS-EIA result required calculation of the number of days between the date the individual would have produced antibodies detectable by an ELISA and ELISA/WB-positive test. This was accomplished by subtracting from the number of days between suspected exposure and positive test the number of days the individual would have antibody levels undetectable by the current ELISA. This number was randomly assigned from a uniform distribution of 1–30 days to reflect the period an HIV-infected person would have a negative ELISA, estimated to be between 10.2 and 27.4 days.6 One thousand Monte Carlo simulations generated both STARHS and cohort measures of seroincidence from the simulated data, which were compared with STARHS and cohort seroincidence estimates from MSM tested at PHSKC.
Construction of models in which degree of motivated testing was varied
Lastly, data sets were simulated by varying the proportion of individuals expediting testing in response to suspected infection while holding other parameter values constant. Simulations were also conducted, varying the degree to which testing was expedited by incrementally changing the distribution of waiting times daysin and after, varying the type of partnerships from which encounters motivated testing by changing the proportion of testers for whom the suspected exposure was a single encounter (Type 1 source partnerships).
Approaches to calculation of seroincidence
Cohort seroincidence was calculated from PHSKC data and simulated data using a cohort estimator derived from Kitayaporn.7 The formula for this estimator is given by:
Because simulated data sets contained one observation per individual, it was appropriate to use the original STARHS formula from Janssen to compute incidence as follows:
Results
In 1000 Monte Carlo simulations on 10 000 simulated MSM, expediting testing slightly decreased the proportion with positive ELISA results in the next test (a mean 209.7 days for unexpedited simulations vs a mean 202.2 days for expedited; p<0.001), resulting in positive test prevalences for all tests performed during the simulation period of 2.1% and 2.0%, respectively. Among those testing ELISA-positive, the proportion with LS-EIA non-reactive results was greater (a mean 19.2% non-reactive for unexpedited simulations vs a mean 26.2% for expedited; p<0.001). Expediting testing increased the proportion of LS-EIA non-reactive results among all results used in calculating STARHS seroincidence (in which the denominator includes those with ELISA-negative results) from 0.4% to 0.5% (p<0.001).
In 1000 Monte Carlo simulations on 10 000 individuals, STARHS estimates were inflated under expedited testing (table 1). Simulated STARHS seroincidence estimates under which testing was unexpedited were comparable with the cohort seroincidence estimate from the original dataset. Under the degree of expedited testing parameterised using SAMS data, simulated STARHS seroincidence estimate approached the empirical STARHS estimate. Under both unexpedited and expedited testing, however, simulated cohort estimates were identical and were not appreciably different from the empiric cohort estimate. The ratio of data-based cohort estimates to data-based STARHS estimates approximated the ratio of simulated STARHS under independence between acquisition of infection and testing and under motivated testing (figure 2).
Incidence estimates (infections per 100 person years under independence between acquisition of infection and testing and testing expedited by behaviour)

Boostrapped HIV incidence estimates using serological testing algorithm for recent HIV seroconversion (STARHS) and cohort-based methods using data from men who have sex with men (MSM) tested at publicly funded sites in Seattle, 1996–2000, and resulting seroincidence estimates, by STARHS- and cohort-based methods, from 10 000 simulated MSM in 1000 Monte Carlo simulations, based on incidence and testing frequency parameters taken from MSM tested at publicly funded sites in Seattle 1996–2000, under independence between infection and testing and under the degree of motivated testing in Seattle Area MSM study data. Bootstraps were derived using 500 repetitions of samples of 50% of observations. Simulated data consist of 10 000 individuals, simulated 1000 times.
When varying the proportion of individuals expediting their next test between 10 and 90% at 10% intervals, and keeping other parameters constant, the simulated STARHS seroincidence ranged from 1.3 to 2.2 new infections per 100 person-years (figure 3). Simulated cohort estimates were robust against varying the proportion of expedited testers (a constant 1.20 new infections per 100 person-years).

Resulting seroincidence estimates, by serological testing algorithm for recent HIV seroconversion (STARHS) and cohort-based methods, from 10 000 simulated men who have sex with men in 1000 Monte Carlo simulations, varying the proportion of testers who are motivated, holding constant waiting times between suspected exposure and positive test and type of motivated tester.
Varying the interval between potential exposure and testing was accomplished simulating distributions of intervals based on half the mean and median numbers of days of duration, and based on double the mean and median numbers of days of duration. Halving the times between suspected exposure and testing increased simulated STARHS seroincidence estimates (1.7 new infections per 100 person-years) (figure 4). Doubling the waiting times brought STARHS seroincidence close to that of unexpedited STARHS and cohort estimates (1.3 new infections per 100 person-years). Cohort estimates were robust against varying waiting times (a constant 1.2 new infections per 100 person-years).

Resulting seroincidence estimates, by serological testing algorithm for recent HIV seroconversion (STARHS) and cohort-based methods, from 10 000 simulated men who have sex with men (MSM) in 1000 Monte Carlo simulations, using halved and doubled waiting-times between suspected exposure and positive test from Seattle Area MSM study (SAMS) data, holding constant the proportion of motivated testers and type of motivated tester.
Varying the proportion of Type 1 testers between 10% and 90% resulted in STARHS estimates ranging between 1.5 and 1.7 new infections per 100 person-years (figure 5). Cohort estimates were constant, at 1.2 new infections per 100 person-years.

Resulting seroincidence estimates, by the serological testing algorithm for recent HIV seroconversion (STARHS)- and cohort-based methods, from 10 000 simulated men who have sex with men in 1000 Monte Carlo simulations, varying the proportion whose suspected exposure was a one-time encounter, holding the proportion of motivated testers and waiting times between suspected exposure and testing constant.
Discussion
Using empirical data, STARHS estimates are generally greater than cohort seroincidence estimates, raising the possibility that testing motivated by risky behaviour leads to a greater proportion of LS-EIA non-reactive results than would arise if dates of testing and acquisition of infection were independent. STARHS and cohort seroincidence estimates from simulated data in the absence of testing motivated by behaviour (ie, independence between date of acquisition of infection and date of testing) were similar to data-based cohort estimates, indicating a good fit of the overall model. Application of motivated testing to the degree derived from SAMS data resulted in simulated STARHS estimates approximating empirical STARHS estimates. Expediting testing did not increase simulated cohort estimates of seroincidence, suggesting that motivated testing may be a source of bias in STARHS, but not cohort incidence estimates.
Simulated STARHS estimates varied appreciably with the proportion of testers presenting as a result of potential exposure or infection. Cohort estimates were stable, indicating that true incidence is barely affected by the number of individuals who test in response to risk, or to acquisition of infection. A slight increase in cohort incidence estimates under expedited testing can be attributed to the relatively small decrease in person-time, but the magnitude of the increase in cohort estimates under motivated testing is much lower than that seen with STARHS.
Reducing waiting times between exposure and testing appreciably increased STARHS incidence estimates, but not cohort estimates. Extending waiting times reduced STARHS estimates to almost match estimates in the absence of expedited testing. However, a change in waiting times did not affect simulated cohort seroincidence. Therefore, the promptness with which those who experience a potential exposure seek testing can bias STARHS results.
There are several limitations to this set of simulations. Data on motivated testing used as the basis for model parameters were taken from only 77 individuals, and data for waiting times between suspected exposure and testing were available for only 24. In addition, reasons for testing for HIV are complex, and those testers may not have presented directly as a result of the contacts that they believed to be the source of their infection. Because it may be unfeasible to collect data on whether an individual seeks testing as a result of a potential exposure (which may not happen at a cognitive level), these models used time between sexual contacts believed to be the source of HIV infection for recently diagnosed MSM as a proxy, in the absence of better alternatives. It is encouraging, however, that application of the waiting times found in SAMS data caused expedited STARHS estimates to emulate clinical STARHS data. Unavailability of data for parameterisation of testing motivated by symptoms of primary HIV infection, and testing motivated by symptoms of, or reported exposure to, other STIs precluded their incorporation into models. However, as some SAMS participants likely experienced these factors, waiting times following suspected exposure may capture those elements to an unknown degree. Last, these models do not account for the increased likelihood of testers with long-term, untreated HIV infection and waning immune response, to test LS-EIA non-reactive.
The limitations of STARHS’s application to clinical data are not limited to estimation of incidence using the LS-EIA, as motivated testing would affect estimates from any method that used a time-dependent biomarker. However, despite challenges in collecting data from testers on suspected exposure to HIV and its possible motivation to seek HIV testing, it may be worth while assessing its potential. To conduct an assessment, it would be necessary to collect data from testers, including those with ELISA-negative results, on whether their presentation for testing is motivated by recent risky behaviour, how long ago that recent behaviour was (including dates of first sexual risk with suspected source partners) and whether exposure took the form of a single encounter or a partnership of any duration and whether that partnership was ongoing at the time of testing. Testers must also be asked for the date of their last test and result. Should a scheme be devised for weighting LS-EIA results by the inverse likelihood of the individual testing during the period of ELISA-positivity/LS-EIA non-reactivity, and STARHS estimates may be more valid. Weighting schemes for producing STARHS estimates from clinical data are under development.2 8 Comparisons between established methods of incidence estimation and those weighted methods will require validation, using both empirical and simulated data.
Key messages
Seroincidence estimates using STARHS are vulnerable to bias when applied to specimens and data from individuals who chose the time of their testing.
Monte Carlo simulations derived from testing frequencies and HIV incidence observed in a clinical MSM population, under which dates of testing and infection are independent from one another, produces unbiased STARHS and cohort incidence.
Imposing dependence between infection and testing to the degree observed in among ELISA-positive testers from a similar population results in inflated STARHS estimates.
The degrees of bias in STARHS applied to empirical data, and applied to simulated data parameterised using observed motivated testing data, are remarkably similar.
Acknowledgments
The authors wish to thank J Karon, R Song and R Byers, of (or formerly of) the Centers for Disease Control and Prevention, for their kind advice in the preparation of this manuscript and statistical advice. They also express their gratitude to H Thiede, of Public Health—Seattle & King County, and M Golden, of the Seattle STD Clinic, for their assistance.
Footnotes
Funding The parent study providing the data used in this analysis was conducted with the support of Centers for Disease Control and Prevention, Grant Number U62/CCU006260. This analysis was conducted with the support of the University of Washington, Department of Epidemiology and by Grant Number T32 MH020031 from the National Institute of Mental Health.
Competing interests None.
Ethics approval Ethics approval was provided by the Waiver from Yale University (this involved the use of deidentified records only).
Provenance and peer review Not commissioned; externally peer reviewed.