Article Text

Abstract
Tremendous global efforts have been made to collect data on the HIV/AIDS epidemic. Yet, significant challenges remain for generating and analysing evidence to allocate resources efficiently and implement an effective AIDS response. India offers important lessons and a model for intelligent and integrated use of data on HIV/AIDS for an evidence-based response. Over the past 15 years, the number of data sources has expanded and the geographical unit of data generation, analysis and use for planning has shifted from the national to the state, district and now subdistrict level. The authors describe and critically analyse the evolution of data sets in India and how they have been utilised to better understand the epidemic, advance policy, and plan and implement an increasingly effective, well-targeted and decentralised national response to HIV and AIDS. The authors argue that India is an example of how ‘know your epidemic, know your response’ message can effectively be implemented at scale and presents important lessons to help other countries design their evidence generation systems.
- AIDS
- HIV
- prevention
- policy
- India
- programme science
- epidemiology
- projection
- prevalence
- seroepidemiology
This is an open-access article distributed under the terms of the Creative Commons Attribution Non-commercial License, which permits use, distribution, and reproduction in any medium, provided the original work is properly cited, the use is non commercial and is otherwise in compliance with the license. See: http://creativecommons.org/licenses/by-nc/2.0/ and http://creativecommons.org/licenses/by-nc/2.0/legalcode.
Statistics from Altmetric.com
Background
The HIV epidemic was discovered almost 30 years and we still have 2.7 (range 2.4–2.8) million new infections per year.1 Evidence-based resource allocation to increase the efficiency and effectiveness of national programmes has become a global focus.2 While data collection efforts have been extensive globally, too few have been able to embody the Know your epidemic, Know your response message advocated by the HIV/AIDS community at large.3 Two questions remain critical: what data should be collected and how should it be used to help design and implement an effective national response?
In India, best viewed as a ‘subcontinent’ with a population of 1.2 billion people and with 35 states and union territories, 640 districts and 5924 subdistricts,4 the response to HIV has been led by the National AIDS Control Organization (NACO), established in 1986. It has evolved and intensified over 2 decades, in three well-designed National AIDS Control Programs (NACP-I, 1992–1999; NACP-II, 2000–2006; and NACP-III, 2007–2012).5 Current evidence indicates that the response has been appropriately focused and effective (Supplementary Material 1). National HIV prevalence among sex workers (between 2003 and 2008)6 and new infections among adults (between 2000 and 2009)7 have reduced by more than 50%.
How did India do it? India's development and use of evidence to make critical policy and programmatic decisions are part of the answer. Over the past 15 years, the number of data sources has expanded and became more strategic, and the unit of data generation, analysis and use for planning has shifted from the national to the state, district and now subdistrict levels at least in the priority states. This has enabled India to focus on the right geographical areas, populations and solution levers and to fine tune and decentralise its response over time. We describe and critically analyse India's strategic data collection framework and present its lessons, which could help guide other countries design or enhance their current platform for generation of evidence related to the HIV/AIDS epidemic.
Establishing an HSS system and an initial response in NACP-I
After several years of prevalence studies among pregnant women attending public antenatal care (ANC) clinics and sexually transmitted disease (STD) clinic attendees, NACO established the HIV sentinel surveillance (HSS) system in 1992, and expanded it across the country in 1998, among ANC and STD clinic attendees and select high-risk groups (HRGs) to more systematically analyse the epidemic (figure 1, table 1 and Supplementary Material 2).8 Sites were initially selected in areas or cities thought to be of high risk, such as Mumbai and Chennai. The first HSS rounds were used to produce national estimates of the number of people living with HIV (PLHIV) in India.9

Expansion of HIV sentinel surveillance system (HSS). The number in each year (A) and the geographical location in 2002 and 2008 (B) HSS sites by type are shown. Only mainland India is shown. States and districts are outlined by black and grey lines, respectively. The number in brackets indicates the number of surveillance sites. ANC, antenatal clinic; FSW, female sex worker; IDU, injecting drug user; MSM, men who have sex with men; NACP, National AIDS Control Program; STD, sexually transmitted disease.
Data sources for monitoring the HIV/AIDS epidemic in India
In 1996, the US Agency for International Development initiated the AIDS Prevention and Control Program under NACP-I in Tamil Nadu and conducted the first state level Behaviour Surveillance Survey (BSS).10 Analysis of HSS, BSS and emerging data from special studies began to indicate concentrated epidemics. With little information initially available, the design of the national response under NACP-I was to a large extent focused on raising awareness among the general population, ensuring blood safety, control of sexually transmitted infections and mobilising national commitment, while interventions directed at HRGs were piloted in select cities (Supplementary Material 2). Data collected during NACP-I helped guide critical elements of NACP-II such as an expanded national surveillance system with an increased focus on HRGs to better guide national planning and target prevention interventions among most-at-risk communities.
Expanding and diversifying data collection to focus the response in NACP-II
NACO led several key data, knowledge and programmatic developments during NACP-II. Data from the early 2000s were critical to help India focus its efforts in the most affected geographies and populations. Maharashtra, Tamil Nadu, Andhra Pradesh and Karnataka in the south and Manipur and Nagaland in the northeast were identified as the ‘high-prevalence priority states’.11 Prevalence among HRGs was also found to be several fold higher than among pregnant women in almost all districts, which confirmed a concentrated epidemic typology, with most-at risk populations being female sex workers and their clients and men who have sex with men in the southern states and injecting drug users (IDUs) in the Northeast.12 Furthermore, variation in prevalence between districts was also seen. The implication of these findings was that NACO enhanced district level data collection and scaled up prevention programmes with HRGs in the most affected districts. In 2003, NACO added a large number of HRG and ANC sites (including rural sites) to the HSS and, subsequently, NACO expanded the system to also cover the northern states to give a more heterogenic picture of HIV throughout the country (figure 1).13 That same year, the Bill & Melinda Gates Foundation launched its large-scale HIV/AIDS prevention programme with HRGs (Avahan) to help halt and reverse the epidemic.14 NACO and partners developed and applied new methodologies, specifically to provide district level information, to inform the fine-tuning of NACP-II and the design of NACP-III (table 1 and Supplementary Material 2), as described below.
Direct mapping and size estimation studies of HRGs
Estimating the size and mapping the location of networks of the populations most at risk are critical to designing, implementing and monitoring effective prevention programmes.15 16 However, size estimates of HRGs are often based on population-based methodologies, which do not accurately reflect the geographical variability in size, network structure and typology.17 Using direct field-based methods, the Avahan programme conducted the first systematic and large-scale size estimation and mapping of HRGs in six high prevalence states.18 This helped guide and tailor programme implementation in each district and site and resulted in an increase of coverage of HRGs in Avahan intervention areas from 30% to over 80% in 3 years.14 This also helped guide size estimation exercises later conducted by NACO throughout the country.
Behavioural and biological surveys
Large-scale behavioural and biological surveys were implemented to monitor changes in risk factors and determinants of HIV among HRGs and the general population primarily in the most affected geographical areas (table 1 and figure 2). Three features are noteworthy: (1) the use of integrated behavioural and biological surveys, (2) the design of these to collect district level information and (3) the use of innovative behavioural surveys to capture information at the level of the intervention. Surveys, such as the Integrated Behavioral and Biological Assessment (IBBA), General Population Survey (GPS) and National Family Health Survey Round 3,19 helped assess the coverage of interventions20 (table 1), further refine the estimated HIV prevalence1and evaluate progress towards the national programme goals and targets. District level surveys were also actively used by the prevention programmes to help them prioritise ‘real time’ efforts and make the needed mid-course corrections. For example, the first round of IBBA data showed high levels of HIV among female sex workers with <1 year duration in sex work. This led the programme to prioritise outreach to new entrants into sex work. It also showed that HRGs who faced violence were less likely to use condoms with their clients, stressing the importance of having crisis response systems as an integral component of targeted interventions.21 Furthermore, methods such as Polling-Booth Surveys and Informal Confidential Voting Interviews were used to monitor behaviour change at the level of the prevention programme and to overcome the social desirability bias associated with face-to-face interviews.22

Expansion of district level surveys in the Avahan programme. (A) Bubble chart shows the year and the number of districts each survey is implemented. Size of bubble reflects sample size. Bubbles without black border are behavioural surveys and those with black borders are integrated behavioural and biological surveys. For each survey, samples from various populations were combined. BTS for men at risk was excluded as it was not district-specific. PBS and ICVI were combined. IBBA excludes IBBA round 3 conducted in Mysore district. IBBA round 1 (R1) spans from 2004 to 2008 but the majority of districts were covered in 2006 and so samples for all groups were combined and plotted in 2006. IBBA round 2 (R2) spans from 2006 to 2010 but the majority of districts were covered in 2009 and so samples for all groups were combined and plotted in 2009. GPS round 1 (R1) was scattered across the year and so each district is plotted individually, except for 2008 where data from two districts are combined. GPS round 2 (R2) spans from 2009 to 2010, samples combined and plotted in the chart in year 2010. (B) Map shows the districts in which each survey was conducted, represented by shape of symbol and the typology of population it surveyed is represented by colour of symbol: orange, transgender (TG); red, female sex worker (FSW); black, injecting drug user (IDU); blue, client of FSWs; purple, men who have sex with men (MSM). BTS, Behavioural Tracking Survey; GPS, General Population Survey; IBBA, Integrated Behavioral and Biological Assessment; ICVI, Informal Confidential Voting Interview; PBS, Polling-Booth Survey. Only the GPS conducted under the Avahan programme is represented as others were one-time only. States and districts are outlined by black and grey lines, respectively.
Enhanced routine programme monitoring data
Innovative approaches to the collection of routine monitoring data, especially within prevention programmes for HRGs, were introduced including individual tracking of the risk profile of HRG members, such as number of clients per week, clinic visits and distribution of commodities (condoms and/or needle and syringes). The Avahan programme developed simple and symbol-based micro-planning tools, for the mostly illiterate peer educators, to enable peer educators prioritise, micro-plan and record their outreach activities on a weekly basis.23 Data from all prevention, testing and treatment programmes were fed into a centralised computerised monitoring information system to enable the flow and analysis of data from the ground up to all supervisory and management levels.24 This facilitated real time monitoring and enabled timely programme response to gaps. NACO quickly adopted these innovations and implemented them across the country resulting in uniform data collection and reporting formats in 2009.
Expanded use of data during NACP-II: getting a grip on the epidemic
The comprehensive analyses of data and the emergence of district level information during NACP-II shed light on important aspects of the epidemic in India and were used to design an expanded yet focused national response (Supplemental Material 1). Data confirmed the epidemic to be driven by high-risk practices among select populations.12 13 While two-thirds of the HIV burden was found to be in the six high prevalence states, home to 30% of India's population, extensive district level heterogeneity was also observed in both prevalence and determinants of HIV. As a result, targeted interventions were scaled up and testing and treatment programmes initiated5 in these states, with high intensity in the priority districts.14 NACO also decentralised decision-making, programme management and data collation and use to the State AIDS Control Societies. With the expanded and continuing surveillance, trends in HIV prevalence among young ANC clinic attendees were analysed as a proxy for trends in HIV incidence, revealing the first signs of a decline in trends of new infections.25 With the availability of multiple data sources (National Family Health Survey Round 3 data, BSS, IBBA and size estimations), India was able to estimate more accurately the number of PLHIVs (2.5 million in 2006 as compared with the previously used estimate of 5.1 million in 2003).26
Triangulating data and categorising districts to scale up and refine the response in NACP-III
NACP-III is characterised by a sea change in the scale of the response by (a) increasing the resources made available (from $598 million in NACP-II to $1.8 billion in NACP-III) with about two-thirds allocated for prevention, (b) scaling and refining of prevention programmes with HRGs (from 789 entities in NACP-II to close to 1600 in 2010), (c) developing a more comprehensive programme response to include care, support and treatment and (d) continued investment in knowledge building and monitoring and evaluation.27 28 Improvements were made to the HSS system, especially in the north and among HRGs (figure 1); NACO conducted a national level size estimation of HRGs in 20 states in 2009; and other key data advancements included the use of facility-based data, triangulating data, and categorising districts based on risk and vulnerability.28 These led to an increasingly decentralised and focused response which will be instrumental in the design of the next phase of HIV/AIDS programming in India (Supplemental Material 1).
Facility-based data from testing and treatment centres
Launched in the early 2000s, the prevention of parent-to-child transmission (PPTCT), integrated counselling and testing centres (ICTCs) and antiretroviral treatment (ART) programmes have expanded considerably across the country since 2007 and are being used to better evaluate the epidemic (table 1).6 28 Major advantages of using routinely collected, facility-based data for HIV epidemic analysis compared with survey data include: lower cost to the government; collection of extensive individual level demographic data in addition to HIV prevalence; and high and representative coverage of the population. Furthermore, due to large sample sizes and geographical coverage, facility-based data enable analysis at the subdistrict level and focused resource allocation within the district, a key advancement in NACP-III.
Within the PPTCT programme, coverage of estimated pregnancies is higher in the four southern states (58%), compared with the national coverage (22%) but expanding rapidly as the programme is scaled up. While PPTCT data do inherit many of the limitations of HSS-ANC data, the PPTCT data reflect district prevalence more accurately as it has close to 10 times more sites evenly distributed across the district, including a large number of rural sites which capture 70% of the total population, and samples close to 20 times more women. Furthermore, because of the large sample size, district level trend analyses are possible with PPTCT, but not HSS-ANC data. A key element of PPTCT data is the availability of individual-level additional data including age and parity; these data are currently not computerised but are anticipated to be collected with the new strategic information management system.
Interpreting HIV prevalence from ICTCs, which capture data from men and non-pregnant women, can be challenging as our understanding of the client profile in India is still poor. However, the comparative analyses of demographic factors of the HIV positive and negative clients, as with ART data, help us understand the determinants and drivers of the epidemic and access to ART across districts and subdistricts.29–31
ART data are gradually being used to better understand changes in prevalence and incidence,32 as a large number of infected individuals live prolonged lives. It will improve coverage by helping us track adherence, identify low-performing and high-load sites, and in turn provide evidence for programmatic changes.
Triangulation of data, district categorisation and decentralisation
With expanded and increasingly refined data collection activities, three key developments are seen during NACP-III: (1) triangulation of data, (2) categorising geographical areas and (3) increasingly district, rather than state, level programming. To allocate resources more efficiently in NACP-III, NACO first classified its districts into four categories (A–D) using HSS data, where A districts were the most affected and D the least.33 As a result, more resources, programme elements, such prevention programmes in rural areas, and management units, such as District AIDS Prevention Control Units, were allocated to A districts. Districts were first classified at the launch of NACP-III using 2003–2005 HSS data and reclassified in 2007 when the expanded 2006 HSS data were available. In 2009–2010, NACO undertook the first systematic and nationally led data triangulation exercise in 27 states,28–31 34 using all of the epidemiological, behavioural and programme data collected to date to develop a more comprehensive understanding of the epidemic and build the capacity of Monitoring and Evaluation (M&E) officers at the state and district levels. Large variations in HIV variables were found within districts (between subdistricts). Given the relative large size of districts in India, with an average population of 1.7 million, subdistrict level data helped programmers further prioritise their efforts within the district. For example, using the new subdistrict level estimates of PLHIVs, drop-in centres for PLHIVs were reallocated to meet the local needs. Subdistricts with the highest HIV prevalence among PPTCT centres were also identified29 30 and prevention programming with HRGs and male clients and overall Information, Education and Communication (IEC) activities intensified in these select areas. Because of this exercise, there has been a fundamental rethinking of district classification and hence resource allocation to include both risk and vulnerability profiles.28 By carefully analysing data on programmatic gaps and needs, a special new focus on saturated coverage, intensity and quality of interventions has also emerged within the national programme.
A critical analysis of India's evidence-based programming and lessons learnt so far
We address key questions around evidence generation and decentralisation of the HIV/AIDS response in India, which can inform other countries as they design and implement their HIV/AIDS evidence generation platforms.
What has been the cost of the evidence generation efforts? Which aspects of the data collection efforts so far have been most important?
The proportion of the total budget that NACO spent on M&E increased from 2% during NACP-II to 3%–4% during NACP-III. The Avahan programme spent 13% of its total envelop on M&E, which included data collection, analytics (including modelling), capacity building and dissemination. Data collection and basic analytics alone comprised 6% of the total Avahan budget. The national spend is less than the recommended 5%–10% range, but more than the reported global median of 1.8%.35 The data sets that have been the most useful so far are the direct size estimation and mapping, the HSS with ANC HRG data, the integrated behavioural and biological surveys (such as IBBA), the Computerized Monitoring Information System (CMIS) and the PPTCT because collectively they have provided critical information on the epidemic and enabled evidence-based programming decisions and impact analysis. With the routine surveillance data and direct size estimation/mapping, it has been possible to target prevention programmes to the appropriate geographies and design them so that they reach the populations more effectively. The CMIS has been critical for monitoring programme outputs. Similarly, the Polling-Booth Surveys, while implemented only in select states, have allowed ground level implementing agencies to monitor their outcome at a low cost. With the HSS-ANC data, the programme has been able to monitor trends in incidence (using proxy measures) at national and state levels and monitor impact to some degree. The emerging PPTCT data set is providing a more accurate proxy of the levels of HIV, at least among women. The IBBA has been extremely valuable in monitoring impact and modelling the number of infections averted at smaller and programmatically relevant geographical units (eg, district).
How important have the data been in shaping the response?
A limitation of this study is the lack of comparable countries to India, in terms of size and diversity, which could be used to determine whether India's successful response has been driven or altered by data. Although there is no experimental design to fully address this question, we can, however, assess how the response changed as new data emerged, by looking at examples over time and across geographies within India.
The data that became available during the latter part of NACP-II, which made analyses on the driver of the epidemic12 and the cost-effectiveness of prevention programmes36 possible, informed the shift of resources to prevention such that two-thirds of the budget was allocated for prevention programmes in NACP-III. The prioritisation of districts (A, B, C and D classifications) and decentralisation of the response to the district level during NACP-III became possible only after sentinel surveillance was sufficiently scaled up. Furthermore, the reclassification of districts using additional biological and behavioural data in the later parts of NACP-III only took place once further behavioural and biological data from the surveys and facilities became available. The scale of prevention programmes with HRGs (from 326 in 2003 to 1019 in 2008) followed the scale-up of HSS (from 59 in 2003 to almost 322 in 2008) and implementation of size estimation/mapping exercises, which revealed the needs. New pockets of IDU epidemics, such as in Punjab and Uttar Pradesh, were discovered only after the expansion of the HSS-IDU and, in response, NACO is scaling up interventions to reach them. Programmes where rigorous data were available, such as in the south, were more finely tuned and targeted to reach those most at risk. Finally, it is because of the lack of coherent behavioural and biological data on migrants that India is struggling to answer the question of how much this population contributes to the epidemic and what is the most effective strategy to reach them.
What are the key data collection and use issues related to decentralising the HIV response?
Through the successive rounds of NACP, the management of the response has been increasingly delegated to smaller geographical administrative units. In our view, two policy decisions have made this successful. First, while NACO delegated the management and oversight of the response to state and district levels, a strong national policy and oversight by NACO ensured a unified and evidence-based response, built around key strategic approaches. The role of NACO in designing and overseeing the M&E system ensured that the evidence gathered was standardised. Second, investing in building management and technical units (eg, state Technical Support Units and district level District AIDS Prevention Control Units) built capacity to manage a decentralised evidence response. Technical Support Units have been absolutely essential and maintaining their role and quality will be important moving forward. Other countries, including many African countries such as Kenya, have also opted for decentralised models. However, a need to strengthen province/state and district level management units has been identified in many.
Looking ahead: recommendations for future HIV/AIDS programming in India
Data collection in the upcoming phase of the national programme could be more efficient and informative and improvements to the system are planned.
Scaling back
Moving forward, several efforts including the GPS, BSS and HIV surveillance could be scaled back to save costs. The GPS is costly, labour-intensive and difficult to scale up. It is valuable primarily for modelling efforts or in geographies where non-HRGs contribute to the epidemic. Behavioural outcomes from the state level BSS have also been challenging to interpret (eg, condom use has been over 80% from the first round) due to socially desirability bias and difficulty in rigorous implementation of the survey. The BSS could be simplified to focus on more reliable and measurable indicators such as awareness parameters or they could be discontinued. The value of HIV surveillance at STD centres is minimal since results are confounded by participation bias and should be discontinued. The HSS-HRG should be replaced with second generation surveillance. Finally, the frequency of HSS-ANC could be reduced to every 2 years as changes are expected to occur gradually.
Enhancing second generation surveillance nationally
A key challenge for the national programme is to measure impact at state and district levels beyond the Avahan districts where IBBA was conducted. NACO is considering to implement Integrated Behavioral and Biological Surveys (a simplified version of IBBA) starting in 2012 in districts outside the six high prevalence states,28 which could be done every 2 years.
Identifying remaining pockets
Northern India needs better data to avoid missing important and emerging epidemic pockets. The continuous expansion of PPTCT, ICTC and ART programmes will partially resolve this issue. In addition, rapid HIV surveys could uncover pockets, such as among male migrants (who largely come from low prevalence states), in destination sites where anecdotal, behavioural and programmatic indicators point to potential risk.37–39
Shifting emphasis from prevalence to incidence
India will focus more on estimating HIV incidence rather than prevalence alone, especially as access to treatment increases. Incidence proxy trends in young pregnant women will be closely monitored using HSS-ANC and PPTCT data enhanced with age and parity indicators. Among HRGs, incidence trends will also be followed by assessing trends in HIV prevalence among new initiators.40 Finally, India is undertaking efforts to better estimate new infections using the Estimation and Projection Package and the AIDS Impact Model from the Spectrum Projection package and will work to decentralise these approaches.28 41–43
Strengthening strategic information management and capacity building for data analytics
Gaps in data collection, reporting and quality need to be addressed. NACO has recently launched a national Strategic Information Management Unit, to bring the entry and analyses of survey, surveillance, programme data and operational research together into one platform, which will be accessible to implementers and decision-makers.44 Capacity building for programme officers at the state and district levels on data triangulation needs to be scaled and sustained.
Better use of facility-based data
Data from testing and treatment facilities could be used more strategically to enhance and improve prevention programmes. The data show that a substantial proportion of new infections are emerging in female partners of the bridge population, which can be used to make programmatic changes such as initiating couples counselling programme in ICTC and ART centres, which offers the added advantage of repeat client encounters and counselling to prevent these infections.45
Knowing the cost and cost-effectiveness of various interventions, for strategic planning and allocation of resources
Perhaps the biggest challenge for NACP-IV strategic design is the need for better data on the costs and cost-effectiveness of scaling up interventions. As both national and external donor resources for HIV/AIDS are finite, NACO needs more comprehensive data on the optimal allocation of scarce resources.
Fostering an open access environment for data
Finally, fostering a ‘knowledge hub’ and an open access environment for data access and analysis by experts from different fields will substantially enrich our understanding of the epidemic.
Knowing your epidemic: a strategic framework
Evidence-based HIV programming requires a well-designed and implemented national data collection and use system, with an increasing focus on smaller geographical units to capture heterogeneity in the epidemic and enable locally relevant programming. India presents important lessons. Investing in and prioritising the use of evidence pays off in terms of programme results. Under a coherent national policy, evidence should be generated to capture heterogeneity relevant to the geographical level at which programmes are managed and hence enable scale-up, improved programme effectiveness and decentralisation. Finally, data analysis and use should be systematised at all levels of the decision-making and implementation chain.
We present the India framework (figure 3) and outline the critical components of a solid evidence generation platform that countries could use to guide their efforts (box 1) albeit with careful examination of its relevance to their context and adaptation. In summary, a national evidence generation agenda on the HIV/AIDS epidemic should include: (1) routine sentinel surveillance with ANC, (2) direct size estimation of the most-at risk populations updated at regular intervals, (3) second generation surveillance with populations relevant for programming using integrated behavioural and biological surveys, (4) facility-based data designed to capture indicators that are also informative on the epidemic, (5) simple and well designed routine programmes monitoring data that capture the most critical indicators and (6) special studies and research to address emerging questions.

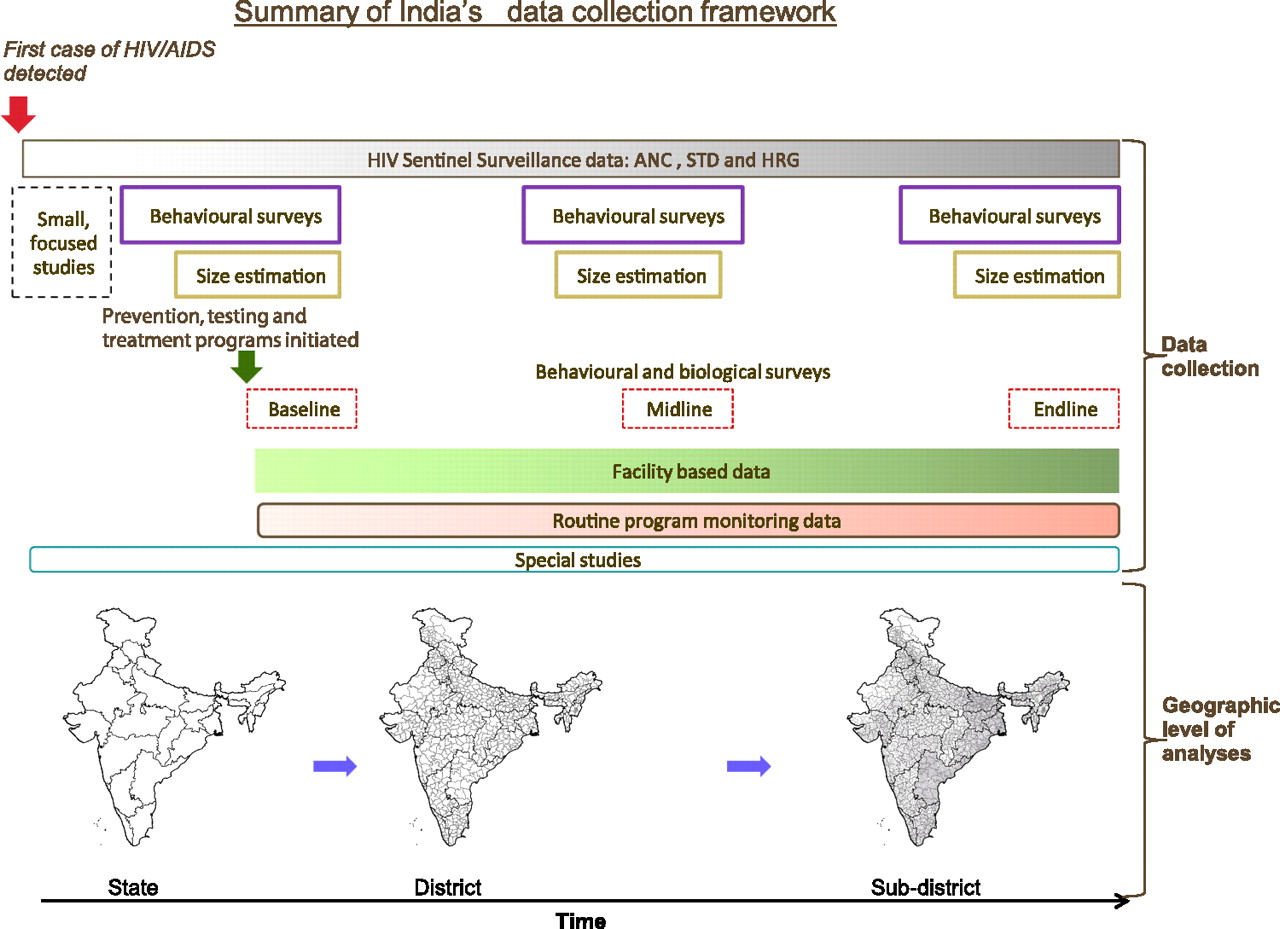
Summary of India's data collection framework. The flowchart maps how the different data collection activities have evolved since the first detection of AIDS in India. ANC, antenatal clinic; HRG, high-risk group; STD, sexually transmitted disease.
Components of an effective evidence generation platform on the HIV/AIDS epidemic
Surveillance: Systematic and widespread surveillance provides routine information on prevalence and incidence proxies among various subgroups.
Size estimation: Direct and regularly conducted size estimation and network analysis of populations most at risk for HIV and targeted for prevention services enables programmes to target their resources where they are most needed and to effectively design the delivery of prevention services. Active involvement of the affected communities in the data collection is the key.
Surveys: While costly and operationally challenging, well-designed integrated behavioural and biological surveys with both general and high-risk group populations are important to link behavioural and biological outcomes to understand geographical differences in the drivers of the epidemic and monitor programme outcomes and impact. Low cost, easy to implement and small scale surveys should be used to yield rapid results where understanding of the epidemic is limited.
Routine facility-based data: These are of low cost and especially useful if coverage is high and individual level biological, demographic and behavioural parameters are collected in parallel. They can be strategically used to improve prevention programmes.
Data collection: Data collection should be designed to allow for analysis at the most appropriate geographical level at which budgetary and programme decisions are made to help design and monitor programme progress and impact.
Data use: Developing a culture of data use among programmers and policy makers is important; investments for capacity building in analytics and research methodologies should be made.
Data access: Fostering a ‘knowledge hub' and an open access environment of data for analysis by experts from different fields substantially enriches our understanding of the epidemic.
Strategic management of information: A national system of computerised data management that captures information, including surveillance, surveys and programme data from all partners, and is able to conduct rapid user friendly analyses considerably empowers decision-makers.
Measuring incidence: Countries should focus on assessing changes in incidence through the analysis of trends of HIV prevalence in young pregnant women and new entrants into high-risk behaviours and through modelling studies.
Key messages
India has expanded its evidence generation platform over the last 15 years and used this to make informed policy decisions to successfully address the HIV/AIDS epidemic.
The decentralisation and prioritisation of the response in India has been possible by shifting the geographical unit of data collection and use from state, district to subdistrict.
Investing in a coherent national M&E design is critical and at the minimum should include routine and second generation surveillance, direct size estimations and programme monitoring data.
Acknowledgments
We thank the National AIDS Control Organization of India and partners of the Avahan programme, India AIDS Initiative program of the Bill & Melinda Gates Foundation, for providing data. We thank Sylvia Jayakumar for helping with data analysis and Gurpreet Kaur Manchanda for help with developing the figures, NACO staff, David Allen, Stephen Moses, Gina Dallabetta, Rebecca Weintraub and Chris Parker for critical inputs to the manuscript. The views expressed in this review are solely those of the authors and do not necessarily reflect the official views of the Government of India, the Bill & Melinda Gates Foundation, the World Bank or UNAIDS.
References
Supplementary materials
Supplementary Data
This web only file has been produced by the BMJ Publishing Group from an electronic file supplied by the author(s) and has not been edited for content.
Files in this Data Supplement:
- Download Supplementary Data (PDF) - Manuscript file of format pdf
Footnotes
Competing interests The World Bank is a pooling partner with the India Third National AIDS Control Program. The Bill & Melinda Gates Foundation and Government of India funded some of the data sets described in this article. UNAIDS assists NACO with their data analysis and HIV estimation process.
Provenance and peer review Not commissioned; externally peer reviewed.