Article Text

Abstract
Objective To provide estimates of mortality among HIV-infected patients starting combination antiretroviral therapy.
Methods We report on the death rates from 122 925 adult HIV-infected patients aged 15 years or older from East, Southern and West Africa, Asia Pacific and Latin America. We use two methods to adjust for biases in mortality estimation resulting from loss from follow-up, based on double-sampling methods applied to patient outreach (Kenya) and linkage with vital registries (South Africa), and apply these to mortality estimates in the other three regions. Age, gender and CD4 count at the initiation of therapy were the factors considered as predictors of mortality at 6, 12, 24 and >24 months after the start of treatment.
Results Patient mortality was high during the first 6 months after therapy for all patient subgroups and exceeded 40 per 100 patient years among patients who started treatment at low CD4 count. This trend was seen regardless of region, demographic or disease-related risk factor. Mortality was under-reported by up to or exceeding 100% when comparing estimates obtained from passive monitoring of patient vital status.
Conclusions Despite advances in antiretroviral treatment coverage many patients start treatment at very low CD4 counts and experience significant mortality during the first 6 months after treatment initiation. Active patient tracing and linkage with vital registries are critical in adjusting estimates of mortality, particularly in low- and middle-income settings.
- AIDS
- Clinical Care (General)
- Epidemiology (General)
- HIV Clinical Care
This is an open-access article distributed under the terms of the Creative Commons Attribution Non-commercial License, which permits use, distribution, and reproduction in any medium, provided the original work is properly cited, the use is non commercial and is otherwise in compliance with the license. See: http://creativecommons.org/licenses/by-nc/3.0/ and http://creativecommons.org/licenses/by-nc/3.0/legalcode
Statistics from Altmetric.com
Introduction
Thirty years after the first description of the AIDS, cases of the disease have been observed in every part of the world. More than 33 million individuals are infected with the majority of them living in low- and middle-income countries.1 However, there are also positive statistics. According to the same report, new infections have been reduced by 19% since 1999. In addition, up to 5.2 million people in low- and middle-income countries were receiving care in 2009, 1.2 million of whom started therapy for the first time in that year; a significant 30% increase compared with only a year before. Still, this only represents just over a third of all persons, 15 million by some estimates, who need therapy now.
Regardless of the enormity of this challenge, it is obvious that we are witnessing a historic undertaking with rapid scale-up of services providing antiretroviral therapy (ART) to millions of HIV-infected individuals, particularly in resource-limited parts of the world. By all accounts, the largest pharmacological intervention in human history has reduced rates of opportunistic infections, increased survival and enhanced the quality of life of the recipients of these services.2 ,3 Nevertheless, it is clear that the impact of therapy is not the same across all groups of patients living with HIV/AIDS or all regions of the world.2 For example, mortality is higher among patients with greater suppression of their immune system as indicated by lower CD4 lymphocyte levels at the start of therapy despite access to treatment4 and response to therapy may not be as strong compared with patients with higher CD4 counts.5 ,6 Gender and age play a role as well. In resource-constraint settings, men generally access treatment later than women7 and may be less compliant to therapy once initiated.8–10 Also, the disease may affect younger and older patients differently.11 ,12 Thus, assessment of treatment efficacy, programme evaluation and policy making should, at a minimum, take these disease-specific and demographic factors into account.
One core component for assessing programme and treatment effectiveness is the estimation of patient mortality, especially among those patients who initiate ART. These estimates will in turn inform policy makers, modellers, epidemiologists and other stakeholders involved with antiretroviral programmes throughout the world. There are a number of advantages in considering mortality as the primary patient outcome. Mortality is the ultimate endpoint by which to evaluate the effectiveness of an intervention when, as is the case with HIV infection, the disease represents a grave risk to the survival of the patient. Another advantage is the unequivocal nature of the death as an outcome (as opposed to diagnosing a bacterial infection, for example). However, significant challenges remain. In all settings, but particularly in low- and middle-income countries, a substantial number of patients starting therapy are lost from observation. In one review covering a number of countries in sub-Saharan Africa, between a quarter and half of all patients who started therapy were lost after 2 years from starting therapy.13 Two reports from patient cohorts in the US and the UK also cited high levels of patient loss14 ,15 suggesting that this phenomenon is not limited to resource-limited settings. Moreover, it appears that, at least in sub-Saharan Africa, the risks for mortality overlap to a large extent with the risks of loss from follow-up16 ,17 and that the hardest to reach patients may also be those at the highest risk of mortality.18 Thus, it comes as no surprise that programmes which undertake more intensive efforts to locate patients who have been lost have higher levels of mortality.2 The immediate consequence of all these considerations is that mortality estimates will be negatively biased when derived exclusively from information on deaths obtained passively among patients who were maintained under observation until the end. The result is a potentially significant underestimation of the true death rates in reports which are based solely on passive death information.
Recently, mathematical models originally developed to address issues of informative dropout in studies of survival have been adapted to the context of ongoing epidemiological cohorts with similar non-random losses from follow-up.16 ,17 ,19 These efforts are emanating from the work on double sampling20 by Frangakis and Rubin21 and inverse probability of treatment weighting schemes introduced by Robins and others.22 ,23 They are based on the availability of vital status information on a random sample of patients among those who have been lost to follow-up (the second or ‘double’ sample). The methodology weighs those lost patients with available vital status information by the inverse of their number over all patients who were lost. In this manner, a pseudo dataset is constructed where the actively sought patients, including all deaths thus ascertained, represent themselves as well as all other patients who were lost but were not sought. Patients who remain on observation or have died (and their death has been recorded passively, without resorting to outreach methods) are weighted by one (ie, they only represent themselves). In this manner, an adjustment of the mortality estimate is made. It can result in dramatically higher mortality estimates because the hazard of mortality among patients lost to follow-up can be over 10 times higher compared with the hazard among patients who remain under observation.17 ,19
Information on the vital status of a sample of patients who are lost to follow-up can be obtained in one of two ways. First, a random sample of the individuals who were lost to follow-up can be traced employing methods such as telephone calls and home visits to establish whether the patient is still alive. In sub-Saharan Africa, there are a number of cohorts employing patient outreach programmes, which trace a significant proportion of lost patients.24 ,25 A second way to determine patient vital status is through national vital registration systems. The latter approach is only feasible if two conditions are met: (1) a reasonably high proportion of deaths are recorded and (2) that health facilities capture the information required for the purpose of linking the patient to the vital registration system. In sub-Saharan Africa, South Africa is one of few countries in which the first condition is met26 with around 90% of all adult deaths recorded.27 The second condition is met only in a subset of South African ART cohorts. In those cohorts, the lost patients who can be successfully located in the death registries can then be treated in exactly the same way as successfully located patients who are physically traced after loss to follow-up. This means that the patients with identity numbers who are lost to follow-up are ‘weighted up’ to represent other lost-to-follow-up patients without identity numbers.28
Unfortunately, access to death registries is the exception rather than the rule in low- and middle-income countries. In addition, there are few sufficiently documented outreach programmes. This is because the goal of most outreach programmes is to locate as many patients as possible in order to reinstate them into care rather than to perform a public health evaluation or attempt to mathematically adjust mortality estimates in their patient population. In many cases, the public health value of documenting patient encounters in the process of outreach is not clear to even mature care and treatment programmes. To overcome this problem, a number of intermediate or hybrid methods have recently been proposed. For example, when outreach data are not available but there is information about the HR between the observed versus lost patients (possibly through outreach programmes at sentinel sites in the same country or region), the mortality of the latter subcohort can be imputed.29 In other cases, one may rely on the observation that programmes with high rates of losses to follow-up also have lower HRs for mortality between patients who are lost and those who remain under observation. This has been observed in a number of instances throughout sub-Saharan Africa where rapid scale-up of care and treatment services result in often chaotic patient self-referral patterns from one clinic to another, which accounts for an increasing proportion of losses to follow-up.30 Using a structured survey of a number of programmes throughout the region, Egger and colleagues constructed a nomogram where a correction factor is estimated according to the mortality ratio between patients who were lost or not and the level of loss to follow-up at a particular programme.31 This correction factor is then used to produce adjusted estimates of 1-year mortality.
Death is thus an unequivocal measure of effectiveness of the care and treatment provided, particularly in the context of a fatal disease. Patient survival also affects a number of downstream economic and HIV-related factors, such as disease prevalence and incidence rates, the productivity of entire societies and so on. Thus, accurate estimation of mortality impacts numerous aspects of scientific enquiry as well as public health policy. This survey paper uses established mathematical modelling methodologies to provide estimates of mortality in HIV-infected patients starting ART by assembling data from a number of cohorts of patients receiving routine medical care and ART in a number of programmes around the world. Although we provide brief description of the methods, our main goal is to provide as geographically complete coverage of the world as possible and thus describe the burden of mortality in a number of world regions.
Methods
Description of cohorts involved in the study
In this paper, we report on five regional cohorts with available patient-level data needed for estimation of mortality in adult HIV-infected patients starting ART: East, Southern and West Africa, Asia Pacific and Latin America.32–36 All five are members of the worldwide International Epidemiologic Databases to Evaluate AIDS (IeDEA) Collaboration, a consortium created to aggregate epidemiological data from HIV regional cohorts around the world. The first of these five IeDEA cohorts is a network of 23 main care and treatment clinics and several satellite clinics comprising the partnership between the United States Agency for International Development and the Academic Model Providing Access to Healthcare (the USAID-AMPATH partnership), located in western Kenya. This cohort includes data obtained from a large number of patients initially lost from follow-up who were subsequently successfully located through AMPATH's massive patient outreach programme.16 ,17 The second cohort is comprised of nine care and treatment facilities in the Republic of South Africa. These cohorts are unique in our study as they have well-documented linkages with vital registries and information recovered from these linkages has been used to adjust estimates of mortality in these cohorts.28 The third, fourth and fifth cohorts comprise care and treatment programmes in West Africa36 and Asia Pacific, made up of the Therapeutics Research, Education, and AIDS Training in Asia (TREAT Asia) Study to Evaluate Resistance and the TREAT Asia HIV Observational Database,34 ,37 and three Latin American cohorts participating in the Caribbean, Central and South American Network.33
Inclusion criteria
Data from all cohorts were obtained through routine clinical care of HIV-infected patients. Inclusion criteria were minimal, specifying simply that the patients were adult (aged >15 years) HIV-infected men and women who were ART naive at enrolment (except for limited previous exposure to antiretrovirals for prevention of mother-to-child HIV transmission) and who initiated first-line ART in any participating site within the cohort. Further detail on prevailing first-line regimens at each region is given in the Results section in the subsection related to each of the five cohorts comprising this study. While second-line treatment regimens are becoming increasingly available in many low- and middle-income settings, the prevalence of second-line therapy is still relatively low, particularly within the sub-Saharan African regions. Even though information on treatment switches to second-line therapy was available in a number of cohorts, we chose not to include this information in the mortality calculations both for simplicity of the modelling and because our main objective in this study was to assess the levels of mortality of a typical HIV-infected patient starting first-line ART in these settings.
Data collected
Data included demographic information such as gender and age. Age was grouped into four categories spanning 15–24, 25–34, 35–44 and ≥45 years. In addition to information on gender and age at initiation of ART, data included all landmark dates of each patient's treatment history, such as the date of ART initiation, the date of the last clinic visit, the date of death and the date of the most recent outreach encounter when applicable. A number of indicators were included in the data such as whether the patient died, whether the patient death was ascertained via passive means or through patient outreach and whether the patient had been lost to follow-up. Loss to follow-up was defined as having no clinical visits for more than 6 months. Gaps in care, where a patient discontinued attending the clinic for some time but subsequently returned to care, were not considered as losses to follow-up. On the other hand, patients who were outreached were essentially treated as having been lost to follow-up regardless of the length of time between their last visit and the outreach encounter date as, once traced successfully, their loss to follow-up status would never be determined with certainty.17 This only applies to cohorts with documented outreach programmes (Kenya) or established linkages to vital registries (South Africa).
CD4 count at ART initiation was defined as the CD4 count available within 6 months before (strictly speaking 182 days before) and 14 days after initiation of therapy (the latter to ensure inclusion of CD4 counts which were obtained contemporaneously with the start of treatment but were recorded with a small delay). If there were multiple CD4 measurements during this period, then the one closest to the start date of ART was selected. The CD4 categories used were <50, 50–99, 100–199, 200–249, 250–349, 350–499 and ≥500 cells/μl.
Mathematical models of patient mortality
We adjusted mortality estimates for the East Africa data using methods based on double sampling of physically located patients who were lost to follow-up.16 ,17 For South African data, we used similar methods, but lost patients were instead ‘searched’ in the death registries of the country.28 Only passively determined death information was available in all other cohorts. For these cohorts, we used a modification of the approach by Brinkhof and colleagues,5 which uses inflation factors to increase mortality under-reporting. Death rates based on observed data only were estimated for each patient subgroup defined by gender as well as age and CD4 category. These passive mortality estimates were then multiplied by a group-specific inflation factor determined as the ratio of the outreach-adjusted death rates over the observed rates estimated within the Kenyan and South African cohorts. This calculation resulted in two adjusted estimates of mortality—one using Kenyan data and the other using South African data—for cohorts where patient outreach was not available. This approach also addresses a number of limitations in the nomogram approach proposed by Egger and colleagues38 in that it provides specific adjustments for all subgroups defined by gender, age and CD4 count as well as generating adjusted estimates past 1 year after ART initiation.
A final detail concerns the two-phase nature of the mortality hazard after initiation of ART. As has been widely published, the first 3–6 months after ART initiation are critical for the survival of the patient.31 ,39 In this analysis, we used a piece-wise exponential model fit through Poisson regression. Four distinct intervals were defined at 0–6, 6–12, 12–24 and >24 months. This model assumes constant hazards of mortality in each interval (although these are allowed to vary from interval to interval). The period between 0 and 6 months was modelled separately from later periods to address the uniqueness of the early post-treatment period of high mortality.39 Although this is a rather limited model in describing the changes in mortality which occurs after initiation of ART, it is useful because it is easy to implement and even easier to describe to stakeholders and decision makers involved with antiretroviral programmes around the world. Adjustments for dropout were handled by weighting according to the Frangakis and Rubin approach19 to account for the increased HR between patients who were lost to follow-up versus those retained in care and under observation (see online supplementary appendix for further details of the modelling approach and the code used for model fitting).
Results
This study encompasses five IeDEA regional cohorts from East, Southern and West Africa, Asia Pacific and Latin America. A total of 122 925 adult HIV-infected patients aged 15 years or older were included. From East Africa, the USAID-AMPATH cohort provided data from 32 217 adult patients while in the Southern Africa region, data from 48 046 patients were included from nine care and treatment cohorts in the Republic of South Africa. The West Africa IeDEA regional cohort was comprised of 15 cohorts from Benin, Côte d'Ivoire, Senegal, Gambia, Mali and Nigeria and contributed a total of 33 005 patients. The Asia Pacific regional cohort contributed 6106 patients from 13 countries including Cambodia, China, Hong Kong, Japan, India, Indonesia, Malaysia, the Philippines, Singapore, South Korea, Taiwan, Thailand and Vietnam. The regional cohort from Latin America contributed 3551 patients from Argentina, Brazil and Mexico.
The most commonly used first-line ART regimen in Kenya and South Africa is Stavudine (D4T) and Lamivudine (3TC) with either Nevirapine (NVP) or Efavirez (EFV). In Latin America, the most frequent combination is Zidovudine (AZT), 3TC and EFV. The second most common drug combination is Tenofovir (TDF) with Emtricitabine and EFV. In the Asia Pacific region, among developing countries, first-line therapy usually amounts to a combination of AZT or D4T plus 3TC with NVP or EFV, often as a generic drug similar to Africa, with a slow recent move towards TDF. In the developed countries (Japan, Hong Kong, Taiwan, Korea), first-line therapy would be a triple combination including an non-nucleoside reverse-transcriptase inhibitor or a protease inhibitor as in Europe, North America and Australia.
Baseline characteristics
A listing of the cohorts and the overall number of patients by gender and age category is given in table 1. The first impression from this table is that, while the epidemic in Africa is rather homogeneous and affects women in a roughly 2:1 ratio compared with men, the reverse is true in the Asia Pacific and Latin America where the epidemic is driven primarily by men. Loss-to-follow-up rates were high in all African cohorts (table 2). Annualized rates of loss to follow-up were over 20% during the first 6 months after ART initiation in the East and Southern Africa cohorts, with annualized rates of loss staying close to 10% during the second 6 months and stabilizing at that level thereafter. Losses to follow-up were almost double in West African cohorts, with annualized rates over 35% during the first 6 months after treatment initiation and remaining above 20% thereafter. Losses to follow-up were much lower in the Asia Pacific and Latin American cohorts, where annualized rates were 8% and just over 10% for patients after starting ART. These observations will be useful later when speculating about the applicability to these regions the results derived from cohorts in sub-Saharan Africa.
Number of patients by gender and age category
Loss to follow-up rates in the five regions involved in the analyses
The distribution of CD4 count at ART initiation by gender and region is shown in figure 1. As it is widely reported,7 ,40 women have higher CD4 counts at the time of ART initiation, the result of both early detection as well as complex healthcare access differences between the sexes, particularly in resource-limited settings.

Distribution of CD4 counts at antiretroviral therapy initiation in the Kenya, South Africa, West Africa, Asia Pacific and Latin America cohorts. Statistics for men are shown on the left and women on the right.
Estimates of mortality
In the next subsection, we summarise the results from the two cohorts with available data on patient outreach (Kenya) and vital registry linkages (South Africa) as these data are amenable to mathematical adjustment of the mortality estimates. We proceed with a summary of the mortality estimates in the remaining three cohorts in the following subsection.
The Kenyan and South African cohorts
Mortality was estimated as described in the Methods Section at the critical first 6 months after the start of ART, 6–12, 12–24 and >24 months. Adjustments were based on 2409 successful outreach encounters in the Kenya cohort, out of 7252 patients who were lost to follow-up and 4602 individuals successfully linked out of 9167 persons who were lost to follow-up in the South African cohort. The adjusted estimates of mortality by age and CD4 category for male and female subjects are given in figure 2 for the Kenyan and South African cohorts. The immediate impression upon inspection of these figures is the high death rates in the first 6 months after initiation of ART and the significant reduction of these rates during subsequent periods. In order to appreciate the impact of the adjustments from information obtained through patient outreach (Kenya) and vital records (South Africa), we provide the correction factors defined as the ratios of the adjusted to the unadjusted death rates in each age, gender and CD4 category. These data are presented in figure 3. The implication of the results, as shown in figure 3, is that the adjustment of the death rates is both substantial and variable among genders, age groups, CD4 categories as well as cohorts. A major difference between the Kenyan and South African cohort is that, in the Kenyan cohort, the adjustments are the highest particularly during the first 6 months after ART initiation when they can reach 60%. Correction factors are even higher among South African cohorts where adjustments are almost 70% during the first 6-month period. In subsequent periods, the adjustments are even higher, sometimes over 100%, but their absolute effect is limited due to the low death rates during these periods. In the South African cohort, the highest adjustments involve the highest CD4 category (above 500 cells/μl). This suggests a possibly unique mortality pattern for this group.

Adjusted estimates of mortality by age, gender and CD4 count antiretroviral therapy (ART) initiation in the Kenyan and South African cohorts.
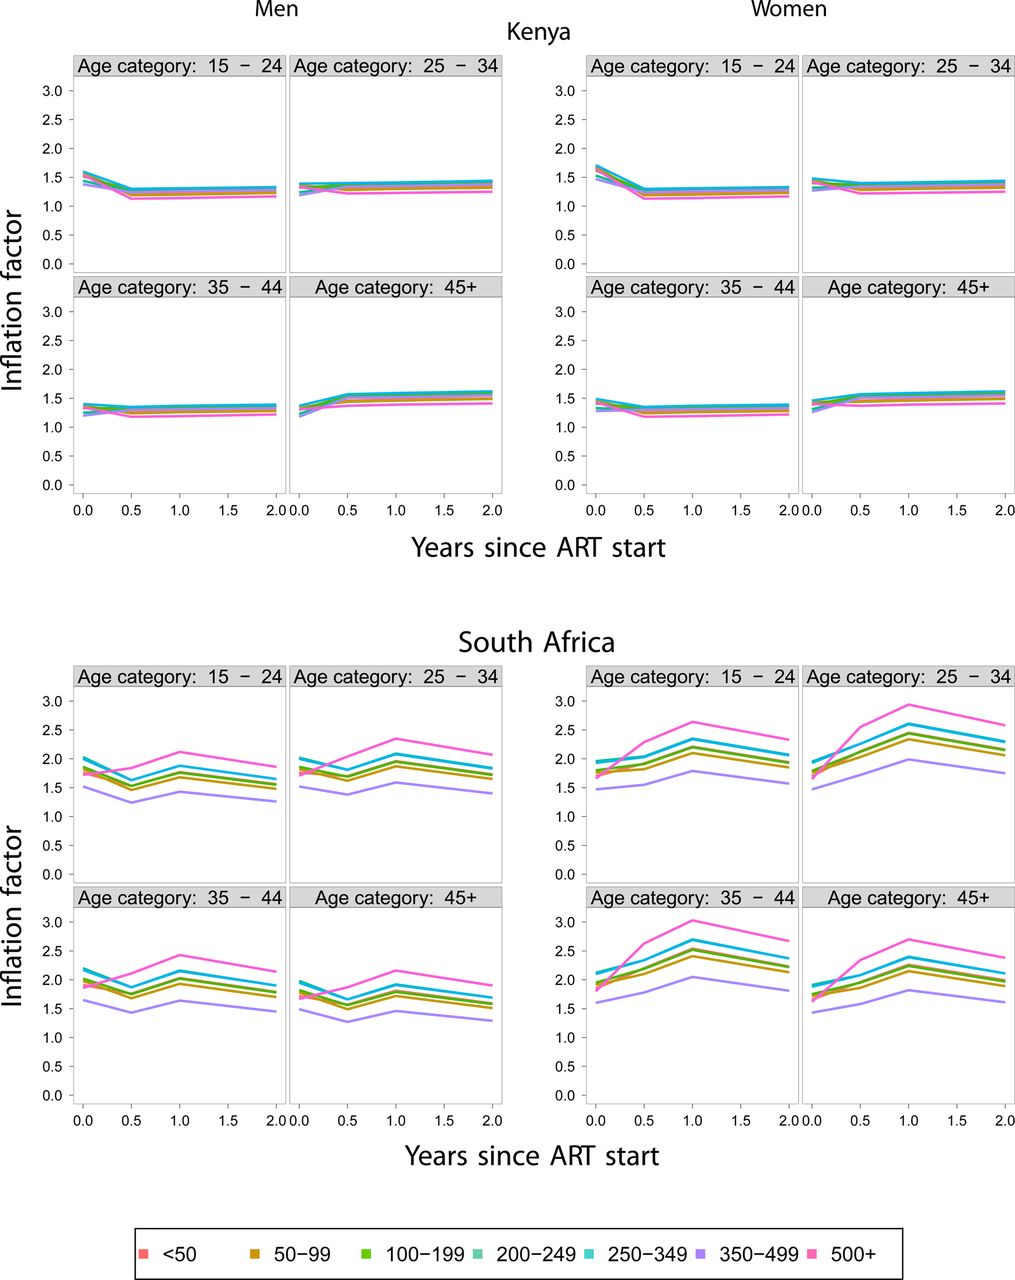
Correction factors for mortality estimates derived from the Kenya and South Africa cohort data. ART, antiretroviral therapy.
The West African, Asia Pacific and Latin American cohorts
As mentioned in the Mathematical models section, many cohorts considered for this analysis have no outreach of patients and thus adjustments of patient mortality are impossible. We borrowed from the idea underlying the nomogram approach published by Egger and colleagues31 but adjusted it to fit the needs of the current project. The nomogram approach considers the inverse relationship between the size of lost to follow-up (LTFU) and per cent of LTFU patients who are dead in order to extrapolate the correct (but unknown) death rate among patients who drop out from care. In the original paper by Egger and colleagues, estimates of 1-year mortality after initiating ART were produced.31 However, here, we want to estimate mortality at 0–6, 7–12, 13–24 and >24 months from ART initiation in a large number of groups, where we cannot reasonably assume that the same correction factor holds. Thus, we used, as an estimate of the correction factor between LTFU patients and patients under observation in the paper by Egger and colleagues, the ratio of adjusted and crude death rates estimated in the East African (not shown) and South African cohorts for all the subgroups (defined by gender, CD4 and age categories) considered in the current analyses (figure 3). The choice of the adjustment based on the South African data is justified further in the Discussion section. The revised estimates of mortality are shown in figure 4. In all cases, even though the highest death rates occur during the first 6 months after therapy initiation, estimated death rates are lower than in Kenya and South Africa. West Africa has the highest rates among these three regions, Latin America is in the middle and Asia Pacific has the lowest death rates among all regions considered.

Adjusted death rates among men (left) and women (right panels) in West Africa, Asia Pacific and Latin America. ART, antiretroviral therapy.
Discussion
This study summarises data from five regional consortia, three in sub-Saharan Africa, one in Latin America and one in the Asia Pacific region. As expected, the estimated death rates are the highest in sub-Saharan Africa, with moderately high rates in Latin America and low rates in Asia Pacific. As is widely published, use of outreach information and linkages with vital registries resulted in a substantial upward revision of all mortality estimates, particularly during the early months after initiation of ART.16 ,17 ,19 ,24
With respect to CD4 count at the start of therapy, the results are consistent with expectation. Patients who start therapy at lower CD4 counts, particularly <100 cells/μl, have significantly higher death rates compared with those starting at CD4 counts above 100 cells/μl. Men also have higher estimated mortality in all strata identified by gender, age and CD4 counts. A consistent trend emerges with regard to age as well. Mortality is highest among the 15–24 age group and the over-45 group and relatively lower in the other two groups.
Mortality adjustments did not change the overall trend of mortality. However, the magnitude of the revision was such as to significantly undermine the veracity of published estimates generated in a similar context but without the benefit of patient outreach or linkage to vital registries. This observation underlines the need of both the availability of post-dropout vital status information and the usefulness of mathematical adjustment methods to generate as accurate mortality estimates as possible. While mortality was, overall, lower in the highest CD4 group (>500 cells/μl), the adjustments in this category were the highest in the Southern Africa group. This suggests a separate mortality pattern in patients starting ART with higher CD4 counts, a not unsurprising result given that ART is initiated in these patients only when there is evidence of serious health problems. At the very least, this observation implies that current estimates of response to therapy (including mortality) cannot be used to predict what the impact of initiating ART at higher CD4 counts will be as advocated in newer treatment guidelines.
When outreach data are not available, our options are limited with regard to generating valid adjustments of mortality from passive recording of vital status information. Adjusting the analyses by incorporating predictive factors collected prior to dropout is not expected to work as the loss to follow-up is informative41 (ie, it is related to the likelihood of the outcome even after adjusting for predictive factors that are commonly collected prior to dropping out). An alternative is to exploit the inverse relationship between the levels of dropout and the relative hazard between dropouts and non-drop outs31 to impute the rate among individuals who are not retained in care. However, this approach requires significant contextual knowledge about the programme and may thus be questionable particularly in settings where high dropout is not associated with rapid scale-up and/or there are limited alternative care and treatment programmes in the area.24
To overcome this difficulty and derive mortality adjustments in the three regions without available patient outreach data (ie, the West Africa, Asia Pacific and Latin America regions), we used a hybrid method consistent with the approach in Brinkhof and colleagues29 rather than the nomogram approach proposed by Egger et al.31 Given the significant differences in the resulting adjustment when using the Kenya versus the South Africa correction factors, it is a valid question which of the two should be generally used. While, in absolute terms, the resulting mortality estimates were similar after employing either adjustment method, we ended up presenting the South Africa-derived correction in this manuscript. The reason for this is an idiosyncrasy of the Kenya cohort in which patients who have started ART more recently are followed particularly intensively compared with those who have been on treatment for longer periods.16 ,17 This may have resulted in an undersampling in patients with a longer follow-up and may be the reason for the diminishing adjustment levels during the time intervals past 6 months. By contrast, access to vital registries is expected to be virtually unchanged regardless of the duration of therapy. This speculation along with the fact that both adjustment methods produced virtually identical adjustment coefficients during the first 6 months from the start of therapy resulted in us choosing the South Africa correction factors to adjust the mortality estimates in regions outside East and Southern Africa.
The approach applied here has a number of limitations: It is not known whether adjustments developed in sub-Saharan Africa will be applicable in settings outside the continent, particularly in developed countries such as Japan, Hong Kong or Taiwan. For example, patients who are lost to follow-up in Buenos Aires, Argentina (a middle-income setting), tended to have better markers of health at antiretroviral initiation than patients who remained in care,42 which suggests that naive analyses could actually be overestimating death rates. In addition, rates of loss to follow-up are different between regions, something that the nomogram approach by Egger and colleagues31 takes into account but our adjustment method does not. With that said, without available tracing data it is impossible to really know what is happening to those who are lost from observation, and the adjustment methods outlined here represent at least a reasonable starting point given the potentially significant under-reporting of death rates even in middle- or high-income settings.
However, even within regions with available outreach data biases exist. In East Africa, mortality adjustments were based on patient tracing programmes which do not trace a random sample of the patients who were lost to follow-up19 but are imbedded into existing clinically-oriented patient outreach efforts.18 ,19 ,25 The fact that the patients to be traced are not identified in a random fashion and, in addition, not all sought after patients are successfully located, raises significant questions about the representativeness of the located subsample compared with the overall group of patients lost from observations. The South African vital registry linkage methods are also subject to this bias. Thus, the accuracy of the adjusted estimates is put into question, particularly in light of reports where the hardest to locate patients are also those at the highest risk strata.18 In the analyses presented in this paper we made the (largely untestable) assumption that the patients who are successfully located, either through physical outreach or successful linkage with the vital registry, do not differ systematically from those who are not and can thus be regarded as a random sample of all patients who are lost to follow-up.
A final consideration is the degree of confidence that one should attach to these results. We would expect that the adjustments produced in the Kenya and South African cohorts would be fairly accurate, particularly in the first 6 months from treatment initiation, given the enormity of the available data, which ensures that the mathematical properties of the models (ie, their ‘asymptotics’) would be fulfilled. Confidence in the mortality estimates would be decreasing in the case of West Africa and, even further, in the Latin America and Asia Pacific regions, which include highly variable epidemics. In particular, the better survival seen in the Asian data, which includes both developed and developing countries, should not be overinterpreted. The cohorts which comprise these data are not national treatment programmes, and survival in these relatively small numbers of patients in individual countries should probably not be extrapolated to survival outcomes across the entire region. For example, data from the China National Free Antiretroviral Treatment Program show survival more similar to outcomes in Africa.43 The survival seen in the Asia data in this paper is perhaps better interpreted as indicative of what can be achieved in well resourced individual treatment sites.
The overall conclusion of this manuscript is thus twofold: From a clinical perspective, we continue to observe a large number of patients start therapy at very low CD4 counts, even in middle- and high-income settings, and these patients experience high levels of mortality particularly during the first 6-month period from treatment initiation. With this realisation, it is imperative to increase efforts to identify these patients and bring them to care. From an epidemiological and public-health perspective, patient outreach and vital linkage methods should be considered for inclusion in all HIV care and treatment programmes because of the strong association between loss to follow-up with adverse clinical outcomes and the resulting potentially significant underestimation of mortality.
Main findings
-
Despite advances in antiretroviral treatment coverage, many patients start treatment at very low CD4 counts and experience significant mortality during the first 6 months after treatment initiation.
-
Active patient tracing and linkage with vital registries are critical for deriving accurate estimates of mortality, particularly in low- and middle-income settings.
-
In addition to the youngest patients, older patients have high death rates. With extended survival due to the expansion of ART coverage and the resulting ageing of the HIV/AIDS population, the impact of age on mortality needs to be considered in decision and policy making.
Acknowledgments
We are grateful to all patients, care givers and data managers involved in the participating cohorts and treatment programmes. This work was supported by a contract provided by the Joint United Nations Programme on HIV/AIDS (UNAIDS). Individuals involved in the functioning of the programmes providing data to this study are provided in the Supplementary file online (http://dx.doi.org/10.1136/sextrans-2012-050658).
References
Supplementary materials
Supplementary Data
This web only file has been produced by the BMJ Publishing Group from an electronic file supplied by the author(s) and has not been edited for content.
Files in this Data Supplement:
- Data supplement 1 - Online supplement
- Data supplement 2 - Online appendix
Footnotes
-
Funding This work was supported by UNAIDS through a grant to CTY, BSM, LFJ, AB, TG, EB and ME. In addition, the data collection was funded by the NIH National Institute of Allergies and infectious Diseases (NIAID), through grants AI069911 (East Africa), 2U01AI069924 (Southern Africa), AI069919 (West Africa), AI069907 (Asia Pacific) and AI069923 (Latin America).
-
Competing interests None.
-
Ethics approval Secondary analysis of anonymous primary clinical data.
-
Provenance and peer review Commissioned; externally peer reviewed.
Open Access This is an Open Access article distributed in accordance with the Creative Commons Attribution Non Commercial (CC BY-NC 3.0) license, which permits others to distribute, remix, adapt, build upon this work non-commercially, and license their derivative works on different terms, provided the original work is properly cited and the use is non-commercial. See: http://creativecommons.org/licenses/by-nc/3.0/