Article Text

Abstract
In developing appropriate interventions to control sexually transmitted infections (STIs) it is important to understand the distribution of infections, and how this distribution is influenced by the dynamic nature of epidemics. The epidemiology of STIs has been described as a series of phases, which loosely positions a population within the history of an epidemic. The relation between a mathematical theory describing STI epidemiology and the taxonomy of “phases” is explored in this review of the transmission dynamics of STIs. The likelihood of spread and persistence of infection depends upon the basic reproductive number, whereas the endemic prevalence of infection depends upon the way in which heterogeneity in risk focuses the density dependent constraints limiting the spread of infection. All interventions aimed at reducing the prevalence and incidence of infection must act through the reproductive number. The key parameters determining the reproductive number and the relevance of risk behaviours depend upon the biology of the particular infection. The division between high transmission probability, short duration infections and low transmission probability, long duration infections is explored.
- sexually transmitted diseases
- epidemiology
Statistics from Altmetric.com
A n epidemic is a dynamic process, over the course of which patterns of infection and influential variables alter. To facilitate thinking and discussion about appropriate interventions, the shifting patterns of infections have been classified as “phases”.1 Under this taxonomy, phase I is the growth period, as invasion of the host population occurs; phase II is a hyperendemic phase, where there is an absence of controls; phase III is a decline phase, when controls start to have an effect; phase IV is an endemic phase—a steady state when controls are in place; finally, phase V is when elimination, but not necessarily eradication, is possible. The relation between epidemiological variables and these phases is the subject of this paper. In particular, how the biology of an infection can influence the phases is discussed and illustrated with reference to gonorrhoea and herpes simplex virus type 2 (HSV-2).
A fundamental parameter determining the success of any organism is the basic reproductive number, R0, which, in the case of an STI, measures the potential for spread of infection and is defined as the number of new infections caused on average when an infection enters an entirely susceptible population.2 Two things are worth noting from this definition. First, it is an average value that can change from population to population, or over time, depending upon the patterns of contact or biological influences at play. Second, the subscript zero refers to the time at the start—that is, when invasion occurs. As the infection spreads, the population is no longer entirely susceptible so contacts are wasted on those infected or immune, and the reproductive number is reduced to an effective reproductive number, Rt.
INVASION AND PERSISTENCE (PHASES I AND V)
Apart from the potential role of acquired immunity, the factors influencing invasion are similar to those influencing persistence. Whether an infection leads to another generation of infections or disappears is subject to chance. When there is one infection in the population, then the probability of infection disappearing is the probability that that infection is cured, resolves, or the host dies, divided by the probability that a new infection is generated. This can be thought of in terms of the reproductive number, because the reproductive number is the ratio of “births” of new infections to the “deaths” of old infections. Thus the chance of elimination is the inverse of the effective reproductive number. Likewise, the chance of an infection failing to invade a susceptible population is the inverse of the basic reproductive number. Obviously, the probability of infection persisting is 1 minus this value. When taking chance into account the larger the basic reproductive number the more likely an epidemic is, and the more infections there are the less chance there is of elimination. The probability of persistence or spread, p, over the next generation is given by: where n is the number of infections and Rt equals R0 when there is no immunity or previous infections within the population.3 The distribution of risk behaviours and sexual network structures determines the value of the reproductive number; hence they have a role in determining the likelihood of an epidemic. All the details of the sex partner network and the complexities of an infectious biology are, de facto, included in the actual value of the reproductive number, but they may not be included in our estimates of that value. Whether theoretical descriptions of STD epidemiology include particular details may depend upon the goals of theory, which could best be served by making simplifying assumptions, or may be constrained by limitations in our ability to measure and understand relevant factors.
The basic reproductive number is determined by three main components, the duration of infectiousness, the pattern of contacts, and the likelihood of transmission should there be a contact. Estimates based on combined measures of these three are likely to be inaccurate. An alternative is to measure the basic reproductive number directly, as the rate of invasion depends on the number of new infections each infection causes in the next generation—that is, the reproductive number and the length of time it takes to cause the new infection. However, the overlap between generations, and the speed with which “pre-emptive” infections and immunity occur within small scale sex partner networks, will also limit the accuracy of direct measurement of the basic reproductive number.
The basic reproductive number is an average value for infections within a population, which is influenced by heterogeneity in patterns of risk. Heterogeneity influences the potential number of new infections any individual will cause when they are infected. For sexually transmitted diseases a small fraction of the population may cause a large number of new infections, which greatly increases the basic reproductive number above what it would be if everyone had the same average behaviour, and hence increases the chances of infection spreading quickly or persisting within a population.
Elimination is the local removal of an infection. In terms of maintaining a control effort this is very different from eradication (the global elimination of infection) as reinvasion is always possible.4 Eventually, the chances of reinvasion will depend upon the basic reproductive number, but initially, any residual acquired immunity to infection would lower the effective reproductive number. Thus, as the period of elimination lengthens and concomitantly the presence of immunity wanes, then the risk of reinvasion will increase. To counteract this increasing risk, the quality of surveillance, services, and prevention work should be improved rather than following the natural trend to relax vigilance.
THE TRANSIENT AND STEADY STATE PREVALENCE OF INFECTION (PHASE II)
If an epidemic does invade, then the reproductive number is reduced until it falls to 1 or to less than 1. Whether or not infection peaks, causes oscillations, or monotonically rises to a plateau depends greatly on the consequences of infection. If the infection leads to death then the level of risk in the population is likely to decline, and steady state prevalence will be less than peak prevalence. If the infection causes acquired immunity on recovery, then susceptible individuals can be “used up”. The steady, slow resupply of susceptible individuals through recruitment of new persons to the sexually active population can cause booms and busts in the incidence of infection. Alternatively, an infection where recovery allows an individual to be reinfected will have a very rapid resupply of susceptible people and is likely to have a monotonic rise to a stable prevalence. Acquired immunity and oscillations do not seem typical of STDs, perhaps because they would be unable to persist in the face of substantial immunity. In the case of childhood infections, the seasonal and interepidemic troughs make the infection vulnerable to stochastic fade out because there will be times when there are very small numbers of infections, which could die off by chance.5 In childhood infections, the at-risk population is sufficiently large for the birth rate to supply susceptible individuals quickly enough to maintain infection. In STDs the rate of recruitment to the relatively small high risk population (that is, those who have enough contacts to propagate infection) has probably excluded infections with a short duration that generate acquired immunity. Therefore, for sexually transmitted infections the pattern seems to be either a monotonic increase, or a peak followed by a decline to a steady state. The time during the epidemic where there is a transition from a reproductive number of greater than 1 to a value less than 1 depends upon the duration of infection. The pattern illustrated in fig 1 would be for an infection with a long duration relative to the time scale of the epidemic.

The course of an epidemic in a homogeneous population. The schematic illustration shows the initial growth and decline of an epidemic, as measured by the prevalence of infection, and the related values of the reproductive number, Rt, which initially equals the basic reproductive number, R0. For the endemic steady state the reproductive number is 1, which is only possible if there is a steady supply of new susceptible individuals. If there is no resupply of susceptible individuals, infection will certainly die out. Additionally, if the replenishment of the susceptible pool is slow infection may die out by chance.
The peak prevalence and endemic prevalence are controlled by either immunity to infection or “pre-emptive” infection within the community. This density dependent constraint on the reproductive number reduces its value from the basic reproductive number, and the strength of the constraint required to reduce it to 1 depends on the initial value. In a homogeneous population it is simple to relate the endemic prevalence of infection to the basic reproductive number because: where x is the fraction of the population susceptible to infection. At the endemic steady state, each case of infection causes one more new case of infection so Rt = 1. Hence x*, the steady state proportion of the population susceptible to infection, is simply equal to 1/R0. As people are either susceptible, infected, or immune to an infection, then knowing the proportion of the population susceptible tells us the prevalence of infection and immunity. This simple theory is clearly inadequate for sexually transmitted diseases. Heterogeneity in the pattern of risk means that infection will saturate at a low prevalence in the entire population, but at a high prevalence in those with a high risk of acquiring and transmitting infection.6 While heterogeneity increases the rate of growth of an epidemic, it decreases the eventual prevalence of infection. Likewise, the pattern of sexual mixing—that is, how likely those with many sexual partners are to have sex with others with many sexual partners7—or sexual partner network cohesion8 will have a different influence on the likelihood of infection spreading and on the eventual prevalence. The more tightly connected those with many partners are, as measured by “mixing” or network structure, the more likely an infection will be to persist but the less widespread it will become.
In the discussion of heterogeneity of risk and the variables influential in controlling the epidemiological pattern of infection, various levels of detail have been referred to. One can think schematically about the level of detail that is significant in STD epidemiology (fig 2). As the study of STD epidemiology has progressed, attention has moved from simple average measures to exploring variation in behaviour and to looking at network structures.9 Studies clearly show that all these levels of detail are significant in understanding STD epidemiology.8, 10, 11 However, as we move from left to right there are increasing costs both for collecting and interpreting data describing the patterns of behaviour. In surveys it has been possible to elicit what appear to be reliable reports of risk behaviour, so that the mean and variance of variables such as the number of sex partners can be derived.12, 13 Because interviewees may be unwilling or unable to give detailed information about their sex partners, it is harder to derive estimates of sex partner characteristics and behaviour from surveys of individuals. However, a crude picture of patterns of sexual partner choice has been derived from some behavioural studies.14–16 In a few locations detailed studies using partner notification or snowball sampling of acquaintances and sexual partnerships have described detailed sex partner network structures.17, 18 However, the interpretation of such data is far from simple. The studies give a biased sample of the complete sexual partner network, but if STDs are a point of entry for data collection, they probably explore the network structures that are significant for the spread of infection.8 If certain relationships remain undisclosed or partners are not traced in the sampling process, this can further bias the results, particularly if—as seems likely—the characteristics of undisclosed partners are not arbitrary.19 Furthermore, there is no consensus about the key variables that influence the invasion and endemic prevalence of STDs. Early work on small simulated networks does suggest that the network structures which significantly influence persistence, such as the proportion of mutually non-monogamous pairs, are not those that are most significant in determining prevalence.8 However, such analyses could usefully be repeated with larger simulated populations and a more extensive range of statistics describing the network structure.

The increasing level of detail for measurement of the contact structure along which sexually transmitted infections can spread. The aggregate level of risk behaviour is the most straightforward measure, but variation in behaviours, network structure and the intensity of the contact (that is, the frequency and type of sex) all play a role. It is assumed here that the most extreme level of complexity is an understanding of the factors controlling the patterns of sexual contact. All behaviours are socially and culturally embedded, and the sexual partner network is nested within a social network.
THE IMPACT OF INTERVENTIONS (PHASES III AND IV)
The scale of any transition between an uncontrolled (phase II) and controlled (phase IV) steady state depends upon the coverage and effectiveness of interventions. The time taken to achieve such a transition depends upon the speed with which interventions are adopted and the rate at which an infection's incidence and prevalence can respond. The prevalence of an infection that is long lived and incurable, like HSV-2, cannot be reduced as rapidly as an infection like trichonomiasis, which is readily cured.
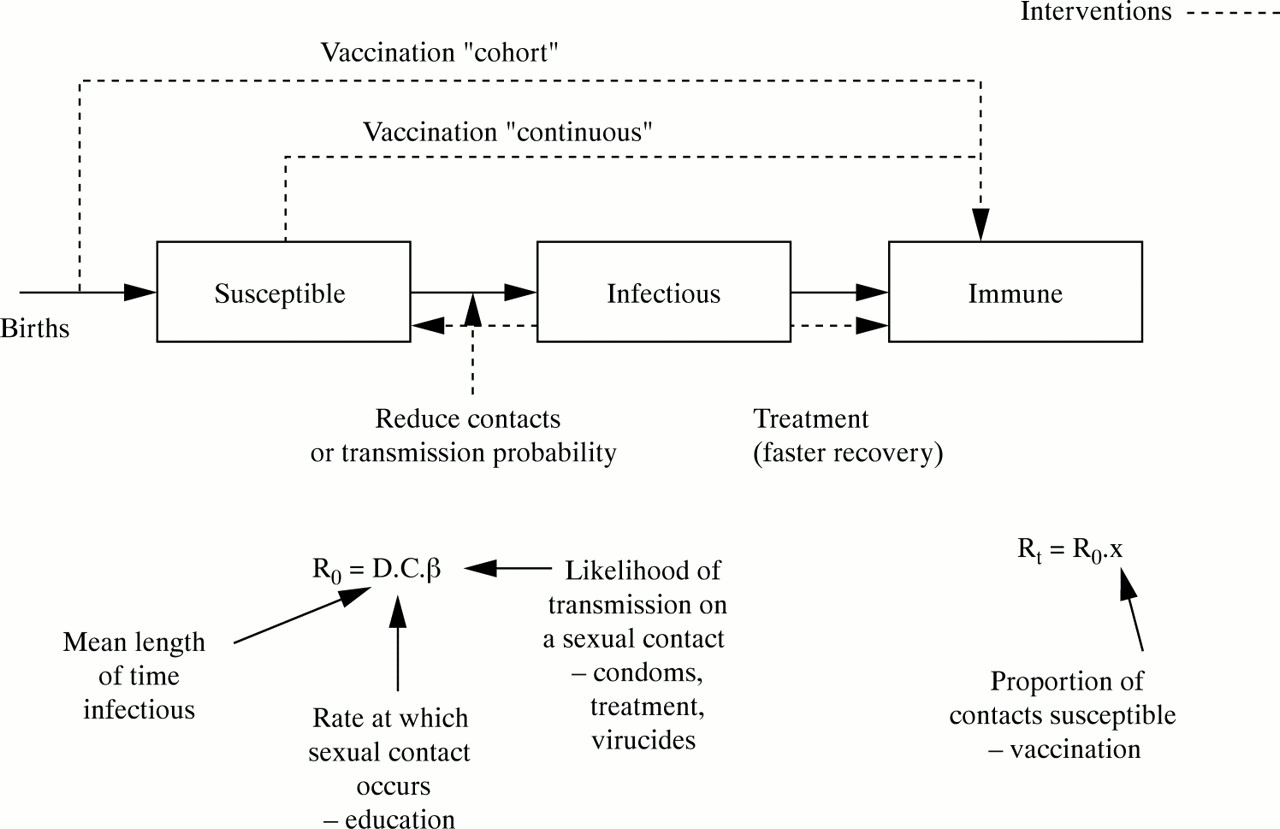
Any intervention aimed at reducing the prevalence and incidence of an infectious disease (as opposed to alleviating the symptoms and consequences of disease) acts through the reproductive number. It is hoped that the “output”, or effort expended in intervening, generates an “outcome”, which is a change in the parameter values influencing the reproductive number, and the “impact” of the intervention is how much the alteration of these proximate determinants influences the incidence of infections. So, for example, the output of an intervention promoting condoms may be the number of condoms distributed, the outcome the number of condoms used; and the impact may be the change in STD incidence achieved by reducing the risks of transmission. The limited number of outcome targets for an intervention is illustrated in fig 3. Treatment can be used to speed up the resolution of infections, shortening the mean duration of infectiousness. Strategies can be used to reduce the frequency of contacts within a population—for example, education to reduce numbers of partners, or disincentives to the commercial sex industry. Condoms or other products can block the risks of transmission. These all work on the basic reproductive number, and their impact increases as its value approaches 1. Vaccination moves people from being susceptible to being immune, reducing the effective reproductive number. The impact of increased vaccine efficacy or coverage is a more linear decline in incidence.

A schematic illustration of a susceptible, infected, immune model of a sexually transmitted infection which identifies the points at which interventions can operate. The same interventions alter components of the basic or effective reproductive number.
THE INFLUENCE OF DIFFERENT NATURAL HISTORIES
Apart from differences in pathology and alternative transmission routes, key differences between sexually transmitted diseases are their transmission probabilities, their durations of infectiousness, and the existence of acquired immunity. These can obviously be influenced by whether the infections cause disease symptoms (for example, symptoms related to an immune response may assist in clearing infection and hence reduce the duration of infection, or may be related to infectious load and alter the transmission probability of infection20, 21), but are also influenced by the niche for which the infection has evolved. Because there is a trade off between duration of infection and transmission probability, two evolutionary pathways appear to be possible for infectious organisms. They can either maximise the likelihood of transmission occurring on a contact, or maximise the duration of infectiousness.2 Thus we can group infections as low transmission probability/long duration, or high transmission probability/short duration. The characteristics of HSV-2 and Neisseria gonorrhoeae provide good examples of the two extremes. HSV-2 may or may not cause primary disease, with the likelihood depending on whether or not previous HSV-1 infection has occurred.22 Regardless of initial disease, the virus becomes dormant in the dorsal root ganglia of the host, from where it can migrate to cause disease recurrences and asymptomatic viral shedding.23 Gradually, over the course of many years, the frequency of disease and viral shedding episodes declines. However, available data are better able to describe the early pattern of decline in disease episodes as opposed to the longer term trends.24 For both symptomatic and asymptomatic shedding the transmission probability for each sex act is low.25 Dynamically, this natural history will generate slow epidemics, which will increase monotonically to a high prevalence. Because people remain infectious for life rather than recovering to immunity, prevalence will plateau and remain relatively stable. However, the most serious consequence of HSV-2 infection is neonatal herpes, which is most likely to occur when a woman acquires infection close to giving birth.26 Because disease is most closely associated with incident infection there will be a peak incidence of HSV-2 disease followed by a decline to a lower steady state level. Further declines in prevalence and incidence brought about by interventions will inevitably be slow.
Unlike herpes, infections with gonorrhoea are short lived, particular when symptomatic infections are treated.20, 27 Unfortunately, estimates of the duration of untreated gonorrhoea are unreliable, but it is not possible to improve them because of the need to treat those found to be infected. The six month duration of gonorrhoea quoted in the mathematical modelling literature is derived from an estimate of the fraction of infections that remain asymptomatic, and the relative prevalence of asymptomatic and symptomatic infections in the population screened for infection.28 In contrast to the poor estimates of the duration of infection, studies among personnel on aircraft carriers29 and careful partner tracing studies30 have shown that the transmission probability per sex act for gonorrhoea is high—around 0.25 from women to men and 0.5 from men to women—and that the probability of transmission per sexual partnership saturates rapidly to near 1 as the number of sex acts allowing exposure increases. In an era of treatment we can expect gonorrhoea to struggle to persist, and for there to be transient epidemics of gonorrrhoea strains in local populations.31 These will be rapid, but only if they are driven by substantial high risk groups and poor access to care will they become large scale. Because gonorrhoea does not appear to generate acquired immunity except in those exposed most frequently,32, 33 there is a rapid resupply of susceptible individuals, allowing its prevalence to stabilise quickly when poorly controlled.
When gonorrhoea is well controlled two factors are likely to contribute to its persistence. First, a high risk core group could provide a reservoir for infection that is hard for interventions to access. Second, the movement of infections between populations may allow their continual reintroduction locally. In either case, should controls be relaxed a high transmission infection like gonorrhoea will bounce back much faster than a low transmission, long duration infection.28 This makes the idea of periodic screening or presumptive treatment much less appealing, as the programme would have to be very frequent to interrupt the re-emergence of infections.
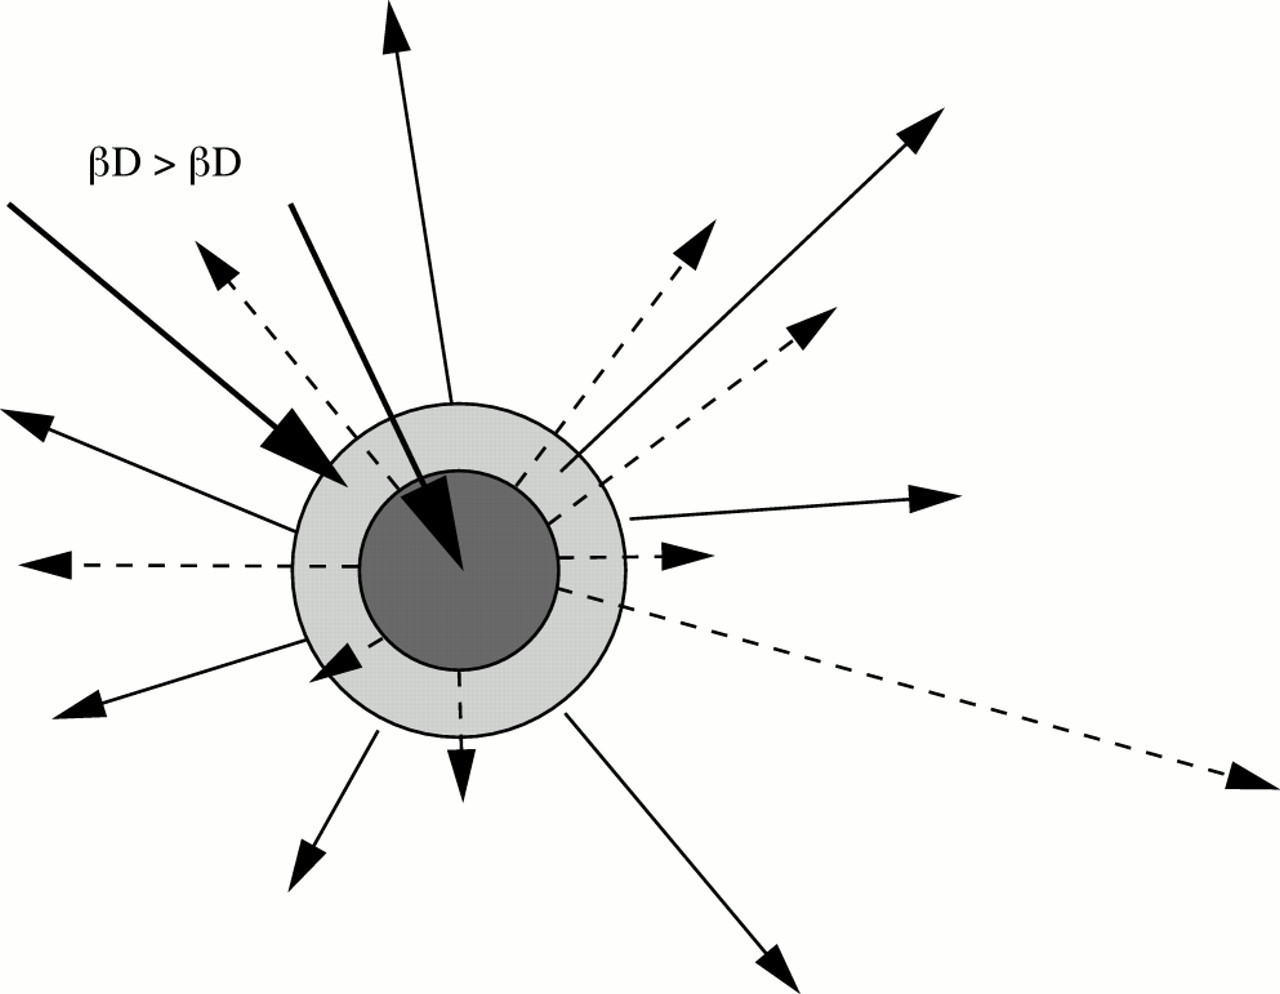
In addition, in response to different epidemic patterns the behaviours responsible for the ongoing transmission of HSV-2 and gonorrhoea are probably different. A simple conceptual model of the core group for different STDs would be concentric circles, where an infection with a higher combined per-partnership transmission probability and duration of infectiousness would be expect to have a larger core group (fig 4). Improved interventions, reducing the transmission probability or duration of infectiousness would be expected to contract the size of the core group to those with the highest risk patterns of behaviour. However, this assumes that the risk behaviours determining the number of new cases caused by each case (that is, the effective reproductive numbers) are similar for different infections. For a short lived, high transmission probability infection, the number of sex partners is likely to be more important than the number of sex acts with each sex partner. Alternatively, in the case of a low transmission probability infection, with a long duration, then a moderate number of sex partners, with many acts with each partner, is likely to maximise the number of infections generated by an infected individual. Similarly, the importance of other variables describing sexual partner networks is likely to differ according to the biology of infection. A case in point is the number of concurrent partnerships as opposed to serially monogamous partnerships. Concurrent partnerships have two advantages for sexually transmitted diseases. First the ordering of sexual partnerships ceases to play a role in whether there is a pathway for STD transmission (although the ordering of sexual acts with “concurrent” partners starts to matter). Second, with concurrency (that is, with no waiting time between the dissolution of a partnership and a new partnership beginning) it is less likely that an infection has time to resolve before transmission occurs.10, 34 This latter advantage is much more significant for high transmission probability/short duration infection.

Concentric circles illustrating the relation between two “core groups” for infections with a different product for their transmission probability and duration of infectiousness. The arrows indicate that infection will spread beyond the core group so infection is not synonymous with being a part of the core. This model assumes the same determinants of individual risk for each STD (the impact of treatments or the relation between numbers of partners and durations of partnership may alter this).
CONCLUSIONS
The epidemiology and control of sexually transmitted infections can be understood in terms of a coherent and comprehensive theoretical framework relating proximate epidemiological variables to the incidence of infection. Central to this theory is the measure of epidemiological potential the reproductive number. The patterns of sexual behaviour and risk that influence the invasion and persistence of STDs are different from those most important in determining the endemic prevalence of infection. The basic reproductive number determines the likelihood and speed of epidemics, but how it is measured and what is assumed to influence its value determines how useful it is in describing an epidemic and its determinants. The scale of epidemics is a function of the basic reproductive number, but in the case of STDs the variation in risk behaviours means that infection saturates at a lower prevalence. The transmission probability and duration of infectiousness for a particular STD will determine its ability to spread through the dynamic sexual partner network that provides the contact pattern for STD spread and persistence.
The description of an epidemic in terms of phases provides another conceptual framework that is underpinned by this theoretical understanding of transmission dynamics. The categorisation of epidemiological pattern according to phases prompts consideration of the appropriate organisation of interventions and the ease with which intervention targets can be met, which depends upon the coverage and intensity required. It would be a mistake to interpret the general rules governing the shape of epidemics as invariant patterns of incidence, because the interaction between local populations and changing patterns of risk will inevitably lead to many fluctuations in incidence. Rather, the theoretical and conceptual frameworks facilitate the interpretation of events and the design of responses. What is, of course, missing from this theoretical discussion is the methods of altering the variables that influence the reproductive number. Treatments and vaccines are specific to particular infections, whereas behavioural change will cut across infections. Understanding how to mount effective interventions with a good coverage is a difficult and important task. However, the design of such interventions is likely to be improved with an understanding of key epidemiological goals.
Acknowledgments
I would like to thank the Royal Society for grant support.