Article Text

Abstract
Objectives This study reports on the results of a large-scale targeted condom social marketing campaign in and around areas where female sex workers are present. The paper also describes the method that was used for the routine monitoring of condom availability in these sites.
Methods The lot quality assurance sampling (LQAS) method was used for the assessment of the geographical coverage and quality of coverage of condoms in target areas in four states and along selected national highways in India, as part of Avahan, the India AIDS initiative.
Results A significant general increase in condom availability was observed in the intervention area between 2005 and 2008. High coverage rates were gradually achieved through an extensive network of pharmacies and particularly of non-traditional outlets, whereas traditional outlets were instrumental in providing large volumes of condoms.
Conclusion LQAS is seen as a valuable tool for the routine monitoring of the geographical coverage and of the quality of delivery systems of condoms and of health products and services in general. With a relatively small sample size, easy data collection procedures and simple analytical methods, it was possible to inform decision-makers regularly on progress towards coverage targets.
- Condoms
- control programmes
- HIV
- prevention
Statistics from Altmetric.com
Population Services International started a targeted HIV prevention programme in India in November 2004 as part of Avahan, the India AIDS initiative. The main objectives of the intervention are to increase consistent condom use by male clients of female sex workers (FSW) and to increase their treatment-seeking behaviour for sexually transmitted infections (STI). A major component of the project consists of providing adequate access to condoms among sex workers and their clients, ensuring that these high-risk groups have the opportunity to obtain condoms in ‘hotspot’ areas where commercial sex occurs or is negotiated—a strategy that has been shown to be effective for the reduction of HIV prevalence.1 This approach is complemented by the provision of STI treatment services and by an integrated behaviour change communication programme that uses multiple and overlapping media channels to deliver focused messages about consistent condom use, partner reduction and STI treatment.2
Availability and accessibility are key components to ensuring the use of a commodity along with acceptability and skills.3 As part of a large condom social marketing effort in four states in southern India and along national highways—covering nearly 200 000 sex workers and their clients4—we report on the results of our scale up and our efforts at monitoring condom availability, assessing geographical coverage and quality of coverage of condoms in target areas. The foundation of the condom social marketing programme was the establishment of a network of traditional and non-traditional condom outlets in and around areas where FSW are known to be present. These areas are important as they are frequented by clients of FSW, who constitute a significant bridge group for the spread of HIV and STI.5 National highways were included because truck drivers and their helpers are an important population category at risk of HIV in India.6 7
Throughout the project, the importance of using monitoring data on condom availability and on behavioural impact was recognised as being a key to success. Condom availability was measured through l lot quality assurance sampling (LQAS) surveys. Programme impact data on consistent condom use and its predictors among male clients of FSW were gathered through behavioural surveys, the results of which are reported in Lipovsek et al.8 LQAS is commonly used in health surveys, particularly for the evaluation of the coverage of immunisation campaigns, monitoring of product and service availability and increasingly the monitoring of sexual behaviour and of HIV/STI risk factors.9
Methods
Lot quality assurance sampling
LQAS is used for the monitoring of programme coverage indicators, based on a stratified simple random sample of a small number of geographical units per stratum, also called a ‘lot’. It is seen as a good alternative to more complex and often more costly sampling techniques.10 11 The method is particularly suitable for frequently conducted monitoring surveys on programme coverage and other performance indicators in settings that do not require a high level of statistical precision. It has been adopted by Population Services International (PSI) as the standard method for the monitoring of the coverage and quality of its social marketing product and service delivery systems.12 LQAS tests whether a given threshold value is achieved or not, rather than producing estimates for an indicator, although different ‘lots’ can be combined in order to estimate overall programme performance in terms of coverage.13
Minimum coverage and quality standards
Specific minimum standards of condom availability and quality were defined for each category of hotspot. Hotspots were defined as areas where there is a concentration of FSW and entertainment venues where commercial sex is either solicited or sold. Condom coverage, or ‘availability coverage’ as it is termed by the World Health Organization,14 was defined as the proportion of hotspot areas where condoms are available according to our predefined minimum standards. Standards were based on the field experience of programme managers and marketers and were adjusted to the relative size of hotspots: in category A hotspots (over 95 FSW), the minimum requirement was set at 15 outlets having condoms in order for it to be considered as being adequately covered, whereas category B hotspots (30–95 FSW) required a minimum of 10 condom outlets and category C required five outlets. Along the 15-km highway stretches, the minimum standard in the project states (Karnataka, Tamil Nadu, Maharashtra and Andhra Pradesh) was at least three condom outlets and at least five outlets for other states. The difference in minimum standards for these two categories of highways is a result of different levels of maturity of PSI's condom social marketing programme: before the initiation of the Avahan project, PSI had already established a wide condom distribution network along highways in the northern states, whereas at that time condom coverage along highways in the south was known to be low. The main underlying assumption for setting these coverage standards was that there is a need for a minimum number of outlets presently stocking condoms in order to provide the required number of condoms to cover all expected commercial sex acts within a hotspot.
Quality of coverage was defined as the proportion of hotspot areas where condoms are available according to the minimum coverage standards as defined above and when the outlets adhere to additional criteria of visibility (of condoms or of point-of-sale condom promotion materials), operating hours (outlet must be open up to at least 21:00 hours) and opening days (outlet must be open all days of the week). The visibility of the product and of promotion materials is believed to be a factor stimulating sales,15 16 whereas the second and third variables determine whether condoms are continuously available to customers and in particular when they are likely to be most needed (evenings and weekends). Late closing outlets are thought to be instrumental in providing access to condoms during the evening, when many commercial sex acts are negotiated.
Sampling
The survey was conducted in the four project states and along highways, with survey sites being selected through stratified random sampling. A listing of hotspots was stratified by state and by the type of hotspot area: sites with large, medium, or small numbers of FSW. The state of Maharashtra was divided into two separate zones, with Mumbai being separated from the rest of the state because of its large size and its high number of FSW sites in a dense urban setting. Coastal Andhra Pradesh was excluded as only inland districts are part of the PSI Avahan project area. In addition, we studied coverage along national highways 2–9 in northern states. Primary sampling units were the aforementioned hotspot areas and highway stretches. They were classified as category A (large number of FSW, numbering on average more than 95 FSW), category B (medium number of FSW; average 30–95), category C (small number of FSW; average less than 30) and highway stretches of 15 km.
The sample size was based on the upper and lower coverage levels that were to be detected through our surveys, set at 95% and 65%, respectively. With these parameters, a sample of 19 areas per stratum minimises provider and consumer errors, and provides an acceptable level of overall precision as detailed in the Analysis section. A simple random sample of 19 hotspot zones per category in each state was drawn for each round of data collection, resulting in 20 strata—also called ‘supervision areas’ in LQAS studies. The sampling frame was based on an initial list of hotspots that was made available by lead implementing partners from all project states in 2005 and which was subsequently updated during 2006–8 by PSI field staff in order to ensure the comprehensiveness and accuracy of the sampling frame. Maps from the National Highway Authority of India were the reference source for creating the highways sampling frame: the total length of all highways in each state was calculated, then divided into the 15 km sampling units. A new random sample was drawn for each survey round. Whenever there were less than 19 hotspots in a given category, or less than 19 highway stretches per state, all sampling units were visited, resulting in a census of the entire supervision area. The total sample comprised 351 sites in 2005, 352 in 2006, 342 in 2007 and 340 in the last round (2008), from a total of 1337 known hotspot areas and 5370 km of highways, the latter being divided into 358 15-km sampling units. The small variations in sample size stem from the adjustments to the sampling frame, because some hotspot areas disappeared or were newly identified over time.
Data collection
The coverage surveys were conducted in August 2005, July 2006, May 2007 and November 2008. In each selected hotspot area, eligible outlets were visited by data collectors. Eligible outlets included chemists (considered as traditional condom outlets) and a series of non-traditional outlets (locations historically not selling condoms): bars, restaurants (including small roadside food joints), hotels/lodges, paan shops (betel leaf stalls), fuel stations, tea/coffee shops and groceries (any type of retail outlet selling food items, household products and other basic consumer goods). A short questionnaire was administered to shop-keepers, collecting information on condom availability and visibility through direct observation and on operating hours and opening days as reported by respondents. Quality control during field work was done by supervisors who revisited outlets, verifying the accuracy of interviews and accompanying interviewers; no particular problems were reported.
In addition to the yearly coverage surveys, data on condom sales volumes were routinely collected from daily field sales reports, allowing programme managers to keep track of sales volumes and trends in outlet numbers continuously. Outlets are categorised as ‘active’ (outlets that stock condoms at least once a year), ‘new to category’ (outlets that previously did not sell condoms) and ‘traditional’ or ‘non-traditional’. The database contains detailed data on outlet-level sales volume that can be aggregated by the type or category of outlet, by the time period (eg, by month or by quarter) and by administrative area (district or state). Reported quantities are based on sales volumes to distributors and retail outlets.
Analysis
Data analysis is based on the LQAS decision rule table, which determines for each supervision area the proportion of units in which the minimum standards of coverage were met.17 Coverage benchmarks are used to identify which supervision areas do not reach a predetermined target level. In this case, the benchmark was the end-of-project target of 95% coverage across all supervision areas and for all monitoring rounds. In addition, average coverage rates by state, by type of hotspot and for the entire project area were calculated as weighted averages, with weights being the total number of hotspot areas or highway stretches in each supervision area. Tests on significance based on a comparison of means (t test) were performed on the mean coverage values. With a 95% coverage target and a 65% lower threshold for poor performing areas and a sample of 19, the provider probability of error (the risk that the survey classifies a supervision area as inadequately covered when in fact it is sufficiently covered) is 1%, and the consumer probability of error is 6%. This results in an overall error of 7%; at least 93% of the time, areas are correctly classified,18 a level that was deemed acceptable for decision-making purposes.
Results
Coverage
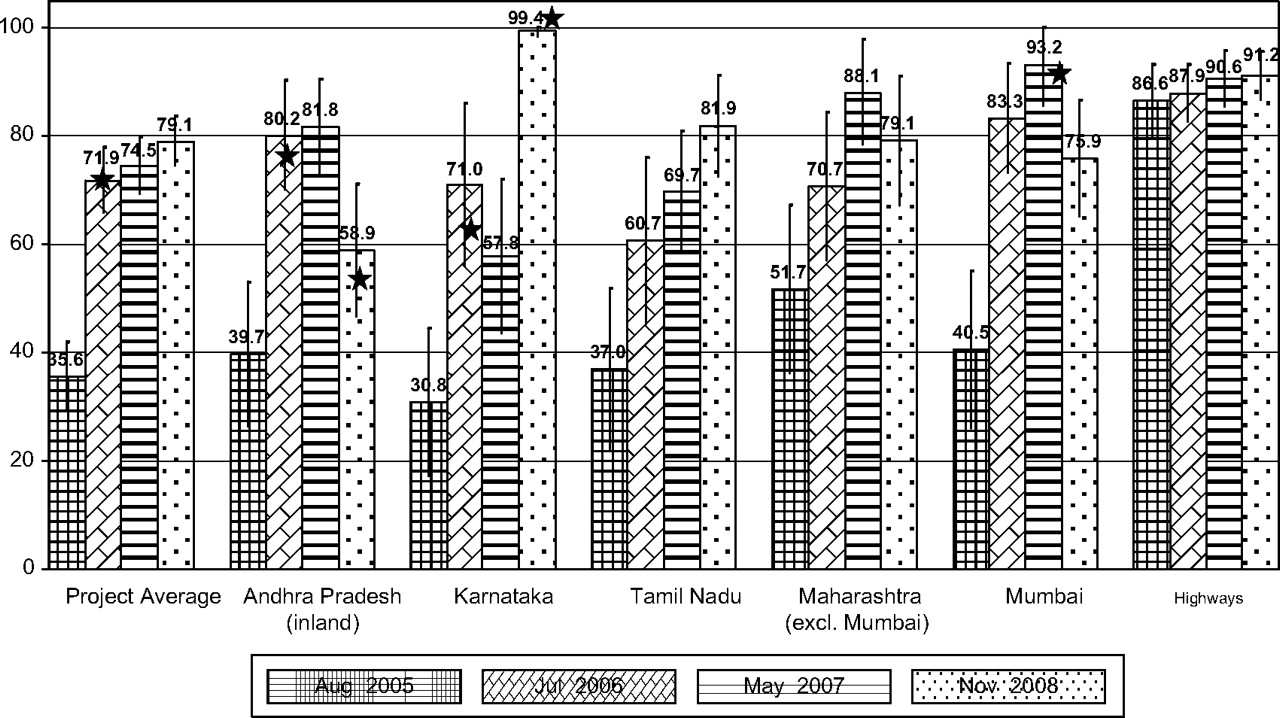
At the project level, a general increase in outlet coverage was observed for all supervision areas between 2005 and 2008; starting from a project-wide average outlet coverage rate of 35.6% (95% CI ±6.3) during the initial stages of the Avahan project, condom coverage increased to 79.1% (95% CI ±4.6) (figure 1). The main increase occurred during the early stages of the project (2005–6), when outlet coverage increased significantly across all states. The results of subsequent rounds were less consistent; between 2006 and 2007, Mumbai and the rest of Maharashtra each showed a significant increase in average condom coverage rates, whereas during the last round only Karnataka showed a significant increase, reaching near-universal outlet coverage according to our minimum standards. Overall coverage in interior districts of Andhra Pradesh and in Mumbai decreased during this time period. Condom coverage along highways in northern states has been high from the start of the project.

Percentage of hotspots that met minimum condom coverage standards, overall and by state and highway, 2005–8, using lot quality assurance sampling. (1) Stars (*) denote that results were significantly different from the previous round (p<0.05). (2) Coverage standards were defined by the size of the female sex worker population in the hotspot. See Methods section for details.
Detailed results (table 1) highlight different performance levels between supervision areas, with (+) and (−) signs indicating whether an area reached the 95% benchmark or not. Areas marked as (--) were considered to be performing poorly, being likely to have a coverage rate of under 65%. Over the course of the 4-year period, the number of positive results increases from just one supervision area in 2005 to eight in the last survey round, with three out of the five project areas reaching the coverage target in at least two supervision areas. This is the result of more efficient targeting by the local sales and distribution teams, who started using the increasingly accurate hotspot lists to identify priority areas. The table also summarises coverage trends for all four categories of hotspots, which largely follow the same evolution as the overall project average.
Results of LQAS test by supervision area and average condom coverage rates per hotspot category, 2005–8
Quality of coverage
The three quality standards were assessed in the same manner as the coverage results from table 1. Average state-level quality scores for each parameter are summarised for the last two survey rounds in table 2. In the most recent round Karnataka, Tamil Nadu and Maharashtra (excluding Mumbai) achieved the highest overall quality performance levels, whereas results for Mumbai and Andhra Pradesh were lower despite these being among the better performing states during the previous round.
Aggregated quality of coverage results by state and by quality standard, 2007–8
Sales volumes and outlet data
Based on internal sales monitoring data (table 3), from the start of the Avahan project up to October 2008, more than 102 million PSI-supported condoms were sold in the four states. Masti and Deluxe Nirodh brands were marketed across all states, except in Mumbai where Zaroor and Ustad were marketed under the programme. Deluxe Nirodh was also distributed through public health facilities. PSI's network comprises up to 86 000 active outlets in one single year. Over three-quarters of the condom sales were through traditional outlets. Non-traditional outlets represent just under half of all active sales points, but in many hotspot areas they are the only existing infrastructure that can be used to make condoms available. The increase in coverage between the first and second rounds (2005–6, figure 1) is likely to be linked to the establishment of a large number of ‘new to category’ outlets (newly established condom outlets) during this time period. A cumulative total of approximately 65 000 new outlets was created during the course of this first phase of the project.
Socially marketed condom sales volumes and outlet distribution in the project area, by 12-month period (November 2003 to October 2008)
Discussion
Findings from the monitoring surveys show that by the end of this first project phase condom availability in target areas was substantial, and that this high level of coverage was supported by a large underlying network of condom outlets, many of which adhere to PSI's quality standards. It is believed that coverage was largely achieved through the extensive network of non-traditional outlets, whereas traditional outlets were instrumental in providing large volumes of condoms. The fairly low coverage levels, as observed during the first year, were rapidly improved through a number of interventions. First, all states started using hotspot lists for improved targeting of condom outlet establishment, rather than opening new outlets without a specific focus on hotspot areas. Before the first study, lists of target areas were not being used as they were either incomplete or had never been compiled before. Local sales teams actively made use of these lists to increase condom availability in the hotspots so as to meet the internal minimum coverage standards. The effect of improved targeting is illustrated by the results of Karnataka, where an increase in average coverage rate was observed during the second round of the survey, despite a 23.2% decrease in the total number of newly established active outlets in that state (from 25 434 in 2005 to 19 543 in 2006; PSI internal sales data).
The sales and marketing team needed to design innovative strategies in order to reach minimum coverage targets. Given that chemists were usually present in very low numbers or were even totally absent from certain hotspot areas, it was decided to expand condom distribution through non-traditional outlets. In many sites this was the only means of providing sufficient coverage. The significant increase in condom availability between the first and second rounds corresponds to the period when most ‘new to category’ outlets were opened. Despite average sales volumes per non-traditional outlet being much lower than in the traditional outlets, this suggests that the latter have played an important role in making condoms available across the majority of intervention areas. Following the 2006 round, each state decided on specific programmatic recommendations with the objective of improving condom coverage and quality of coverage. This decentralised approach, based on state-level programme action plans, made extensive use of the yearly monitoring data on coverage and quality of coverage. Along highways across the project area, an important factor explaining high condom coverage levels is the public–private sector partnership with the Indian Oil Corporation, which has resulted in a network of 631 pump stations where condoms are being sold, and in effect providing convenient condom access to truck drivers.
In addition to these strategies for locally improving condom availability, a number of interventions were designed in order to address quality standards. Whenever visibility was found to be insufficient, states implemented ‘visibility campaigns’ stimulating retailers to display condoms more prominently and to keep promotional items in their shop. This was achieved through a system of incentives (free stocks, reward), as illustrated by the ‘condom display contest’ in Tamil Nadu during November 2006 to February 2007.19 Sales teams also started identifying late-opening outlets and shops that are open 7 days a week by focussing on non-traditional outlets, because many chemists are not open after 21:00 hours and usually close for 1 day per week.
Little documentation exists on the measurement of condom availability and its trends over time (eg, Gilmour et al20 2000, Agha and Meekers21 2002, Weir et al22 2003). This study highlights the benefits of LQAS for the routine monitoring of ‘availability coverage’ of health products—specifically of condoms in target locations, although the methodology can be adapted to many other products. With a relatively small sample size, easy data collection procedures and simple analysis methods, it was possible to inform decision-makers on progress towards coverage targets regularly. The originality of study lies in the choice of geographical areas as the primary sampling unit, as opposed to individuals or households as is the case in most LQAS studies. The method offers an advantage over the traditional private-sector distribution surveys (retail audits), which are usually based on a large number of randomly selected outlets (rather than geographical areas) and that do not address geographical coverage or access among specific target populations. LQAS surveys for the monitoring of condom availability require a smaller number of outlets to be visited and are based on simplified sampling procedures.
There are a number of inherent weaknesses in the LQAS method, particularly related to the lack of precision and to its relatively low degree of predictive value.23 The method is not suitable in settings in which there are small differences in coverage between strata, as these cannot be reliably detected through LQAS hypothesis tests. Moreover, the method as a whole and the implications of its limitations are not always clearly understood by decision-makers, hence the need for close collaboration between researchers and programme managers. It is felt that these disadvantages are still outnumbered by the programmatic and practical benefits of the approach as highlighted above and, in the case of nutrition surveys, by Morris24 (2007). A limitation of this study is that our minimum standards can be further refined in order to adjust better for size variations in hotspot areas.
In conclusion, this study has been a catalyst for the project's targeted condom distribution, helping local sales teams focus their activities in priority prevention areas and around highways. The frequently conducted monitoring surveys provided sales and marketing managers with strategic information on the status of the condom distribution system and allowed for the tracking of progress towards the project targets. In part thanks to this monitoring system, PSI's condom social marketing project established a large-scale distribution network in highly targeted intervention areas and increased condom visibility by moving the product from the bottom shelf to eye level, normalising condom availability in areas where the need for the product is greatest.
During future monitoring rounds we will refine minimum coverage standards and we will consider additional quality standards, such as the price of condoms and the absence of interruptions in supplies. Geographical information systems analysis techniques will be used to estimate levels of access to condoms among the project's target groups and to correlate behavioural data (measuring programme impact) with the process indicators related to condom availability.
Key messages
The availability of male condoms in areas where FSW are present increased significantly between 2005 and 2008 in Avahan project states in India.
An extensive network of non-traditional condom outlets is essential for achieving substantial geographical coverage in priority areas for HIV/AIDS prevention.
Routine LQAS monitoring surveys of condom coverage are a valuable management tool for decision-making in a targeted social marketing programme.
Acknowledgments
The authors would like to thank Steven Chapman and Virgile Capo-Chichi for their comments and suggestions. Nadja Vielot and Sohail Agha kindly helped with the literature review. The authors' gratitude is also extended to the respondents, interviewers and contributors to the research design and/or implementation: Aseem Sharma, Lister Gomage, Naresh Kumar, Sarath Babu, Anita Raikar, M Malayappan, M Muruga.
References
Footnotes
Linked articles 038323, 038364, 038398, 038497, 038513, 038547, 038653, 038760, 038802, 038950, 039115, 039255, 039263, 039289, 039297, 040170, 040428.
Supplementary table is published online only at http://sti.bmj.com/content/vol86/issue1.
Funding This research was funded by the Bill & Melinda Gates Foundation, PO Box 23350, Seattle, WA 98102, USA. The views expressed herein are those of the authors and do not necessarily reflect the official policy or position of the Bill & Melinda Gates Foundation.
Competing interests None.
Provenance and peer review Not commissioned; externally peer reviewed.
This is an open-access article distributed under the terms of the Creative Commons Attribution Non-commercial License, which permits use, distribution, and reproduction in any medium, provided the original work is properly cited, the use is non commercial and is otherwise in compliance with the license. See: http://creativecommons.org/licenses/by-nc/2.0/ and http://creativecommons.org/licenses/by-nc/2.0/legalcode.
Linked Articles
- Editorial
- Editorial
- Editorial
- Editorial
- Editorial
- Editorial
- Supplement
- Supplement
- Supplement
- Supplement
- Supplement
- Supplement
- Supplement
- Supplement
- Supplement
- Supplement
- Supplement