Article Text

Abstract
Objective The UNAIDS Estimation and Projection Package (EPP) is a tool for country-level estimation and short-term projection of HIV/AIDS epidemics based on fitting observed HIV surveillance data on prevalence. This paper describes the adaptations made in EPP 2009, the latest version of this tool, as new issues have arisen in the global response, in particular the global expansion of antiretroviral therapy (ART).
Results By December 2008 over 4 million people globally were receiving ART, substantially improving their survival. EPP 2009 required modifications to correctly adjust for the effects of ART on incidence and the resulting increases in HIV prevalence in populations with high ART coverage. Because changing incidence is a better indicator of program impact, the 2009 series of UNAIDS tools also focuses on calculating incidence alongside prevalence. Other changes made in EPP 2009 include: an improved procedure, incremental mixture importance sampling, for efficiently generating more accurate uncertainty estimates; provisions to vary the urban/rural population ratios in generalised epidemics over time; introduction of a modified epidemic model that accommodates behaviour change in low incidence settings; and improved procedures for calibrating models. This paper describes these changes in detail, and discusses anticipated future changes in the next version of EPP.
- HIV modelling
- national estimates
- projection
- surveillance
- antiretroviral therapy
This is an open-access article distributed under the terms of the Creative Commons Attribution Non-commercial License, which permits use, distribution, and reproduction in any medium, provided the original work is properly cited, the use is non commercial and is otherwise in compliance with the license. See: http://creativecommons.org/licenses/by-nc/2.0/ and http://creativecommons.org/licenses/by-nc/2.0/legalcode.
Statistics from Altmetric.com
Introduction: an evolving global response drives changes in UNAIDS tools
The most significant change in the global response to HIV has been the rapid expansion of antiretroviral therapy (ART) using drug combinations in developing countries. Since WHO and UNAIDS launched the ‘3 by 5’ strategy in 2003,1 the number of people on ART has grown to exceed 4 million people by the end of 2008.2 High levels of ART in many countries are now having a major impact on HIV prevalence. Because survival of individuals on ART is greatly prolonged, HIV prevalence in the population as a whole will be higher than in the absence of ART. These increased prevalence effects are often reflected in surveillance data which the UNAIDS Estimation and Projection Package (EPP) fits to the model developed by the UNAIDS Reference Group on Estimates, Modelling and Projections (hereafter, the Reference Group model).3–6 EPP has been used extensively for modelling national epidemics.7–10 The EPP model must incorporate these effects of ART on prevalence before fitting to the data. High levels of ART can also lower the HIV incidence for a given prevalence level through decreases in viral load reducing individuals' infectiousness. To respond to both sets of treatment-related effects, EPP 2009 now uses a modified Reference Group model that includes the impacts of ART on prevalence and incidence.
Estimates of the number of persons living with HIV have been the major focus of routine monitoring and reporting on HIV epidemics. However, a number of problems have been identified with the reliance on prevalence as an indicator for analysing the impact of HIV programs. During the early phases of an epidemic prevalence grows rapidly, but changes in the slope due to saturation and to program impact are difficult to separate. After several years HIV prevalence tends to plateau, with new infections and deaths balancing each other out. An effective program introduced as this plateau phase begins may induce a gradual decline in prevalence, but this decline may be difficult to distinguish from mortality-related declines. Several years ago, the global epidemic entered a plateau phase, with most countries in sub-Saharan Africa—where the majority of people living with HIV reside—showing stable or only slowly declining HIV prevalence. As a result, in 2007 UNAIDS began to focus more attention on new infections, that is, incidence, as a more informative measure of global progress.11 In response, the UNAIDS Reference Group recommended that the tools UNAIDS prepares to assist countries in analysing their epidemics, EPP and Spectrum, shift to a focus on incidence.12 This change was made in the 2009 version of the software, which still fits prevalence data, but provides incidence from the model along with prevalence as outputs. Because incidence is derived by fitting prevalence, it reflects an averaged national trend in new infections and may not capture short-term rises and falls in incidence occurring in specific groups or geographical areas.
EPP 2009 includes a number of additional changes to resolve issues that have arisen in the application of the package at country level. EPP 2007's uncertainty estimation procedures evaluated 50 000–200 000 sets of Reference Group model parameters for their fit to the observed prevalence data, normally selecting out 50 or more that were close to the data (described in Brown et al5 and Alkema et al13). In a few countries, the defaults set in the uncertainty procedures produced relatively few unique curves, leading to inaccurate estimation of uncertainty. A new procedure, incremental mixture importance sampling (IMIS), has been introduced to solve this problem. In many African countries the population has been rapidly shifting from rural to urban areas, but earlier versions of EPP assumed fixed urban and rural population sizes.12 EPP 2009 now allows the urban/rural proportions to vary over time. In a small number of countries, fits to the data in EPP 2007 produced zero incidence within a few years, a situation which has never been observed in any country. A modified Reference Group model was developed for use in these countries. Finally, user interface changes were introduced to allow user input of the data needed for ART calculations, improve overall calibration procedures, and support the shift to an incidence basis.
Incorporating ART into the Reference Group model and EPP fits
The widespread availability of ART is altering the course of HIV epidemics. People living with HIV who start ART have substantially increased survival.14 As a result, HIV prevalence is higher than it would be otherwise. Figure 1 illustrates the impact that scaling up ART from 0% coverage among those in need in 2005 to 100% coverage by 2015 would have on an advanced epidemic. Prevalence increases slightly because fewer people are dying from HIV-related causes. At the same time, incidence declines because a substantial fraction of those living with HIV are now on ART, which substantially reduces their infectivity, that is, their ability to infect their partners. In EPP 2009, based on a review by Baggaley and colleagues (unpublished), the default value for the infectivity of those on ART is set at 0.11 of the infectivity of persons not on ART, but the user can change this value on the User Preferences page. This figure was based on an extensive review of the relative HIV transmission probability of treated individuals compared to people not eligible for ART, estimated from the best field data available at the time as 0.20, an 80% reduction in infectivity. This figure was then adjusted for the average duration and relative infectiousness of the stages of HIV infection to provide the 0.11 figure for relative infectiousness compared to all infected individuals, that is, both those eligible for and ineligible for ART. This value is similar to those in another literature review and a recent cohort study, both of which found a 92% reduction in heterosexual transmission among those on ART relative to those not on therapy.15 16
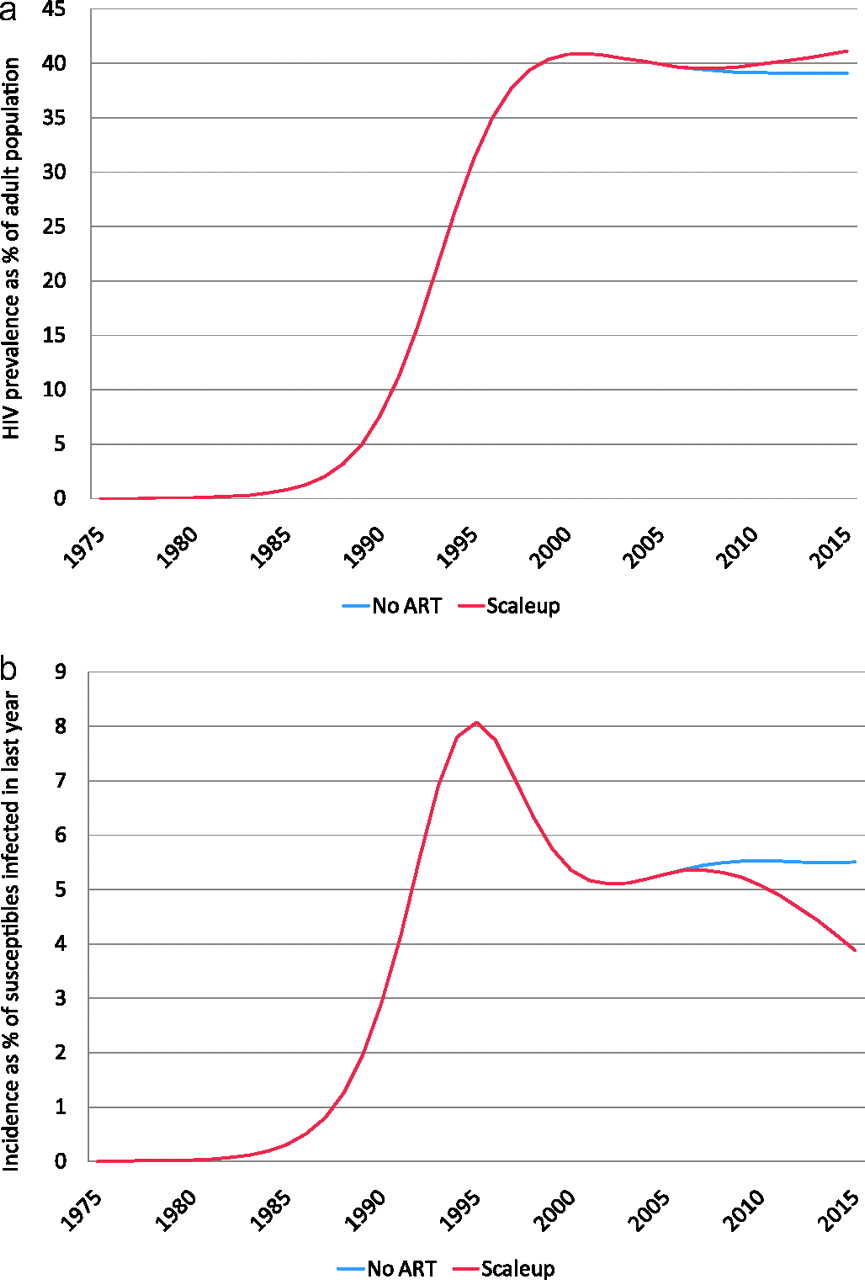
The impact that scaling up to 100% of antiretroviral therapy (ART) need by 2015 would have if begun in 2005 in an advanced epidemic. (A) Prevalence increases as a result of prolonged survival of those on ART, while (B) incidence declines. Note that the UNAIDS Estimation and Projection Package (EPP) estimates incidence using the traditional epidemiological definition of percentage of susceptibles contracting HIV rather than on a whole-population basis.
Adding ART to EPP 2009 required substantial changes to both the internal Reference Group model and the user interface:
The underlying equations describing the Reference Group model were modified to include the effects of ART on survival and new infections (see the appendix).
The EPP interface added an ART Data page for the user to provide information about the CD4 eligibility criterion, HIV progression rate and numbers on first- and second-line ART.
The Results page added a button, labelled ‘ART results’ which brings up a table displaying the number of people on ART and estimated percentage of ART need met.
The original Reference Group model, described in detail previously,4 5 divided the population into three groups: (1) those not at risk (X); (2) those at risk, but not yet infected (Z); and (3) those at risk and living with HIV (Y). These three groups are shown in the upper left of figure 2. New members can enter the two uninfected compartments at age 15 and only leave a compartment by contracting HIV or dying. Those in the uninfected compartments have only background mortality applied, while those living with HIV also have additional HIV-related mortality, which depends on when they contracted HIV.

The compartments in the modified Reference Group model with antiretroviral therapy (ART) used in the UNAIDS Estimation and Projection Package (EPP) 2009. Once they become eligible for ART, those living with HIV can move to untreated or first-line therapy compartments based on the number of treatment slots available. If they fail first-line therapy they can move to second-line therapy.
As seen in the lower right of figure 2, the model in EPP 2009 has been modified to add several new compartments: those newly eligible for ART, divided among those untreated and those on first-line ART; and those on second-line ART. While previous versions of EPP and Spectrum used a single Weibull survival function for time from infection to death, EPP 2009 and current versions of Spectrum replaced this single function with four functions: a Weibull curve describing progression from infection to eligibility for ART, a second Weibull curve describing progression from eligibility to death in the absence of ART (see figure 3), and simple survival functions for those on first- and second-line ART expressed as the percentage of those on each treatment surviving from year to year. The eligibility Weibull function is used to progress people from the infected at-risk compartment into the currently eligible compartment based on their time since infection. EPP 2009 then uses current numbers of people on first- and second-line ART supplied by the user to divide eligible individuals into those untreated, those on first-line ART and those on second-line ART. For persons remaining in the untreated category, survival will follow the Weibull distribution of time from eligibility to death based on the time at which they became eligible. For those on first-line ART, survival is determined by two values: (1) the percentage surviving the first year on first-line ART, and (2) the percentage surviving subsequent years on first-line ART. By default these are set to 86% and 90%, respectively, but may be changed by the user. If a person fails first-line therapy and slots are open for second-line therapy, they are moved to second-line therapy and 90% survival per year is assumed in subsequent years. If no slots are open, they progress to death. By tracking people's evolution through these additional compartments, the outputs of EPP 2009 incorporate the impacts of ART on prevalence and incidence. The equations describing this model are provided in the appendix.

Example of the Weibull distributions for time (A) from infection to antiretroviral therapy (ART) eligibility and (B) from ART eligibility to death. When combined, they approximate (C) the original Weibull survival function used in previous versions of the UNAIDS Estimation and Projection Package (EPP) and Spectrum. This figure is for a CD4 eligibility threshold of 200 cells/mm3 and normal (11-year survival) progression pattern.
The Weibull curves used depend on both an eligibility criterion in terms of CD4 count and a fast or normal progression rate from HIV infection to death chosen by the user: four sets of Weibull parameters are provided to cover possible combinations of CD4 eligibility threshold (CD4<200 and CD4<350) and progression pattern (normal with median 11-year survival, fast with median 9-year survival without ART). Fast and slow progression patterns address the wide variability in survival observed between African and Thai cohorts.17
This modified model requires several decisions and numerical inputs from the user in order to fully calculate ART effects:
CD4 eligibility threshold. The user must select eligibility for ART as a CD4 count below 200 cells/mm3 or a CD4 below 350 cells/mm3.
Progression pattern. The user must select a progression pattern with an overall survival in the absence of ART of 11 years (normal pattern) or one with survival of 9 years (fast pattern).
Year-by-year estimates of percentage survival in the 1st year of ART. By default this is set to 86% surviving the first year and is kept at this value throughout the projection. However, expansion of voluntary counselling and testing (VCT) programs in most countries is expected to allow for detection of individuals living with HIV at higher CD4 counts. When therapy starts at higher CD4 counts, survival is improved.18 19 As VCT programs expand, it is expected that first year survival will improve, so EPP and Spectrum allow the user to change it over time.
Year-by-year numbers on first-line and second-line ART nationally. The user must provide the total number of individuals on first- and second-line therapies. For years in the past, values should be based on historical program data. For years in the future, values can be based on projections of anticipated numbers on ART. To simplify future projections, the user can enter values for historical data and an estimate for the numbers on ART in the final year of the projection and then select an option to project the intervening years (the ‘ART project’ button). This will linearly extrapolate from the last historical value entered and the estimate for the final year.
Distribution of ART among user defined subpopulations. Finally, the user must distribute the national ART numbers among the different subpopulations. This distribution may be either done in absolute numbers or as percentages of all those on ART who are members of each subpopulation.
The user enters this information on a single ART Data page in EPP 2009. The subsequent year survival on ART is specified on the User Preferences page and can be altered by the user if desired, although the Reference Group generally recommends against this in the absence of convincing local data to the contrary.
The shift to incidence
In EPP incidence is defined using the standard epidemiological definition of the percentage of those susceptible to infection contracting HIV in a specified year. The shift from prevalence to incidence in EPP 2009 required primarily changes in the user interface. Internally, the EPP implementation of the Reference Group model has always explicitly calculated incidence while fitting prevalence. For EPP 2009, however, this was made visible to the user. There are a number of places where the shift to incidence becomes apparent:
The files containing the national projection and uncertainty estimates (*.spt and *.spu) that EPP passes to Spectrum now provide incidence as well as prevalence. Spectrum then uses this incidence to calculate its outputs for national projections.
On the Results page, incidence can now be displayed both in terms of estimated number of new infections and percentage of susceptibles contracting HIV in a given year (see figure 4). Users should always take final new and current infection numbers from Spectrum rather than EPP because Spectrum has a more complete demographic model, while EPP uses a simplified demographic model inherent in the Reference Group model.
A graph for displaying the incidence distribution (see figure 5) has been added to the Results page and is activated by clicking the button labelled ‘Incidence distribution’. This displays the distribution of incidence among the various user defined subpopulations in EPP. It can help to track the evolution of the epidemic and provide countries with a better idea of which populations are giving rise to new infections at a given point in time.

Incidence display on the Results page. The user can select to display new infections, that is, incidence as either (A) the percentage of those susceptible to infection who contracted HIV in the last year or (B) an absolute number of new infections in a year.

Incidence distribution displays. UNAIDS Estimation and Projection Package (EPP) 2009 allows the display of the distribution of incidence among the subpopulations comprising a national projection. The vertical axis shows the number of new infections in thousands.
Improving uncertainty estimation
EPP 2007 adopted an uncertainty estimation method known as Bayesian melding.5 13 This method generates random combinations of the Reference Group model parameters (r, f0, t0 and ϕ) in accord with user-specified distributions of each of the variables, weights them by how well they fit the surveillance data, and then resamples them to provide an estimate of the uncertainty in the fit of the model to the data.20 This method worked fairly well in most cases, but for some surveillance data sets the method found relatively few unique curves close to the data among the resamples (see figure 6A). This meant that the uncertainty bounds were not very well-determined. The problem could be alleviated by generating more parameter combinations, but this was very computationally demanding and time-consuming.

A comparison of the outcomes of the Bayesian melding routines as implemented in the UNAIDS Estimation and Projection Package (EPP) 2007 (A) and EPP 2009 (B) with the same data set. This illustrates how the incremental mixture importance sampling (IMIS) procedure used in EPP 2009 provides many more unique curves and better uncertainty estimates in similar amounts of computational time.
EPP 2009 replaced the simple random sampling of possible combinations of variables in the Bayesian melding module with a procedure known as incremental mixture importance sampling (IMIS).21 22 In IMIS, a smaller initial set of (r, f0, t0 and ϕ) combinations is generated. (Note: If one is using the ϕ-shift described later in this paper, this group is expanded by two variables, ϕ′ and the year in which the shift begins, tϕ–shift.) These are then evaluated and weighted by their fit to the data. New combinations of the variables are then generated centred on the combination with the highest weight. This process is repeated iteratively until the desired number of unique curves is obtained. The IMIS algorithm has several control parameters: the number of initial samples, N0, the sample size at each importance sampling iteration, B, and the number of resamples, J. The algorithm is unbiased for any choice of these parameters, but they do affect its efficiency. After extensive experimentation, good results were found with N0=4000, B=400 and J=3000. For 3000 resamples, finding 1900 unique curves ensures the resampled curves will be a good approximation to the actual distribution, so this was set as the default for national projections. For training purposes the number of unique curves was set at 400, which allows fits to be generated in a few minutes during workshops. Figure 6B illustrates how this procedure has generated a much higher number of unique curves, making the uncertainty bounds more accurate.
Allowing for urban/rural population shifts
Urbanisation is a global phenomenon, and large urban/rural HIV prevalence differentials are often observed in countries with generalised epidemics.23 24 Across Africa, United Nations Population Division projections show urban populations growing from 27.6% in 1980 to 39.9% in 201025; and in a few countries with generalised epidemics, the rate of urbanisation is extreme. Between 1980 and 2010, Botswana went from 16.5% to 61.1% urban, while Angola went from 24.3% to 58.5%.25 In an era of increasing urbanisation, urban/rural prevalence differentials can have a major influence on national HIV estimates.26 To adjust for this influence, EPP 2009 allows for changes in the urban/rural population proportions over time in generalised epidemics.
In most generalised epidemics, the national projection is divided into two subpopulations: one urban and one rural. In EPP 2009 the user first fits the epidemics in each subpopulation to the corresponding HIV surveillance data. EPP 2009 then combines these two separate fits with weights proportional to the number of people living in urban or rural areas. By default, the urban percentage is set based on the numbers entered on the Define Pops page and is kept constant over time. However, the user can change the annual urban/rural proportions over time on the Pop Change page, which contains a table showing the overall percentage of urban population along with the percentage of national population in each subpopulation. The user can also adjust urban–rural proportions to the values provided by the United Nations Population Division by clicking on an ‘Adjust to UN values’ button. If the user has defined multiple urban and rural subpopulations, then the total urban population is divided among them according to their relative size as specified on the Define Pops page. The actual resulting population sizes and the impacts on national HIV prevalence can then be examined on the Results page.
Unusual cases force modifications to the model
One final issue seen in the field was a small number of data sets, for example, in Cambodia or Zimbabwe, that approached zero incidence by the end of the projection period when fit with EPP 2007. No national HIV epidemic has ever been observed that actually declined to zero incidence. The problem here is that epidemics are dynamic, that is, the behaviours that drive them can and do change over time. However, the Reference Group model is static, that is, the four parameters that define the model (r, f0, t0 and ϕ) are fixed and do not vary over time—they must fit both the early epidemic and the late epidemic. While the ϕ parameter was introduced to represent increased or decreased levels of risk behaviour over the course of the epidemic,6 it forces a particular behaviour change pattern on a projection that is itself static. In the real world, behaviours change, the proportion of people at risk changes, and any model with static parameters will not be able to capture the full complexity. In fact, in a few epidemics incidence is once again rising, something that the original Reference Group model was never intended to reproduce and which cannot be fitted with the standard four-parameter model.
In order to address these issues, a number of variants to the Reference Group model were considered. One alternative allowed for a one-time change in r, which represents the rate at which new infections occur among the susceptible population. However, this approach was found to be insufficient, as the change in r often occurred when there were no susceptibles left in the population to become infected. Other alternatives were also explored, including variants in which both r and ϕ were allowed to change, and in which r shifted gradually over some time frame; but neither of these resolved the zero incidence issues. The solution finally adopted was to allow a slow shift in ϕ over some period before the end of the projection period. The interpretation of this scenario is that as prevalence declines from its peak, some individuals who had reduced their risk behaviours in response to the epidemic, might return to riskier behaviours, which would increase recruitment into the susceptible population. By allowing such changes and applying constraints on incidence, more reasonable incidence patterns could be produced while still fitting the data. This produced a six-parameter model with (r, f0, t0 and ϕ) supplemented by a ϕ′ and a year, tϕ–shift in which ϕ began a slow shift to ϕ′ by the end of the projection period. Using this approach, it was possible to fit the more problematic data sets without having incidence drop to zero (see figure 7).

An example of the impact of applying a ϕ-shift with an incidence constraint to Zimbabwe urban data. The left-hand figure shows the near-zero incidence resulting from a four-parameter Reference Group model fit, while the right-hand side shows the results of allowing ϕ to vary, providing a low, but stable incidence pattern.
Anticipated future directions
In the 2009 round of estimations, even after decomposing the population in homogeneous groups (eg, urban/rural, provinces, etc) more complex epidemic patterns were observed in a number of countries, for example, an early peak and subsequent decline in prevalence followed by an increase in prevalence. These patterns almost certainly result from behavioural changes, where lower levels of risk behaviour in the past are giving way to higher levels today, producing higher incidence. Such changes may result from prevention fatigue, perceptions of lower HIV severity with the availability of ART, new generations of susceptibles, or newly emerging epidemics in populations previously unaffected. Addressing these will require a more complex model than the simple four-parameter (r, f0, t0 and ϕ) Reference Group model or even the new six-parameter ϕ-shift model outlined above. Work is currently underway to develop models that allow r to vary smoothly over time (described in Hogan et al27 and in Bao and Raftery28), thus permitting the combined Spectrum–EPP package to better handle the more complex behavioural trends being observed as the global pandemic enters its fourth decade.
The focus on incidence in this round of global estimates highlighted some issues with the current separation of responsibilities between EPP and Spectrum, with EPP fitting the prevalence data and Spectrum subsequently applying a more complete age-structured demographic model to the resulting prevalence curve to produce comprehensive national outputs. Since incidence was calculated as the percentage of susceptible individuals contracting HIV, the variations in their underlying population models resulted in slightly different calculations of the number of new infections between EPP and Spectrum. In some countries, migration, which is included in Spectrum's demographic model but not in EPP's, made a substantial difference in incidence levels. In addition, it became clear that better incidence estimates would be obtained if the Reference Group model was adapted to use a population between 15 and 49 years of age and allowed ageing out at 50, instead of the current 15+ population. These factors also contributed to differing ART estimates between the two models, sometimes requiring countries to go through an iterative process to reach an acceptable result. These problems are being addressed in the next round of EPP and Spectrum by combining them into a more tightly integrated package. EPP will take its demographics directly from Spectrum and will pass its incidence calculations to Spectrum without direct user intervention, thus ensuring better consistency. The user will actually invoke EPP from within Spectrum, thus providing a more holistic user experience.
In light of evolving global and national policies and recommendations for initiation of ART at higher and higher CD4 counts, the next versions of Spectrum and EPP are adopting a CD4 model allowing for a fuller range of CD4 criteria, for example, 200, 250, 350 and 500.
The Reference Group also recognises that many countries rely on case reporting systems as opposed to cross-sectional serosurveillance and has begun to explore methodologies for estimating the levels of under-reporting in such systems as diagnoses increase, but these discussions are still at an early stage. In the future, as techniques for such estimation improve, their incorporation into the UNAIDS estimation and projection suite may be considered. As they have since the beginning, these tools will continue to evolve to address new problems and issues that arise as the global pandemic enters its fourth decade.
Key messages
The UNAIDS Estimation and Projection package has continually evolved to adapt to new issues arising in estimating and projecting national HIV epidemics.
EPP 2009 derives incidence, an essential indicator for program impact assessment.
EPP 2009 includes the effects of ART: reducing incidence, increasing prevalence and decreasing HIV-related mortality.
Computational efficiency in EPP 2009 has been greatly improved through the use of incremental mixture importance sampling.
Acknowledgments
We greatly appreciate the ongoing technical inputs of the many and varied members of the UNAIDS Reference Group on Estimates, Modelling and Projections, and the willingness of country counterparts to share the data used in preparing examples here with UNAIDS and WHO.
Appendix
The mathematics of antiretroviral therapy (ART) in EPP 2009
The Reference Group model modifications used in EPP 2009 are shown in figure 2. They primarily consist of calculating the number newly eligible for ART (E) at a given time step, and then dividing these among two new compartments for those who remain untreated (U) and those who go on first-line ART (L1). An additional compartment is added for those failing first-line ART and going on second-line ART (L2). The original compartments in the model are retained: not at risk (X), at risk and infected but not on ART (Y), and at risk but uninfected (Z). The total population at any point in time is then calculated as:
Demographic parameters, calculated from the United Nations Population Division non-AIDS projections, include background mortality (μ), birth rate to those aged 15 and older (b) and survival to age 15 (l). These are used along with the probability of vertical transmission (ν) and the fertility reduction among HIV+ women (ε) to calculate the number of new entrants Et in a given time step, t, in terms of the populations 15 years (t−15) earlier as:
The four primary Reference Group parameters remain unchanged: the force of infection (r), the initial fraction entering the at-risk population (f0), the start year of the epidemic (t0) and the behaviour-change parameter (ϕ); and the fraction, f, entering the at-risk population at a given point in time is determined by the size of the not-at-risk and total populations as:
To implement ART, a number of ART-specific inputs must be provided or selected by the user:
Time series for the number on first- and second-line ART: L1(t) and L2(t)
The infectivity of individuals on ART relative to those not on ART: Rinf (default 0.11, but user adjustable, Rinf=0 means no transmission)
Weibull for progression from infection to ART eligibility:
Weibull for progression from eligibility to death if no ART:
First year survival on first-line ART (time varying): s1(t) (default 86%, held constant, but user can change on an annual basis)
Second and subsequent year survival on both first- and second-line ART: s2+ (default 90%, but user adjustable)
The latter two survivals are then used to calculate a third distribution for progression to first-line failure once ART has commenced:
EPP then calculates the distribution for the rate at which infections occur at time x as:
where tι is the pulse of infection that initiates the epidemic. Note that those on ART receive the reduced infectiousness described by Rinf. The equations describing the changes in the number in each of the compartments: X, Y and Z becomes:
And the number newly eligible for ART in a given time step is calculated from the progression from infection to eligibility and the temporal distribution of new infections:
The newly eligible must then be allocated into the compartments for those on first-line treatment (L1) and those remaining untreated (U). The number failing first-line ART is calculated by applying the g3(x) distribution to estimate the number who fail first-line therapy, and thus leave the L1 compartment:
Where
that is, the number newly entering first-line ART is the increase in numbers on first-line ART specified by the user plus replacements for those who fail on ART. For second-line therapy, it is assumed that a constant fraction of those currently on ART fail at every time step, the second term in the above equation. The remaining number of newly eligible must then be allocated into the untreated compartment, U:
The final term in brackets in this equation represents background mortality (μU) and HIV-related mortality for those remaining untreated through the present.
This effectively assumes that those selected for ART are chosen uniformly without regard to their duration of infection. If all of those eligible at any point in the projection are placed on ART, this distribution is set to zero for all previous times. The total number living with HIV in the population is then defined as:
which accounts for the effects of ART on total HIV prevalence and incidence.
References
Footnotes
Funding The authors acknowledge the support of UNAIDS for the ongoing development of EPP and Spectrum. National Institute of Child Health and Development grant no. R01 HD054511 supported the development of the uncertainty estimation methodologies in EPP.
Competing interests None.
Provenance and peer review Not commissioned; externally peer reviewed.
We wish to make clear that the examples used here are illustrative in nature only. They may differ from actual national projections in the countries referenced, as they do not necessarily incorporate all data and information available at the country level. The views and opinions expressed in this paper are those of the authors and do not necessarily represent those of the United Nations. Its contents have not been formally edited or cleared by the United Nations.