Article Text

Abstract
The HIV/AIDS epidemic in Kenya has been tracked through annual sentinel surveillance in antenatal clinics since 1990. The system started with 13 sites and now has over 35. Behaviours have been measured through national Demographic and Health Surveys in 1993, 1998, and 2003. The surveillance data indicate that prevalence has declined substantially starting in 1998 in five of the original 13 sites and starting in 2000 in another four sites. No decline is evident in the other five original sites although the 2004 estimate is the lowest recorded. Nationally, adult prevalence has declined from 10% in the late 1990s to under 7% today. Surveys indicate that both age at first sex and use of condoms are rising and that the percentage of adults with multiple partners is falling. It is clear that HIV prevalence is now declining in Kenya in a pattern similar to that seen in Uganda but seven or eight years later. Although the coverage of preventive interventions has expanded rapidly since 2000 this expansion was too late to account for the beginnings of the decline in prevalence. More work is needed to understand fully the causes of this decline, but it is encouraging to see Kenya join the small list of countries experiencing significant declines in HIV prevalence.
- AIDS, acquired immune deficiency syndrome
- ANC, antenatal clinic
- KDHS, Kenya Demographic and Health Surveys
- HIV, human immunodeficiency virus
- STI, sexually transmitted infection
- VCT, voluntary counselling and testing
- HIV/AIDS
- Kenya
- prevalence
- trends
Statistics from Altmetric.com
- AIDS, acquired immune deficiency syndrome
- ANC, antenatal clinic
- KDHS, Kenya Demographic and Health Surveys
- HIV, human immunodeficiency virus
- STI, sexually transmitted infection
- VCT, voluntary counselling and testing
AIDS is a major health and development problem in Kenya. Since the beginning of the epidemic we estimate that over one million Kenyans have died from AIDS. Over one million adults (15–49 years) are currently infected with HIV. In spite of the efforts of the national government, international donors, civil society organisations, and others, HIV prevalence continued to increase throughout the 1990s.1 However, as will be shown in this paper, new evidence suggests that this trend has reversed. Evidence of significant decline in adult HIV prevalence exists for only a few countries including Uganda2 and Thailand.3 In most of sub-Saharan Africa prevalence of HIV is either still increasing or has stabilised in the past few years.4
In Kenya, HIV prevalence in adults in 2003 was estimated by a national survey to be about 7% nationally.1 Previous estimates of adult prevalence, based on surveillance among pregnant women, put 2003 prevalence5 at almost 10%, but these were later revised downwards using new information from the national survey on differentials between female and male prevalence and rural and urban prevalence. This revision has caused some confusion as some people have interpreted the lower estimate from the national survey as evidence of a decline in prevalence when it is actually just a better estimate. At the same time, evidence on prevalence trends from surveillance among pregnant women has gone largely unnoticed.
The paper examines trends in prevalence from sentinel surveillance and behaviour from several Kenya Demographic and Health Surveys (KDHS) to address the question of whether prevalence is declining in Kenya.
METHODS
We found several sources of data useful for assessing prevalence trends, including sentinel surveillance, estimates of national prevalence from surveillance data, and the KDHS, which provide information on both prevalence and sexual behaviour.
Sentinel surveillance
The HIV sentinel surveillance system in Kenya is implemented by the National AIDS and STD Control Programme (NASCOP). Data are collected for both antenatal clinic (ANC) clients and STI clinic clients. The STI data are primarily designed to represent high risk populations whereas the ANC data represent the general population. Therefore, only the ANC data are used to estimate national prevalence.
The sentinel surveillance system has conducted annual surveys since 1990. Beginning with 13 urban sites (shown in fig 1) it has expanded over time to include 35 sites in urban, peri-urban, and rural areas. In addition, the University of Nairobi Project “Strengthening STD/AIDS Control in Kenya” has collected surveillance data from four clinics in Nairobi from 1991 through 2003. Surveillance information for Kajiado from 1995 to 1998 was collected by the Kenya Belgium Cooperation Programme on the Control of Sexually Transmitted Diseases. Of the sites currently used seven had more than 90% of clients from urban areas, 14 had more than 90% from rural areas and the rest had a mixed clientele varying from 26% to 80% urban. For the 13 original sites surveillance data are available for 15 years, 1990–2004. For the 10 new sites added in 2000, data for only four years are available. For the other 12 sites data are available for 5–10 years.

Location of the 13 surveillance sites collecting data since 1990. Sites in bold show evidence of decline in prevalence since 1998. Sites in italics show evidence of decline in prevalence since 2000. Sites in normal font show no evidence of decline in prevalence.
At each site, pregnant women attending the ANC for the first time for that pregnancy are serially recruited for sentinel surveillance during a period of up to three months each year. HIV testing is performed on left-over blood from the antenatal profile, after testing for syphilis serology and anaemia. Demographic and laboratory results are captured through unlinked anonymous testing, following internationally recommended protocols.6 HIV testing is done using fourth generation ELISA (Vironostika Ag/Ab-based, Organon Teknika, Boxtel, the Netherlands) and third generation (Enzygnost antibody based, Dade Behring, Deerfield, IL). ELISA discordant samples are retested with three rapid tests (Determine, Abbott Laboratories, Abbott Park, IL; Unigold, Trinity Biotech, Brech, Ireland; and Oraquick, Abbott Laboratories, Abbott Park IL).
National prevalence estimate
Each year when new surveillance data become available, a technical committee organised by NASCOP examines the data and prepares an estimate of national adult HIV prevalence.1 This process involves the following key steps:
-
Fit smooth curves to the surveillance data for each site using the Joint United Nations Programme on AIDS (UNAIDS) Estimation and Projection Package.7
-
Assign one surveillance site to represent the urban population and one site to represent the rural population of each district (assignments are made by a group of people familiar with the surveillance sites that considers location, ethnic composition, and economic activity).
-
Combine the prevalence estimates for each district into a national estimate by weighting by the adult population (15–49 year old men and women, as estimated by the Central Bureau of Statistics).
-
Use the prevalence trend in the Spectrum software package8 to estimate the number of people infected, the annual number of new infections, and the annual number of AIDS deaths.
The addition of a large number of new sites in 2001 in mostly rural areas means that the average prevalence across all sites could decline if the new sites have lower prevalence than the existing ones. To avoid this problem curves are produced for each site over the full time period of 1990–2004. Sites that were started only in 2001 do not have a long enough time series to permit accurate curve fitting, so the curve shape parameters are drawn from nearby sites with more data, and then the curves are adjusted to match the level of prevalence for the period for which data are available.
Kenya Demographic and Health Surveys
In 1989,9 1993,10 1998,11 and 200312 Kenya conducted Demographic and Health Surveys. These are national population surveys that collect information on demographic and health status and behaviours. Information on some sexual behaviours is available from all surveys but specific modules on AIDS knowledge and behaviours (including number of partners, condom use, and commercial sex) were included in the 1998 and 2003 surveys. The 2003 survey also included the collection and analysis of blood samples to determine HIV prevalence. Samples were tested with Enzygnost AntioHOV-1/2 Plus ELISA test kit and all positive and 10% of negative samples were tested with Vironostika HIV-1 MicroELIZA System (Organon Teknika). The survey includes behavioural and demographic information on 8195 women aged 15–49 years and 3578 men aged 15–54 years. Data collection took place between April and September 2003.
This survey was the first of its kind to provide information on HIV prevalence linked to responses to questions about sexual behaviour. In half of the households all of the women and men interviewed were asked for a blood sample for HIV testing. Of the eligible men and women, 70% and 76%, respectively, provided blood samples for HIV testing (2851 men and 3151 women). The effect of refusal was analysed by ORC Macro by using multiple regression to estimate the probability of being infected with HIV on the basis of a number of behavioural factors (including marital status, number of partners, condom use, commercial sex, wealth index). When this equation was used to estimate the HIV status of those who completed the interview but refused to be tested, it showed no significant difference in HIV prevalence between those who were tested and those who refused the test. Differences could exist for those who were selected for the sample but could never be contacted (Annie Cross, ORC Macro, personal communication, 19 March 2003).
RESULTS
Trends in prevalence at surveillance sites
Figure 2A shows the prevalence estimates from 1990 to 2004 from five of the original 13 sites (Busia, Meru, Nakuru, Nyeri, and Thika). Although we found variation from one year to the next in some sites, there was a pattern of declining prevalence in recent years. The linear regression coefficients for trend from 1998 to 2004 were negative and significantly different from zero for each site (p = 0.017, 0.009, 0.014, 0.000, and 0.010, respectively). Mean prevalence for all five sites dropped from 25.1% (22.9–27.3%) in 1998–99 to 7.9% (6.7–9.1%) in 2004, a 69% decline. In three other original sites (Garissa, Kisii, and Kitui) there was evidence of a more recent decline, since 2001 (fig 2B). Mean prevalence for these three sites dropped from 14.7% (12.7–16.7%) in 2001 to 4.3% (3.1–5.5%) in 2003. A critical ratio (Z) test showed that the declines were statistically significant with p values less than 0.01 for each site. No pattern of decline in prevalence was evident in the other five original urban sites, as shown in fig 2C; although prevalence in 2004 is at historically low levels for all four sites with 2004 data. Kisumu, Kakamega, and Kitale are located near each other in western Kenya (although they are in different provinces), Nairobi is in central Kenya, and Mombasa is located in the south on the coast. Except for Kisumu these sites all reached stable prevalence levels in the early 1990s, whereas the sites shown in fig 2A, B showed increasing prevalence levels during the 1990s before starting to decline.
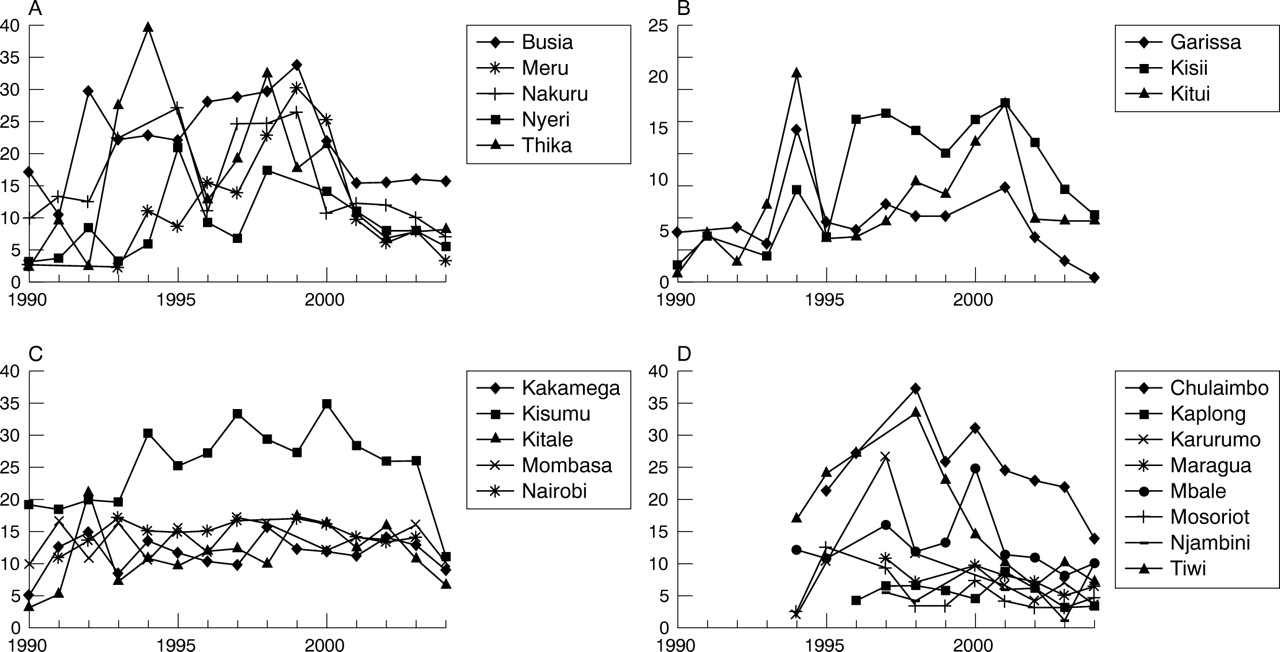
(A) HIV prevalence at five of the original antenatal clinics used in sentinel surveillance with evidence of decline in prevalence starting in 1999. (B) HIV prevalence at four original sites with evidence of decline starting in 2001. (C) Original sentinel sites with no evidence of decline in prevalence. (D) Sentinel sites in Kenya added in 1994–96.
Among the sentinel sites added in 1994 and 1996 we found considerable variation from year to year making it difficult to detect any recent trends. The overall pattern suggests a decline, at least in the sites with the highest prevalence in the mid-1990s (fig 2D) but data from more years will be required to demonstrate a clear trend. (The rapid decline in Tiwi, near the coast, may be due to the collapse of tourism and the subsequent out-migration of workers from Tiwi back to their home areas.)
There are dangers in selecting a proposed start date for the declines in prevalence for specific sites after examining the data and then applying statistical tests to that assumption. It would be better if we had a theoretical basis for the timing of the declines and the clustering of the sites. However, we feel that these patterns are striking enough to deserve attention even though we cannot fully describe why they have occurred.
Trends in national adult prevalence
An estimate of national adult prevalence can be produced by weighting the prevalence at each surveillance site by the size of the adult population it represents. When the sentinel surveillance data are smoothed by fitting prevalence curves to each site and weighted by the adult urban and rural population in the districts represented by each site, an estimate of the trend in national adult prevalence is produced. In this study, this estimate indicated that national adult HIV prevalence peaked at about 10% in the late 1990s and then declined to about 7% by 2003 (fig 3).
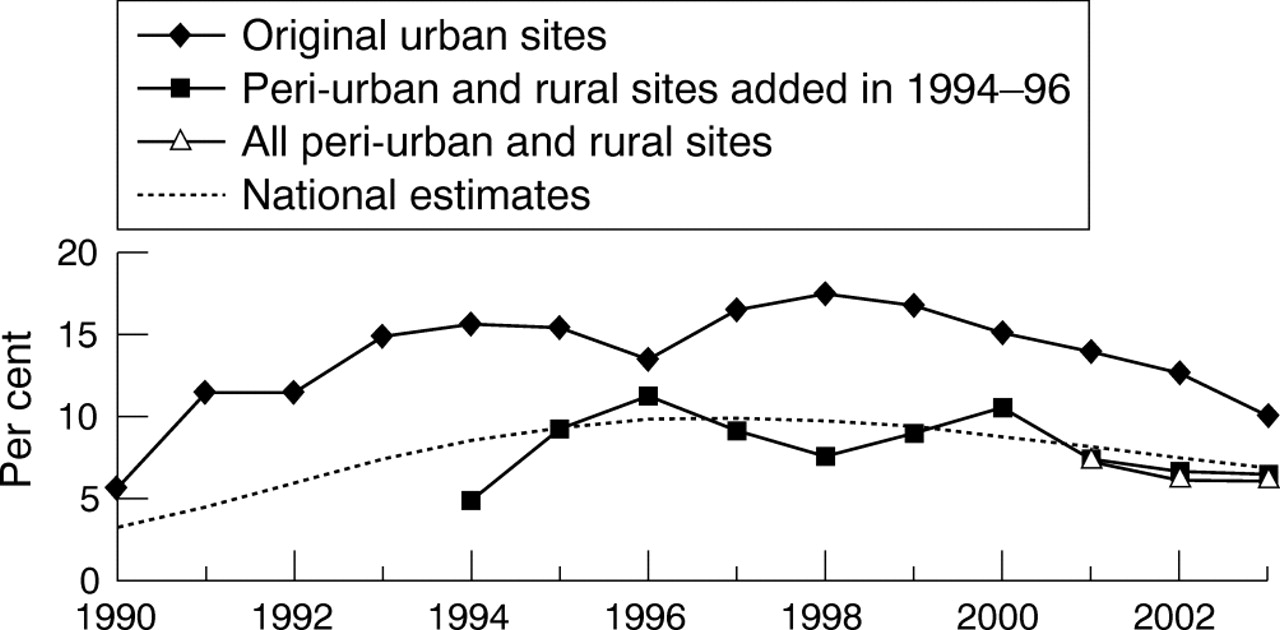
Trends in prevalence by type of surveillance site, adjusted to total adult prevalence and estimated national prevalence (1993–2003).
The process of curve fitting may smooth the actual changes and mask the rapidity of the decline in recent years. If we restrict the analysis to the last three years, when data are available from all 35 sites, and estimate national prevalence using the actual site estimates rather than the smoothed curves, then the national prevalence estimate drops from 7.5% in 2001 to 6.7% in 2003. The original 13 sites represent most of the urban population. Using the data from these sites, with curve smoothing, we can estimate the trend in urban prevalence from 1990. As fig 3 shows, prevalence in urban Kenya peaked around 1997 at nearly 16%, before declining to 10% in 2003.
It is difficult to assign confidence intervals to these estimates. If the entire surveillance sample of 6000–10 000 tests each year were a random sample of the adult population in Kenya then the 95% confidence intervals around the national prevalence estimate would be about 9% to 11% in 1997 and 6% to 8% in 2003. Since the site prevalence estimates do not represent a random sample and must be weighted appropriately to estimate national prevalence the real confidence interval is larger. The 95% confidence limits on the KDHS estimate of prevalence for 2003 are 5.2% to 8.2%. UNAIDS has developed a procedure to estimate plausibility bounds around national prevalence estimates that includes such factors as how well the surveillance sites represent the actual population, how well prevalence among pregnant women represents prevalence among all adults, and uncertainties in fitting curves to times series data.13 This procedure produces plausibility bounds of about 6.6% to 14.7% for 1997 and 4.7% to 9.2% for 2003 but these bounds are likely to be too large since they do not take into account the more accurate KDHS results available for 2003.
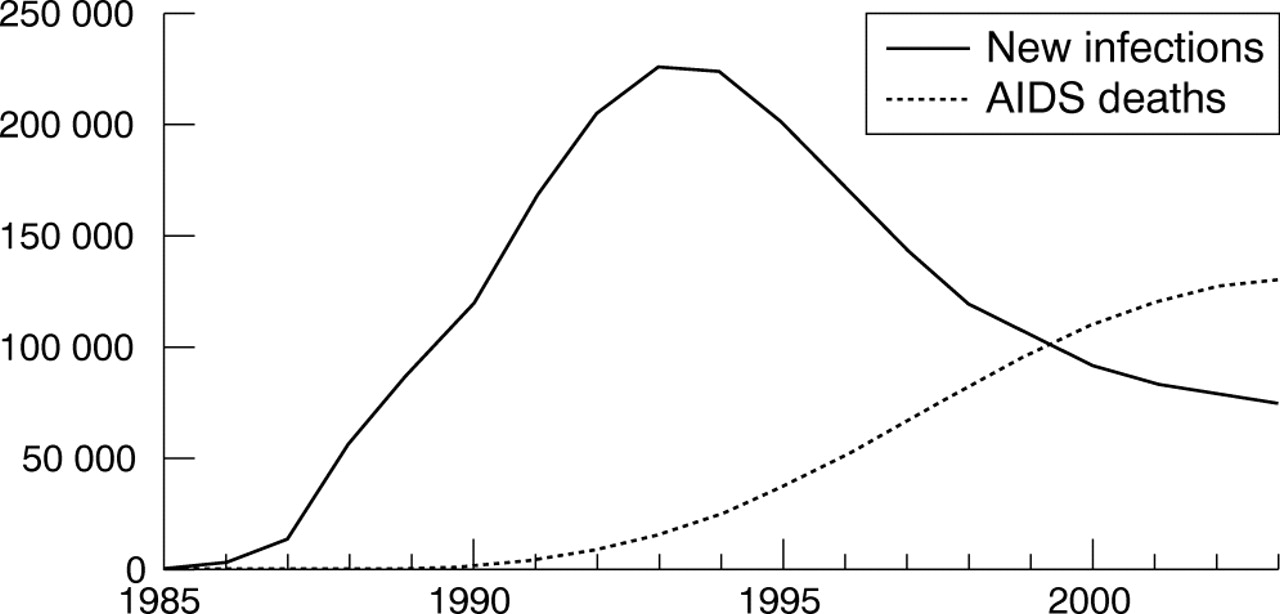
The trend in national adult prevalence can be combined with assumptions about the time from HIV infection to death and demographic information on the size of the population to estimate the number of AIDS deaths and the number of new infections each year. We did this using the Spectrum software developed by the UNAIDS Reference Group on Estimates, Model and Projections.8 The results are shown in fig 4. The annual number of AIDS deaths increased by over 60% from 1998 to 2003. The estimated number of new infections has dropped by two-thirds since its peak around 1993. The number of new infections required to produce the estimated adult prevalence depends primarily on assumptions about the time from infection to AIDS death. The default assumption used by the UNAIDS Reference Group is nine years. If it is actually shorter (6.5 years) or longer (11 years) then the decline from the peak in 1993 to 2003 varies from 47% to 80%.

Estimated annual number of new HIV infections and AIDS deaths.
Evidence of behaviour change
Table 1 shows indicators of sexual behaviour and HIV/AIDS knowledge and perceptions for indicators available from more than one KDHS. Age at first sex has increased since 1993 and the percentage of 15–19 year olds initiating sex by 15 years has dropped but the changes were not statistically significant. Significant declines have taken place in the percentage of men and women with more than one sex partner in the last 12 months and the percentage sexually active in the last four weeks. The percentage using a condom at last higher risk sex increased significantly for women. (The percentage reporting paid sex may have decreased but the question was changed to a more restrictive definition in 2003 so the comparison is not valid.) The percentage that reported knowing someone who has AIDS or someone who died from AIDS nearly doubled from 1993, even though the question in 2003 was more discriminating by requiring personal knowledge. The proportion of women in polygynous unions declined steadily from 30% in 1977–78 (Kenya Fertility Survey) to 16% in 1998 and 2003. The KDHS 2003 found that prevalence among women in polygynous unions was almost 1.6 times higher than those in monogamous unions (11.4% v 7.2%, see table 13.5, reference 12), and this decline may have contributed to reductions in HIV prevalence. A modelling analysis reported elsewhere in this volume concludes that these behavioural changes are consistent with the observed decline in prevalence and that the decline in prevalence cannot be explained by epidemic dynamics alone.14
Indicators of sexual behaviour and HIV/AIDS knowledge in 1993, 1998, and 2003† (sample sizes are given in parenthesis)
Trends in prevalence of other sexually transmitted infections
Efforts to expand the treatment and prevention of other STIs have a long history in Kenya. Researchers at the University of Nairobi were among the first to provide evidence on the link between STI prevalence and the transmission of HIV. Programmes in Nairobi, started in the early 1990s to improve STI treatment in public clinics and to implement community prevention programmes, have shown some success. Results from surveillance among women attending ANCs in Nairobi show significant declines in gonorrheal infection (from 5.3% in 1992 to 1.7% in 1999), chlamydia in women under 20 years (from 34.3% in 1992 to 17.0% in 1999) and syphilis (from 5.4% to 2.5% during the same period).15
Sentinel surveillance for HIV among STI clinic attendees provides evidence for a reduction in STI syndromes concomitant with a large programme funded by the World Bank to expand the syndromic management of STIs. Genital ulcer disease, urethral discharge, and vaginal discharge as a proportion of all STI cases declined between 1990–94 and 2000 from 27.6% to 11.0%, 31.8% to 22.2%, and 36.7% to 20.1%, respectively among all patients (men and women) attending STD clinics included in the HIV surveillance system.16
DISCUSSION
Sentinel surveillance for HIV infection among pregnant women indicates that prevalence has declined significantly since 1998 in some but not all areas in Kenya. The decline is similar in magnitude to that experienced in Uganda in the 1990s but has occurred over a shorter period and started about seven years later than in Uganda. This trend is corroborated by changes in reported sexual behaviour, particularly in the percentage of men and women reporting more than one partner. In our estimates of trends in HIV prevalence for all adults we assume that the ratio of female to male prevalence has remained constant since the early 1990s at about 1.9 as reported in the 2003 KDHS. If it has actually increased during this period, then the decline in national prevalence would be even greater.
The decline is occurring partly because deaths due to AIDS have reached very high levels, around 130 000 per year, as a result of high incidence in the mid-1990s. Thus about 10% of infected adults are dying each year. New infections are adding about 6%, or 80 000 people to the infected population each year. Before 2000 there were still more new infections than deaths, but since 2000 the situation has reversed.
Prevalence among pregnant women was already at high levels in some sites when the HIV surveillance system started in 1990 (19% in Kisumu, 17% in Busia, 10% in Mombasa). Prevalence continued to increase or remained stable in most surveillance sites throughout the early and mid-1990s. There is now evidence that prevalence has declined sharply since the late 1990s in many parts of the country. The recent declines appear to have resulted from significant behaviour change in the Kenyan population. The causes of this change are unclear. Kenya has not benefited from many of the factors that are thought to have contributed to prevalence decline in Uganda: the strong advocacy of President Museveni, the work of The AIDS Support Organisation (TASO) and other organisations with families living with HIV/AIDS, the advocacy of prominent individuals living with HIV/AIDS such as Philly Lutaya, and the involvement of church officials in speaking about AIDS from the pulpit and at funerals. These factors helped to create the conditions in which people communicated with friends and family about AIDS and ultimately adopted safer behaviours.
While recognition of the problem of AIDS arose later in Kenya and the involvement of the government, community groups, and the church has lagged, significant changes have occurred in recent years. The government passed an AIDS policy in 1997,17 declared AIDS a national disaster in 1999, and established the National AIDS Control Council to coordinate the response. While condom promotion has always been strong in Kenya, new prevention services have expanded rapidly in recent years. Voluntary counselling and testing (VCT) services were used by about 200 000 people in 2003 and services to prevent transmission of HIV from mother to child were offered to 120 000 pregnant women. Antiretroviral therapy is now being provided to about 20 000 people. These and other actions may have contributed to a more open environment that supported greater discussion of AIDS as the number of deaths become too large to ignore.
Key message
There is strong evidence that adult HIV prevalence is declining rapidly in parts of Kenya. The declined started in the late 1990s in some parts of the country and has spread to more areas since then. Kenya now deserves to be mentioned along with Uganda as a country that has achieved decline in prevalence.
It is clearly encouraging to see that HIV prevalence has started to decline in another sub-Saharan African country in addition to Uganda. More work is needed to understand the role of behaviour change in this decline and the causes of behaviour change. A better understanding of the causes of change in Kenya can be used to support and enhance these positive behaviour changes and produce continued decline in the number of new infections in the future.
AUTHORS’ CONTRIBUTIONS
B Cheluget and G Baltazar ran the sentinel surveillance system that collected the data for this paper while at the National AIDS and STD Control Program from 1993 to 2003. P Orege, Director of the National AIDS Control Council, and M Ibrahim, Director of the National AIDS and STD Control Program, supervised surveillance during part of this period and participated in the review and interpretation of the data. L H Marum provided technical assistance and has managed the funding for sentinel surveillance since 2000. J Stover provided technical assistance in the analysis of surveillance data. The paper was written primarily by J Stover, L Marum, and B Cheluget.
Footnotes
-
Competing interests: none declared
-
The findings and conclusions in this report are those of the authors and do not necessarily represent the views of the Centers for Disease Control and Prevention.
-
Edited by N Walker, H Ward and R Miller