Article Text

Abstract
Ascertaining epidemic phase for a sexually transmitted disease (STD) has depended on secular trend data which often contain significant artefacts. The usefulness of sexual network structure as an indicator of STD epidemic phase is explored in an analysis of community wide genital chlamydia reports, with network analysis of interviewed cases and linked sexual partners, in Colorado Springs, USA, 1996 to 1999. In this period, the chlamydia case rate per 100 000 increased by 46%. Three quarters of cases (n= 4953) were interviewed, nominating 7365 partners; these, combined with index cases, made up the 9114 persons in the network. Epidemiologic analysis of cases suggests that secular trend increases are artefactual. Network analysis supports this view: overall network structure is fragmented and dendritic, notably lacking the cyclic (closed loops) structures associated with network cohesion and thus with efficient STD transmission. Comparison of network structure with that of an intense STD outbreak (characterised by numerous cyclic structures) suggests low level or declining endemic rather than epidemic chlamydia transmission during the study interval. These observations accord with intuitive and stochastic predictions.
- sexually transmitted disease
- Chlamydia transmission
- sexual networks
- epidemic
Statistics from Altmetric.com
“God is a geometer” – William Blake
Wasserheit and Aral1 stratify epidemics of sexually transmitted diseases (STD) into five phases: introduction, establishment, growth, maintenance, and decline. They reason that phase informed interventions may be more efficient than generic ones. If so, a fundamental problem is knowing whether STD incidence is growing, stable, or declining. Assessment of the magnitude and direction of STD transmission customarily relies on trend analysis of reported cases or of surrogate markers (for example, visits to private doctors for genital herpes infection). Such data contain artefacts stemming from the reliability of diagnostic tools; the extent of their application at the clinical or population level; the vagaries of case definition; the consistency and quality of case reporting; and the changes in at risk populations or in intervention emphasis (for example, contact tracing or targeted screening).
During the last decade, research has implicated sexual network structure as a crucial determinant of STD propagation; certain network structural properties have been associated with facilitation2–4 or obstruction5, 6 of STD transmission. Assuming that network information is accurate, it follows that analysis of sexual network structure could furnish better indicators of STD epidemic phase than analysis of secular trend data. In this study, we explore the sexual network structure of community-wide genital chlamydia infection during a four year period and contrast the network picture with that generated by case surveillance reports. We conclude that network structure ascertainment is a potentially quicker and more reliable indicator of STD epidemic phase than ascertainment based on routinely collected secular trend data, and that it can supply an empirically based rationale for phase informed interventions.
BACKGROUND
Colorado Springs, the seat of El Paso County, is a well bounded, medium sized community near the centre of the continental USA. The county population, 70% urban, doubled during the last three decades, from 235 972 (1970 census), to 397 014 (1990 census), to 500 000 (1999 estimate); it is 50% male, 82% white, 8% Hispanic, 7% African American, and 3% other (1995 estimate). Its industries consist of technology, tourism, the military (about 32 000 servicemen), construction, and about 80 Christian evangelical groups. A structured STD control programme, characterised by low staff turnover, has been in place since 1970. Since its inception, key control components have consisted of active case surveillance, intensive contact tracing and targeted screening for reportable STD and, since mid-1985, for HIV infection, and prevention outreach to high risk populations (for example, prostitutes, street gangs, servicemen, gay men).
Formal chlamydia control began in mid-1987 with the availability of affordable antigen tests.7 Initial efforts focused on screening men and women in health department clinics. Contact tracing services have been continuously offered to all military and public provider cases since 1988. Not until late1995 were sufficient resources available to offer contact tracing services to private provider chlamydia cases (reportable since November 1991). Since 1996, chlamydia patient interviewing increased by 38% and partner tracing increased by 70% compared with the previous eight years. In mid-1996, health department clinics switched from the use of direct immunofluorescence to DNA amplification tests, with local military providers following this lead by mid-1998. Targeted screening for chlamydial infection has been routine in the public and military sectors since the late 1980s, and sporadic in the quasi-private and private medical sectors until the late 1990s. Between 1996 and 1999, about 44% of all chlamydia case reports (n = 6067) emanated from the public sector, 30% from the military, and 26% from the private sector.
METHODS
Study population
The population consisted of all persons over 12 years of age with genital chlamydial infection reported from all medical providers in El Paso County between January 1996 and December 1999. All cases were investigated by experienced disease intervention specialists (DIS), who attempted to interview them and locate named sexual partners. Partners were elicited for the 60 to 90 day period preceding index case diagnosis, except for the interval July 1996 to June 1997, when a 180 day period was used.8 If the period yielded only a single partner, notification was extended to the previous partner, if one existed.
Network analysis
We attempted to identify cases and their named partners uniquely, using a relational database and a name matching routine (available from the authors). Connections between people can be depicted graphically and mathematically.9 At the macrostructural level are network regions where every person is demonstrably connected to everyone else, directly or indirectly. At the micro level are elements that reflect subgroup formation; these can be higher or lower level microstructures, depending on the complexity of their connectivity. For example, dyads (two people connected in “barbell” fashion) and open triads (one person connected to two others) are considered lower level microstructures, while cyclically connected persons (closed structures or “cycles”, such as triangles, squares, squares with one or both diagonals, and so on) are viewed as higher level microstructures.5 Cyclic or densely connected structures are intuitively and empirically associated with increased probability of STD transmission.4, 5
Component distributions were generated with SAS routines developed by one of us (SQM), as were the SAS routines to permit network visualisation. Data for the largest components were imported into PAJEK, a freeware network visualisation program available on the internet.10 Graphic depictions of these components were produced as follows:
-
each component was reduced in stepwise fashion until only cyclically connected nodes remained;
-
the coordinates for these nodes were generated using the two dimensional Fructermann–Reingold algorithm for minimising line crossings;
-
coordinates for the nodes were further optimised by hand placement, the goal being planar representation;
-
the linear (non-cyclic) portions were added in stepwise fashion back into the graph and manually positioned;
-
images were exported to encapsulated (Apple/McIntosh) PostScript where they could be converted to other graphic file formats at any desired resolution.
Chlamydia trend indicators
Chlamydia rates per 100 000 population were calculated using general population estimates from the local census bureau. The reason for STD case detection was recorded as volunteer (patient presents spontaneously), screen (patient presents for reasons other than suspicion of diagnosed STD), and contact (patient referred as STD contact). As previously indicated,11 volunteers can be used as a surrogate for incidence, because they tend to present with acute genitourinary symptoms. The incidence of upper genital tract infection was estimated using surrogate information: self report of lower abdominal pain by women presenting in our health department STD and family planning clinics.
A repeater was defined as a person with two or more chlamydia diagnoses during the four year interval, providing that repeat infection occurred at least 30 days after the initial diagnosis. Co-infected persons refer to individuals diagnosed concurrently with chlamydial and gonococcal infection.
RESULTS
Chlamydia trends
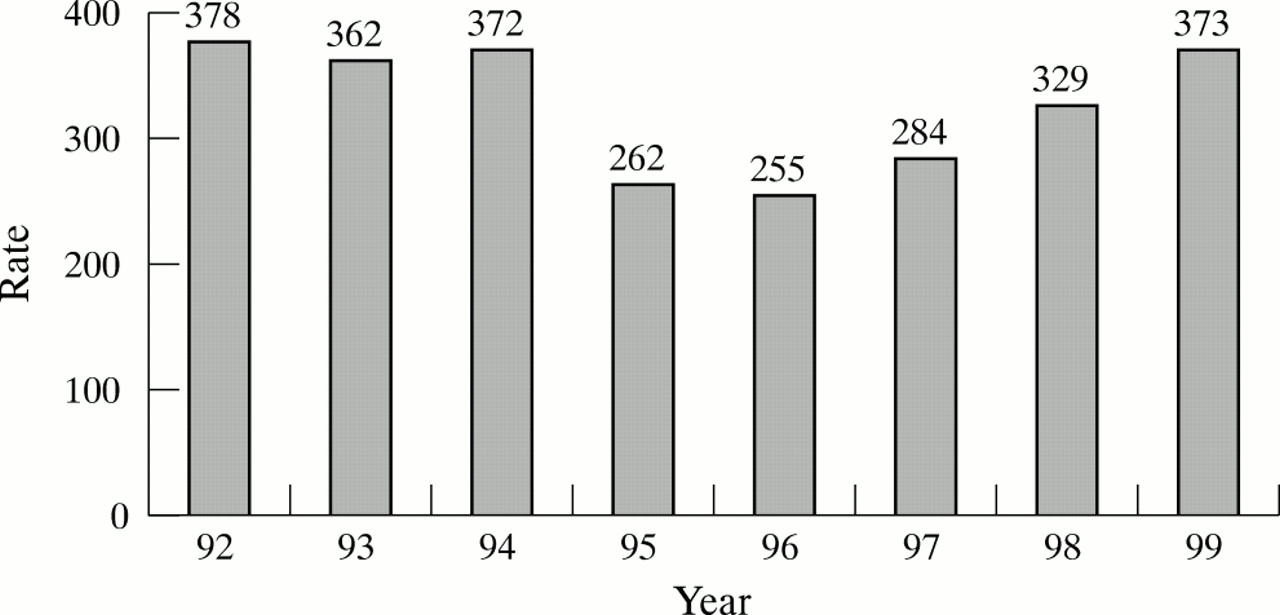
Reported chlamydia cases increased from 1204 in 1996 to 1871 in 1999 (+55%), with rates per 100 000 population increasing from 255 to 373 (+46%) (fig 1). Examination of case reports by principal source (public, private, military) clearly indicated the temporal association of new testing technology with sharply increased case reporting (data not shown). For example, introduction of DNA amplification tests in the military sector in the spring of 1998 was associated with a 77% increase in case reports, from about 340 cases a year (1996–97) to about 600 a year (1998–99). Enhanced contact tracing, combined with the nearly simultaneous switch to DNA amplification testing, was temporally associated with a 20% increase in STD clinic case reports, from an annual average of 414 (1992–95) to 497 (1996–99).

Chlamydia rates per 100 000, Colorado Springs, 1992–99.
Examination of case reports by reason for clinical presentation also suggested that most of the increase was attributable to superior chlamydia test technology and to enhanced contact tracing (fig 2). Cases identified by contact tracing (+108%) and by screening (+55%) increased markedly between 1995 and 1999. Cases classified as volunteers (97.6% of whom, in Colorado Springs, complain of genitourinary symptoms) increased only moderately (+18.7%), probably because of enhanced testing accuracy. For example, among 2407 STD clinic men initially diagnosed with gonorrhoea negative urethritis between 1995 and 1999 (annual mean = 481; range 436 to 520), the chlamydial to non-gonococcal urethritis ratio increased monotonically from 0.5:1 to 1.75:1, resulting in a doubling of chlamydia diagnoses, from 147 in 1995 to 298 in 1999. In women, almost all of the increase in cases classified as volunteers occurred after adoption of DNA amplification chlamydia tests (data not shown). Finally, of 22 648 visits by women being screened in our STD and family planning clinics between 1994 and 1999, 3373 (14.9%) complained of lower abdominal pain; the annual proportion reporting this complaint decreased from 16.3% in 1994 to 13% in 1999, a 20% decline.

Chlamydia cases by reason for presentation, Colorado Springs, 1995–99.
Altogether, these analyses suggest that the chlamydia burden in Colorado Springs has, at least, been stable during the study interval—and may even be declining—despite substantial increases in reported cases.
Network analysis
Between 1996 and 1999, 6067 cases of genital chlamydia were reported in Colorado Springs, of whom 38.7% were white, 36.2% African American, 17.5% Hispanic, and 7.6% other. Overall, three quarters (4593 of 6067) were interviewed for sexual partner information: 71% of the women (2754 of 3883) and 84% of the men (1839 of 2184). These 4593 cases named 7365 sexual partners; together, cases and partners consisted of 9114 different persons. Reported sexual connections among these 9114 persons were used for network analyses.
Connected component distribution
The 9114 persons were observed to form 2701 separate components (table 1). Component size in the four largest ranged from 73 to 141 individuals, while the smallest each contained two (1374 dyads) or three individuals (748 triads). Four per cent of all persons were part of the four largest components, and about 55% appeared in dyads or triads. Ninety seven per cent of components (2625 of 2701) consisted of nine or fewer connected persons and contained about 83% of all individuals.
Chlamydia component distribution, Colorado Springs, 1996–99
Network visualisation
Visualisation of the 10 largest components (those exceeding 30 individuals) revealed a linear branching structure virtually devoid of closed loops, typified by the four largest components (fig 3). Only the largest component (n = 141 persons) contained any cycles (see the two arrows in fig 3). Concerned that this consistently linear structural pattern may reflect interviewing artefacts, we analysed network connections for the period between July 1996 and June 1997. As previously reported,8, 12 a higher percentage of cases was interviewed (86%) during this special study interval, using an interview period that was at least twice as long (180 days). Both component distribution and non-cyclic linear structure were similar during this interval to that of the four year period. The only notable difference was a substantial shift in the dyad to triad ratio, from 1.8:1 overall to 0.46:1 in the 1996–97 study interval. Thus enhanced partner interviewing procedures tended to increase observed connectivity in the smallest components. Low overall network connectivity and the virtual absence of cyclic microstructures in large connected components support the view that chlamydia infection in Colorado Springs was probably in a maintenance phase or possibly in a decline phase during the four year study period. We conclude that the fragmented, non-cyclic network structure observed probably reflects low endemic rather than epidemic spread.
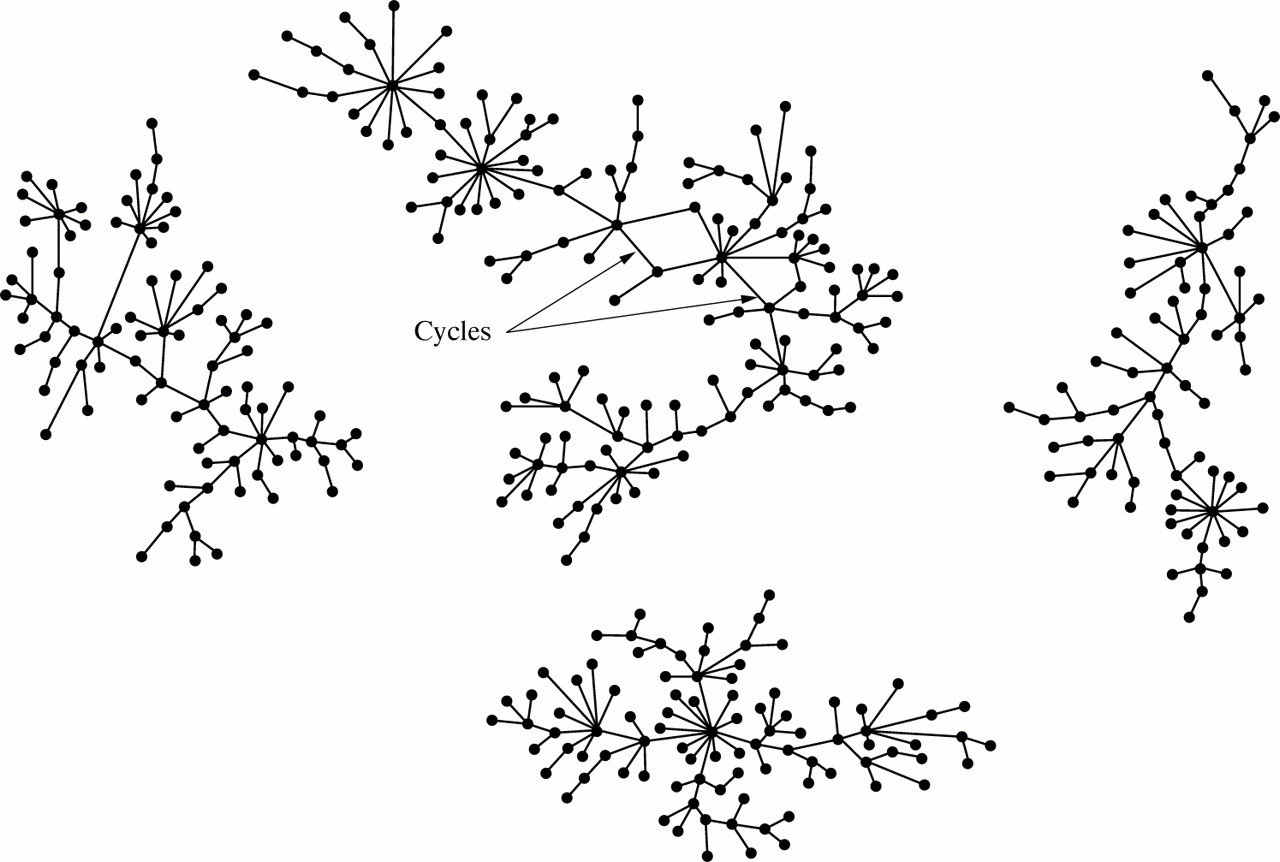
Graph of the four largest chlamydia components, Colorado Springs, 1996–99.
Comparison with epidemic network structure
A historical contact tracing dataset recording rapid epidemic spread of bacterial STD in Colorado Springs was available for reanalysis. As previously reported,2, 3 a group composed of 578 persons, mostly adolescents associated with crack cocaine street gangs, was involved in an STD outbreak during 1990 and 1991. Of 578 individuals identified, 410 (71%) formed a single connected component consisting of 218 men and 192 women. In this component, 300 (73%) were examined; 248 were infected with one or more bacterial STD (261 gonococcal, 127 chlamydial, and two early syphilis infections). These data suggest a hyperendemic STD period prevalence of 130 000 cases per 100 000 population. The dense interconnections in this group reveal a predominantly cyclic pattern with some linear connections at individual nodes (fig 4A). Pruning the graph of the dendrites leaves the “core” of 107 persons who form the basis for cyclic connections (fig 4B).
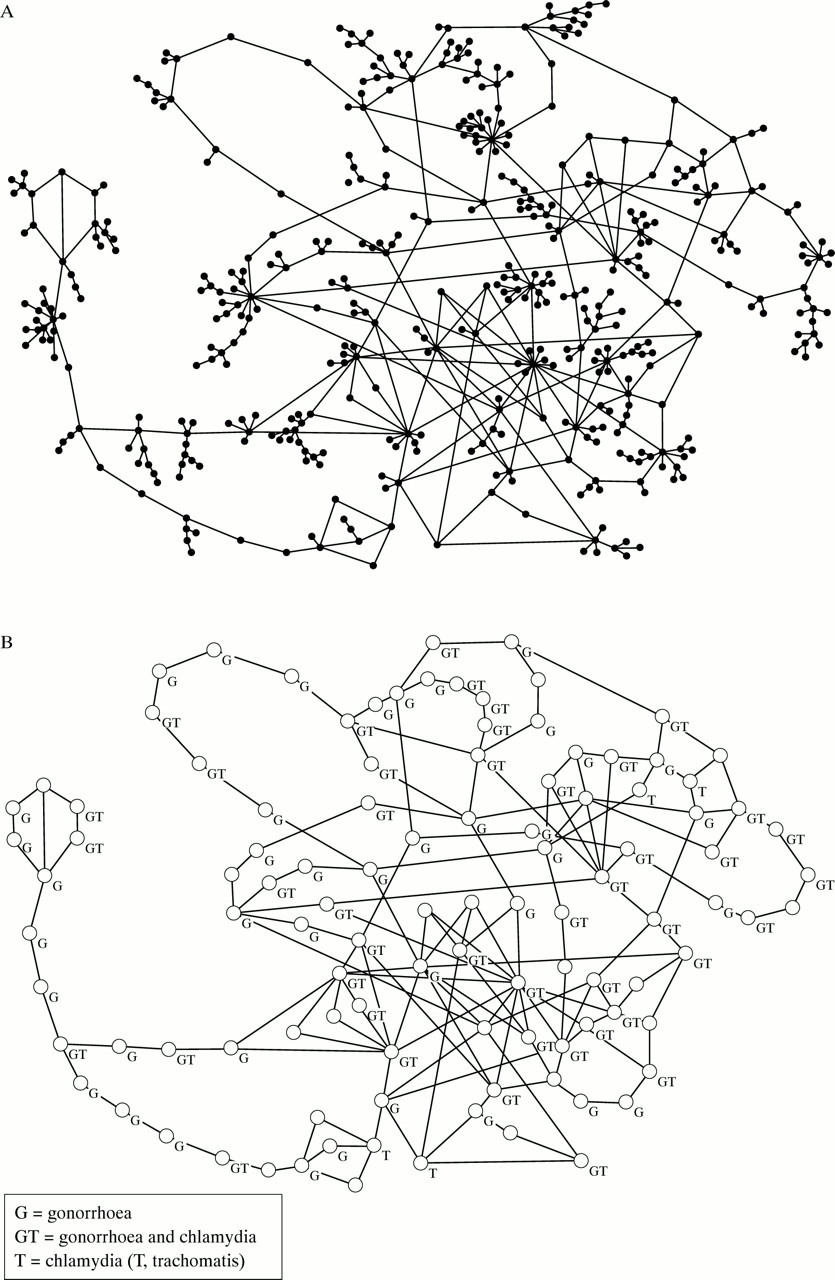
(A) Graph of the largest component in gang associated STD outbreak, Colorado Springs, 1989–91 (n = 410). (B) Core of the largest component in gang associated STD outbreak, Colorado Springs, 1989–91 (n = 107).
Demographic characteristics of persons by component category
Individuals who, during a four year period, are demonstrably linked within large and medium sexual networks may be viewed as occupying “core group” space.13 Assuming that the larger the component, the more likely it is to contain core group members, we compared the sociogeographic attributes of the 275 persons infected with chlamydia (that is, those for whom we have complete information) in the 10 largest components with those of the 1461 infected persons in the 66 components of medium sizes (10 to 28), and with those of the 2623 infected persons in the 2625 smallest (< 10) components (table 2). Core group members tended to be young African American men sexually involved with ethnically diverse women who were, on average, two years younger. A clear gradient by age, ethnicity, and sex was noted. There was an inverse relation between component size category and average age for both sexes: the larger the component, the younger the age. For African Americans we noted a direct relation: the larger the component size category, the larger its African American representation; for whites and others, we noted an inverse relation. In addition, the male to female ratio is lowest in the smallest components, suggesting disproportionate representation of prevalent cases (especially women, who are thought to harbour chlamydia longer than men). Conversely, a ratio approaching parity suggests the presence of incident cases, as would be expected (and is observed2, 3) in densely connected networks. Lastly, both the sociodemographic characteristics and sexual partner selection patterns of persons in the larger components bear a striking resemblance to those reported in persons associated with the gang outbreak, which itself probably reflects incident transmission.
Characteristics of persons by component size membership
Geography of components and chlamydia cases
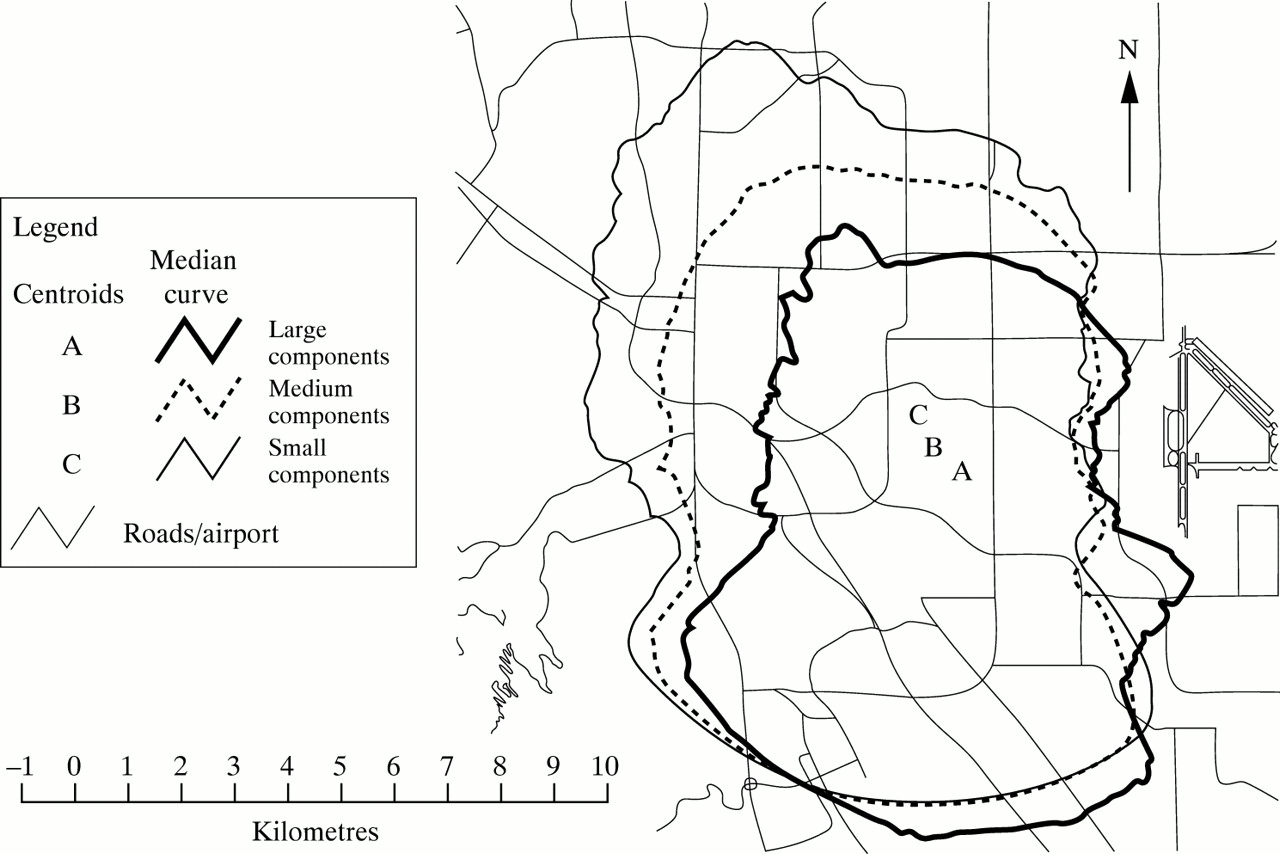
The spatial distribution of persons in this study, by component size (fig 5), calculated by drawing a rotating box plot for the distribution of persons from the group's centroid (method of Muth and colleagues14) showed that infected persons in the largest components tended to reside in the southern and southeastern parts of Colorado Springs. Those in the medium and small components resided to the north and west of persons in the largest ones. This pattern reflected the ethnic distribution in Colorado Springs, as African Americans cluster in the region's southern and southeastern neighbourhoods.

Spacial distribution of chlamydia cases by component size category.
Ninety six per cent of cases (5801 of 6067) had sufficient geographical information. Using the method that assigns 50% of the observations to “core”, and the next 30% to “adjacent”, areas,15 mapping of these chlamydia cases within El Paso County's 71 neighbourhoods showed that eight were classified as core and 15 as adjacent. Thus one third of neighbourhoods accounted for four fifths of cases. Although the unit of analysis is cases rather than infected persons, the same pattern of heavy chlamydia concentration in southern and southeastern neighbourhoods is noted (fig 6).

Neighbourhood map of regions of major chlamydia prevalence, Colorado Springs, 1996–99, n = 5801.
Repeat and co-infection
Repeat and co-infected (chlamydia and gonorrhoea) cases are disproportionately represented in the larger components (table 3), which are demographically associated with incident infection. Nearly three quarters (416 of 555) of repeat, and three fifths (274 of 460) of co-infected cases appear in large or medium sized components.
Chlamydia repeat infection and chlamydia-gonorrhea co-infection status by component size membership, Colorado Springs, 1996–99
DISCUSSION
Efficacy and efficiency of phase informed interventions may depend on accurate diagnosis of epidemic phase.1 How then do we reliably assess whether STD transmission in a given community is growing, stable, or declining? Most STD programmes use surveillance information derived from case reports. Such evaluation is notoriously error-prone and invites self serving interpretation. For Colorado Springs, we provide evidence that case report totals generate a misleading picture, in this case a “phoney” epidemic. Analysis of cases reported between 1996 and 1999 indicates that most of the observed increases are strongly associated, as expected,16 with introduction of superior chlamydia tests and with enhanced contact tracing. Analysis of sexual network connections during the four year study interval and during the enhanced observation period (1996 to 1997) reveals a structural environment supportive of low chlamydia propagation, and one that did not change during this period. This relatively anaemic transmission environment coincides with data we recently reported on chlamydia transmission rates by subgroup during the enhanced observation period.12 Only 10% of subgroups analysed (six of 59) produced reproduction numbers exceeding unity—a theoretical sine qua non for STD propagation. Admittedly, our use of reason for visit data to interpret trends is subject not only to confounding but also to classification error; in addition, use of volunteers as an approximation for true STD incidence does not have sufficient empirical support. However, triangulation of evidence using secular trend decomposition, sexual network structural analysis of more than 9000 individuals over four years, and reproduction number analysis, yields a consistent picture: chlamydia transmission in Colorado Springs between 1996 and 1999 seems to be somewhere between stable and declining. The strength and convergence of the evidence both support this assessment.
Network structure, particularly density of sexual connections, has previously been associated with intensity of STD transmission. In Atlanta, for example, Rothenberg and colleagues showed the link between network cohesion and syphilis transmission at both macro and micro structural levels.4 In Colorado Springs, we empirically demonstrated the link between enhanced chlamydia transmission and concurrency (overlapping rather than serial sexual partnerships12). Concurrency may be viewed as a special case of microstructural conformation. Finally, the gang associated STD outbreak recorded in Colorado Springs2, 3 clearly demonstrates the relation between dense network connectivity and epidemicity. Thus, intuitively, stochastically,17, 18 and empirically, network cohesion seems to be strongly predictive of STD transmission intensity.
Association of low potential transmissibility with relatively fragmented, dendritic sexual networks lacking cyclic microstructures, and of densely connected networks containing many cyclic microstructures with high transmissibility, suggests an important role for network analysis in the accurate and rapid assessment of epidemic phase. Secular trend data based on case reports, artefacts notwithstanding, may require months or years of observation before reliable trends can be discerned. In contrast, a few months spent obtaining quality contact tracing data can provide a reliable network configuration that suggests epidemic phase. One can surmise, for example, that a network configuration comprising relatively large linear networks and moderate numbers of cyclic microstructures would support medium to high disease transmission.
It is possible that the network configurations we observed for our chlamydia infected population (essentially linear) and during the gang associated mixed STD outbreak (essentially cyclic) are artefacts of the specific STD's transmission dynamics. Brunham and colleagues argue mathematically that different STDs ecologically require different rates of partner change; specifically, chlamydia survives with a low rate of partner change, while gonorrhoea and syphilis require higher rates.19 Thus a different structural pattern could be expected for gonorrhoea compared to chlamydia, especially as higher rates of partner change would generate more microstructures. Because of the high rate of chlamydia co-infection within the principally gonorrhoea transmission environment of the gang outbreak in Colorado Springs (fig 4) we were unable to distinguish between epidemic intensity and an STD specific ecology. Although additional research is needed to settle this issue, we lean towards the former explanation. In the gang associated outbreak, chlamydial infection was diagnosed with pre-DNA amplification tests; we suspect that availability of such tests in 1990–91 would have nearly doubled the number of chlamydia diagnoses. Such a large (“true”) number of gang associated chlamydia diagnoses would be more likely to represent epidemic transmission than background prevalence, particularly at a time when vigorous chlamydia screening and contact tracing efforts had been in place in Colorado Springs for at least two years.
Accurate ascertainment of epidemic phase and its associated sexual network structure may provide the rationale for selection of specific interventions. For example, fragmented network structures consisting of many small components may respond more efficiently to targeted screening than to contact tracing, while densely connected structures may be more efficiently fragmented by contact tracing than by screening alone. Containment of the gang associated STD outbreak in Colorado Springs, for example, was strongly associated with saturation contact tracing.3 As previously argued,20 contact tracing should be used both as STD control and as an epidemiological tool. Periodic epidemic phase assessments using contact tracing data to elucidate network structure changes over time could not only inform changes in interventions but may also serve as a tool for impact assessment. Although this view may be theoretically sound, there is no substitute for empirical support; thus additional research designed to evaluate outcomes of network structure informed interventions is clearly needed.
For Colorado Springs, concentration of chlamydia contact tracing resources in its southern and southeastern areas and of screening efforts in venues frequented by its young constituents may segment transmission pathways and discourage both epidemicity and endemicity. Focusing control resources on very young African American men who choose partners of varied ethnicity seems of particular importance, as persons with these characteristics were also identified as crucial actors in the 1990–91 STD outbreak.2, 3
Sexual network patterns based on contact tracing information must be viewed with appropriate caution. As is generally true for contact tracing activity, not all cases were interviewed, not all sexual partners were named or correctly identified (because of marginal information), and the interview interval may have failed to capture important historical connections.
Ghani and colleagues used a modelling approach to argue that quality contact tracing information, despite its shortcomings, offers the best available opportunity to empirically assess network structure.21 Our data support their view. Network structural characteristics of chlamydia transmission in Colorado Springs between 1996 and 1999 were as clearly elucidated using routine contact tracing data as they were during the special observation period (1996–97) when intensity of contact interviewing and partner tracing was enhanced and interview interval length was doubled. Network structural patterns were shown to be similar. Differences in network geometry between the chlamydia and the gang associated networks were identified using the same epidemiological techniques (index case interviewing and contact tracing) in the same city by the same health department; thus contact tracing lacunae are not likely to account for differences in observed epidemic phase patterns.