Article Text

Abstract
Objective An estimated 4.9 million adults received antiretroviral therapy (ART) in low and middle income countries in 2009. A further estimated 700 000 adults received ART in high-income countries. The impact of providing ART is not often quantifiable due to limited monitoring systems. One measure, life-years gained, provides a standardised measure that shows the survival impact of ART on the population while controlling for variations in underlying survival. Measuring life-years gained allows a comparison of the impact of ART between regions.
Methods Using the Spectrum computer package, two different scenarios were created for 151 countries. One scenario describes the results of providing adults with ART as reported by countries between 1995 and 2009, the second scenario describes a situation in which no ART was provided to adults living with HIV between 1995 and 2009. The difference in the number of life-years accrued among adults in the two scenarios is compared and summarised by geographical region.
Results An estimated 14.4 million life-years have been gained among adults globally between 1995 and 2009 as a result of ART. 54 % of these years were gained in western Europe and North America, where ART has been available for over 10 years. In recent years the growth in life-years has occurred more rapidly in sub-Saharan Africa and Asia.
Discussion The substantial impact of ART described here provides evidence to argue for continued support of sustainable ART programmes in low and middle-income countries. Strengthening ART monitoring systems and mortality surveillance in low and middle-income countries will make this evidence more accessible to programme managers.
- AIDS
- antiretroviral therapy impact
- developing world
- life-years gained
- models
- mortality surveillance
This is an open-access article distributed under the terms of the Creative Commons Attribution Non-commercial License, which permits use, distribution, and reproduction in any medium, provided the original work is properly cited, the use is non commercial and is otherwise in compliance with the license. See: http://creativecommons.org/licenses/by-nc/2.0/ and http://creativecommons.org/licenses/by-nc/2.0/legalcode.
Statistics from Altmetric.com
Since the start of the HIV epidemic, an estimated 25 million people have died of AIDS-related causes. However, the annual number of persons dying of AIDS-related causes has been decreasing since 2005.1 In high-income countries the provision of antiretroviral therapy (ART) has reduced the number of deaths significantly.1a 2 However, at the population level, few published studies from low and middle-income countries have documented the impact of ART.3
Over the past decade there has been a remarkable increase in the availability of ART to persons living with HIV in low and middle-income countries.4 The number of adults on ART has increased from approximately 300 000 in 2002 to just under 5 million in 2009. The reported retention of individuals within ART programmes suggests that approximately 80% of patients stay in the programme for at least 12 months.5 Much of this increase is a result of governments utilising funding available from the Global Fund to Fight AIDS, TB and Malaria or the US government's President's Emergency Plan for AIDS Relief (PEPFAR).6 7 Measuring the impact of these global and national programmes is often difficult to quantify despite the importance of this evidence for continued funding. A summary measure of the overall reduction in mortality as a result of ART programmes is needed to substantiate the benefits of investing resources into ART programmes.
Using country-level data we estimate the survival impact of providing ART to approximately 6 million adults globally (5.3 million adults in low and middle-income countries and 700 000 adults in high-income countries).4 We estimate life-years gained among adults as a result of the availability of ART by region. The number of life-years gained captures the duration of life extended because of treatment and is thus an appropriate measure of impact for diseases that affect younger populations.
Methods
During 2009 and 2010 UNAIDS and partners collaborated with country teams to estimate HIV incidence and prevalence and the impact of HIV on their populations. The estimates were developed through two software packages: the Estimation and Projection Package (EPP) and Spectrum. Country teams used the software to create country-specific estimates and projections.
Data required as input into EPP include HIV prevalence data and for concentrated epidemics the size estimates of the populations most at risk of HIV. Data required for input into the Spectrum model include national HIV incidence data generated by EPP, the annual number of adults receiving ART, the annual number of women receiving antiretroviral prophylaxis to prevent mother-to-child transmission and the annual number of children receiving ART. The annual number of people on ART as reported by governments includes those individuals who were receiving ART at the end of the year. Differences from year to year reflect those who have newly initiated ART and those who have died or have been lost to follow-up from the ART programme.
The country files submitted to UNAIDS in 2010 were used for this analysis as well as to create the estimates released by UNAIDS in November 2010.1 For countries that did not submit files or were not part of the training process, files were created based on the best available information from that country.
Full descriptions of EPP and Spectrum are provided elsewhere in this supplement.8 9 Here we provide a brief overview. HIV incidence curves are generated in EPP based on HIV surveillance data and national ART coverage data. EPP fits a curve to the available HIV surveillance data creating a national HIV prevalence curve. HIV incidence is then calculated from the HIV prevalence using the ART coverage data to account for the longer survival of individuals who are on therapy. HIV incidence estimated from EPP is used in Spectrum to derive age and sex-specific HIV prevalence, which is applied to the population over time.
The Spectrum computer package is a discrete, compartmental model that progresses the population by age group through different stages.10 Spectrum version 3.52 was used for this analysis. The population data come from the UN Population Division's UN Population Prospects 2008 Revision and include populations in 5-year age groups as well as age-specific fertility rates and mortality rates for individual countries. Spectrum calculates the number of deaths caused by AIDS while applying underlying (non-AIDS) mortality to those who do not die of AIDS-related causes. The underlying mortality is estimated from non-AIDS life expectancy and model life tables prepared by the UN Population Division.11
The population is initialised in the year 1970 to ensure the full impact of the HIV epidemic is captured in the model. Individuals move between four stages in Spectrum: HIV negative, HIV positive and asymptomatic, HIV positive and in need of treatment (need of treatment can be varied depending on the country's guidelines) and dead. Individuals progress from seroconversion to need for ART based on progression curves that reflect an ART eligibility criteria of 200 CD4 cells/mm3 (in use by most countries throughout the period of analysis). Once an individual is in need of treatment they are initially in need of first-line therapy. If they fail on first-line therapy they progress to being in need of second-line therapy. If they fail on second-line therapy they progress to death. Individuals who do not receive therapy progress to death over 1.5 years for men and 2 years for women. Individuals receiving therapy (either first or second line) have a 86% chance of surviving the first year and a 90% chance of surviving subsequent years. Mortality due to AIDS only occurs to individuals who are in need of treatment or are receiving treatment. Mortality of those lost to follow-up from the ART programme is captured in the survival parameters.12 As a result of limitations with the current software it is not possible to distinguish different survival times based on the distribution of CD4 cell levels at the start of ART. Individuals are subject to the probability of dying of non-AIDS-related causes at all stages. More detailed descriptions and sources for the parameters used in Spectrum are available elsewhere.9 12
One of the features of Spectrum is that it allows the user to create different scenarios by altering country-specific programme coverage. Two scenarios were generated for this analysis. In the first scenario adults are provided ART as reported by countries between 1995 and 2009, in the second scenario adults receive no ART at any point during the time period. The two scenarios are identical except for the provision of ART. The estimated annual number of life-years gained is estimated by calculating the difference in the number of people alive in the same year for the two scenarios. We cumulate the difference of life-years over time to estimate the survival impact of ART. Regional and global values of life-years gained were calculated from country estimates. The countries included in each region are defined based on UNAIDS regional classifications, which are collapsed to simplify the presentation of the results. A total of 151 countries was included in this analysis (countries with a population of less than 250 000 were excluded). The list of countries can be found within the supplementary annexe (available online only).
A point estimate of the number of persons alive aged 15 years and older is calculated for each country, for each year, for both scenarios. These values will have a certain amount of uncertainty based on the variables used in the model to calculate the point estimate. Spectrum calculates uncertainty bounds (UB) for the point estimates by running 1000 Monte Carlo runs using randomly selected parameter values from within a set range. The uncertainty calculations are described elsewhere.13 For this analysis we have applied the uncertainty bounds based on the difference in people living with HIV for the two scenarios. The uncertainty bounds are calculated separately for each region.
Children are not included in this analysis because of the complexity of adjusting for fewer HIV-positive births as women on ART live longer but are less likely to transmit HIV to their children. The benefits of increased ART coverage reduce the overall life-years gained from ART as fewer children are infected with HIV. By restricting this analysis to adults over the age of 15 years we avoid this complexity.
Results
Annual life-years gained
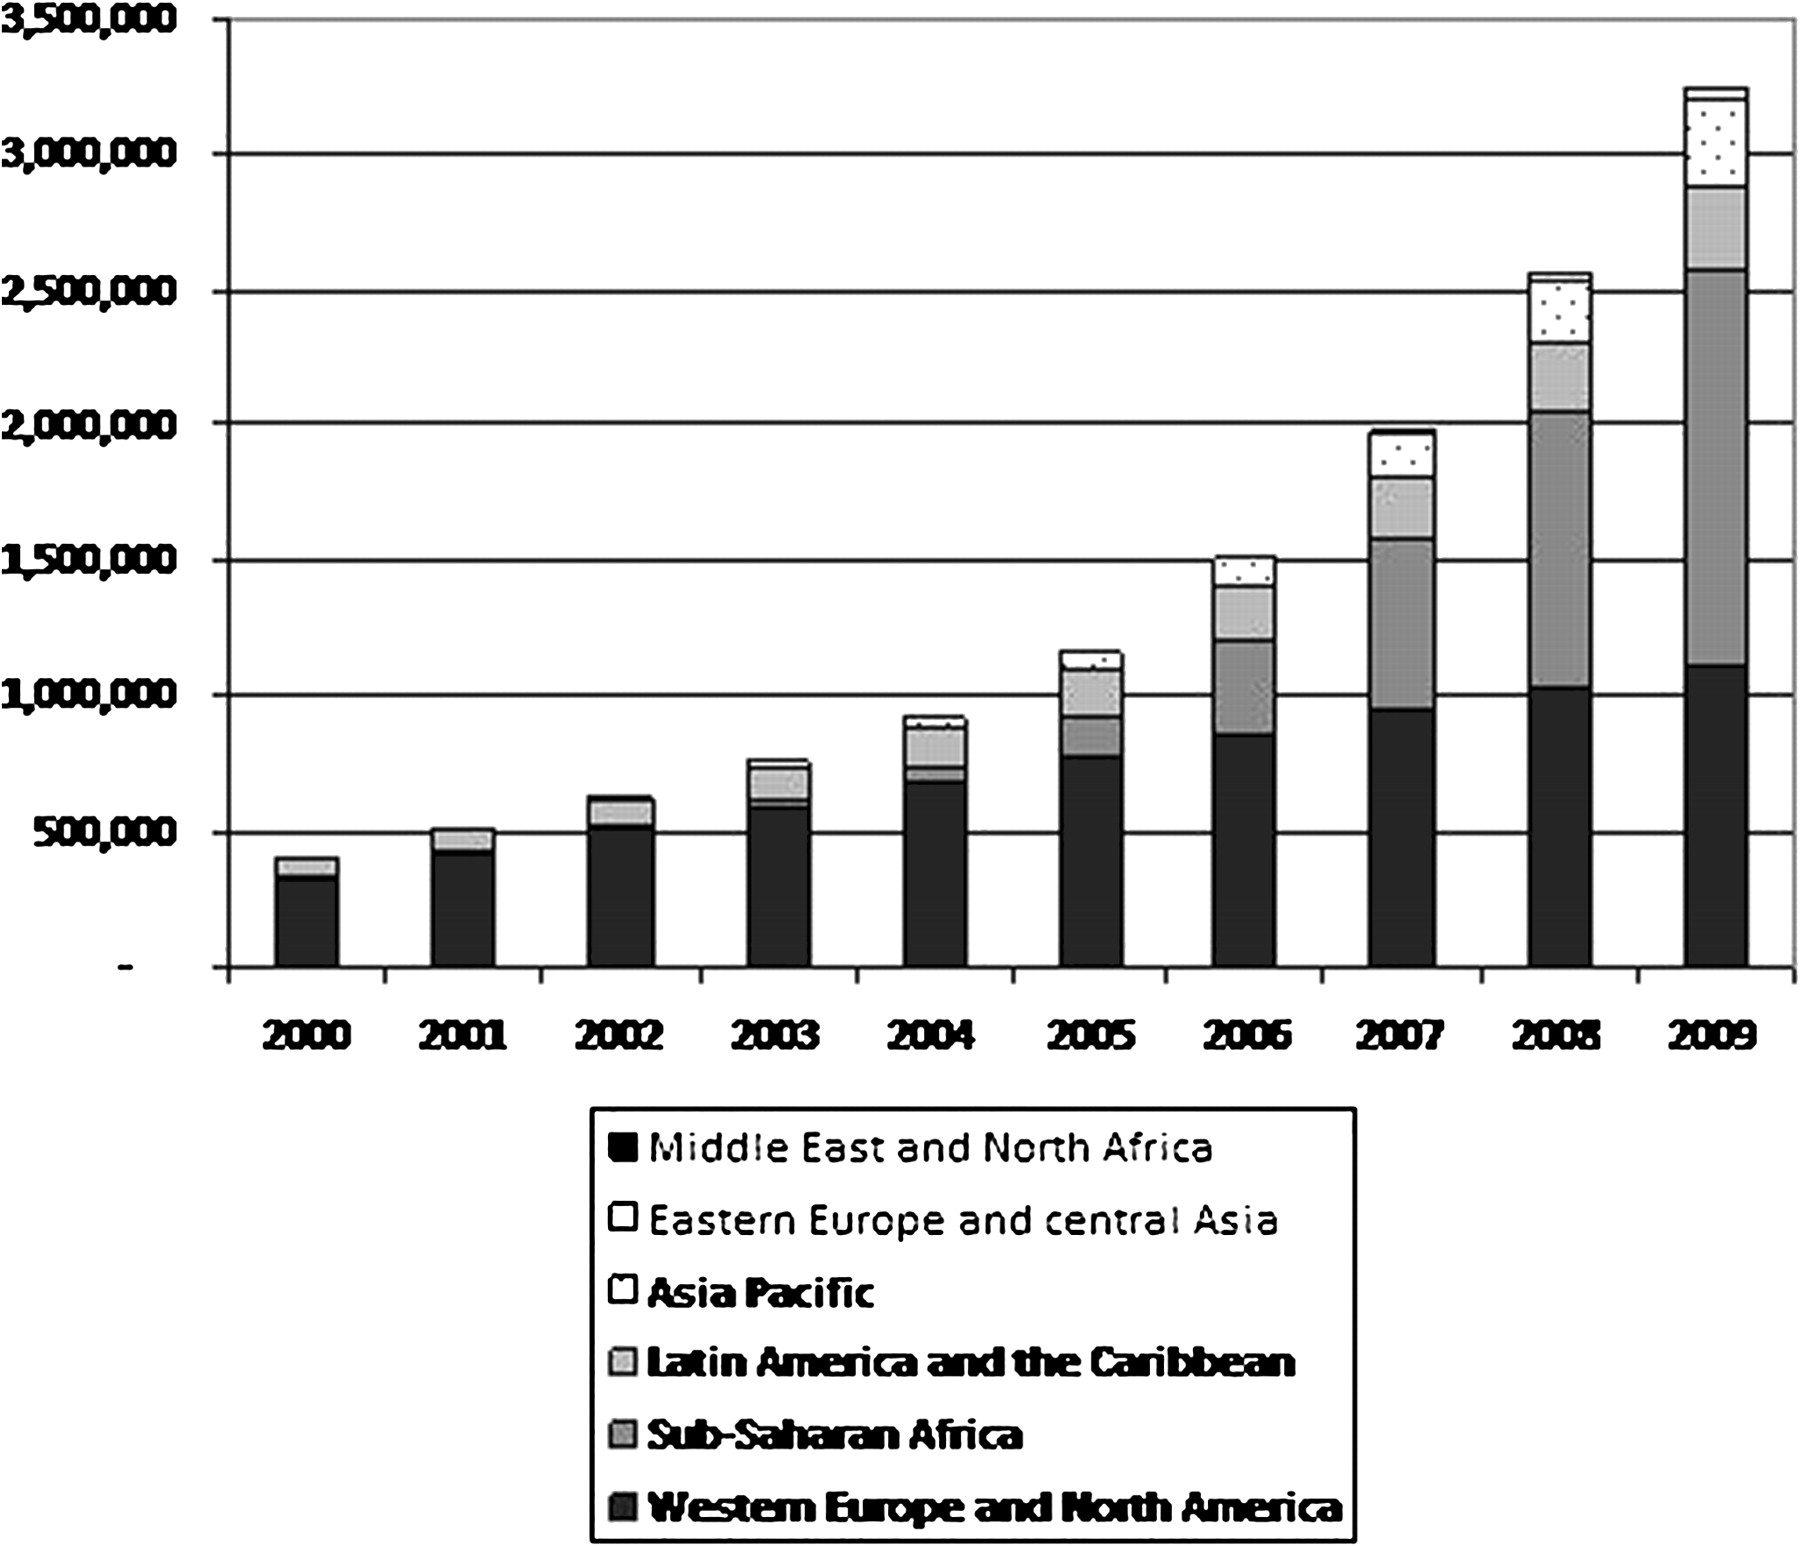
Figure 1 shows the change in the annual number of life-years gained by region over time. The annual number of life-years gained as a result of ART programmes increased ninefold between 2005 and 2009 in sub-Saharan Africa (from 155 000 to 1 465 000 (UB 1 291 000 – 1 602 000)), whereas in eastern Europe and central Asia the number of annual life-years gained increased by over 16-fold (from 2000 to 38 000 (UB 34 000 – 42 000)). In other regions the annual number of life-years gained in 2009 were 1 114 000 (UB 959 000 – 1 282 000) in western Europe and North America, 301 000 (UB 247 000 – 327 000) in Latin America and the Caribbean, 326 000 (UB 280 000 – 368 000) in Asia Pacific, and 5600 (UB 5,000 – 6,200) in the Middle East and North Africa.

Annual number of life-years gained among adults due to antiretroviral therapy, by region, 2000–2009.
In 2002 over 80% of annual life-years gained were in western Europe and North America and only 2% were in sub-Saharan Africa. In 2009 34% of life-years gained were in western Europe and North America and 45% of life-years gained were in sub-Saharan Africa. In 2009 9% of life-years gained were in Latin America and the Caribbean, 10% were in Asia Pacific, 1% were in eastern Europe and central Asia, and less than 1% were in the Middle East and North Africa.
Cumulative life-years gained
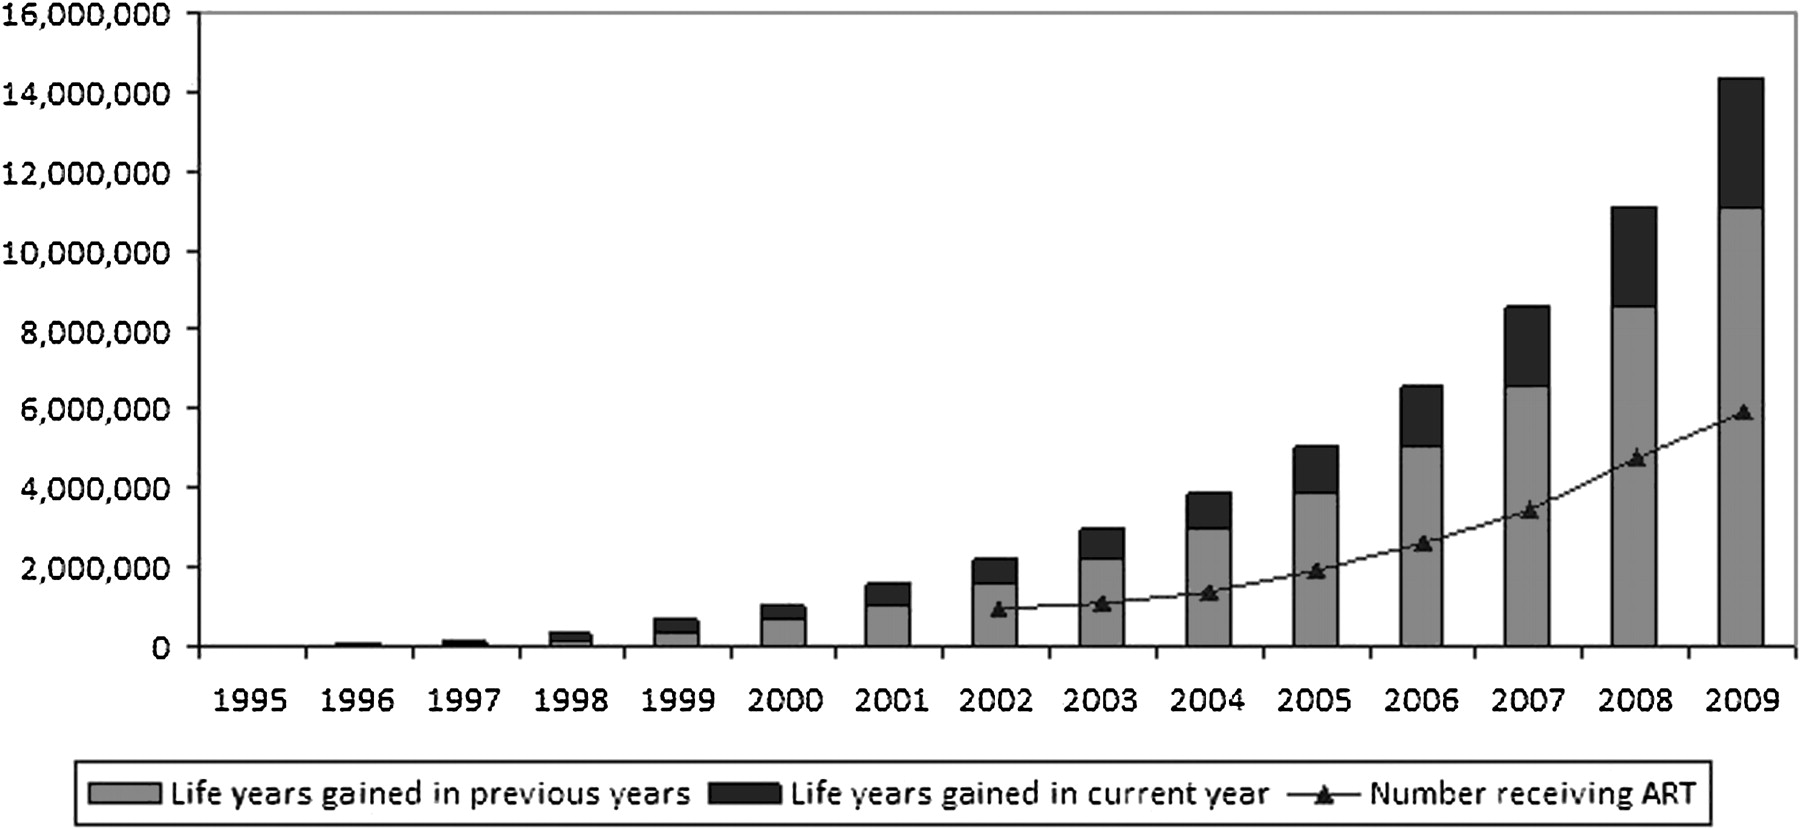
A more complete summary of the gains from ART are described by estimating the cumulative life-years gained since ART was available. Between 1995 and 2009 an estimated 14.4 million (UB 13.1 million – 15.6 million) life-years were gained as a result of the provision of ART. The cumulative number of life-years gained increased rapidly between 2005 and 2009, reflecting the increasing number of adults on ART globally (low, middle and high-income countries), which grew from 1.9 million in 2005 to 6 million in 2009 (figure 2).

Cumulative number of life-years gained among adults due to antiretroviral therapy (ART), 1995–2009.
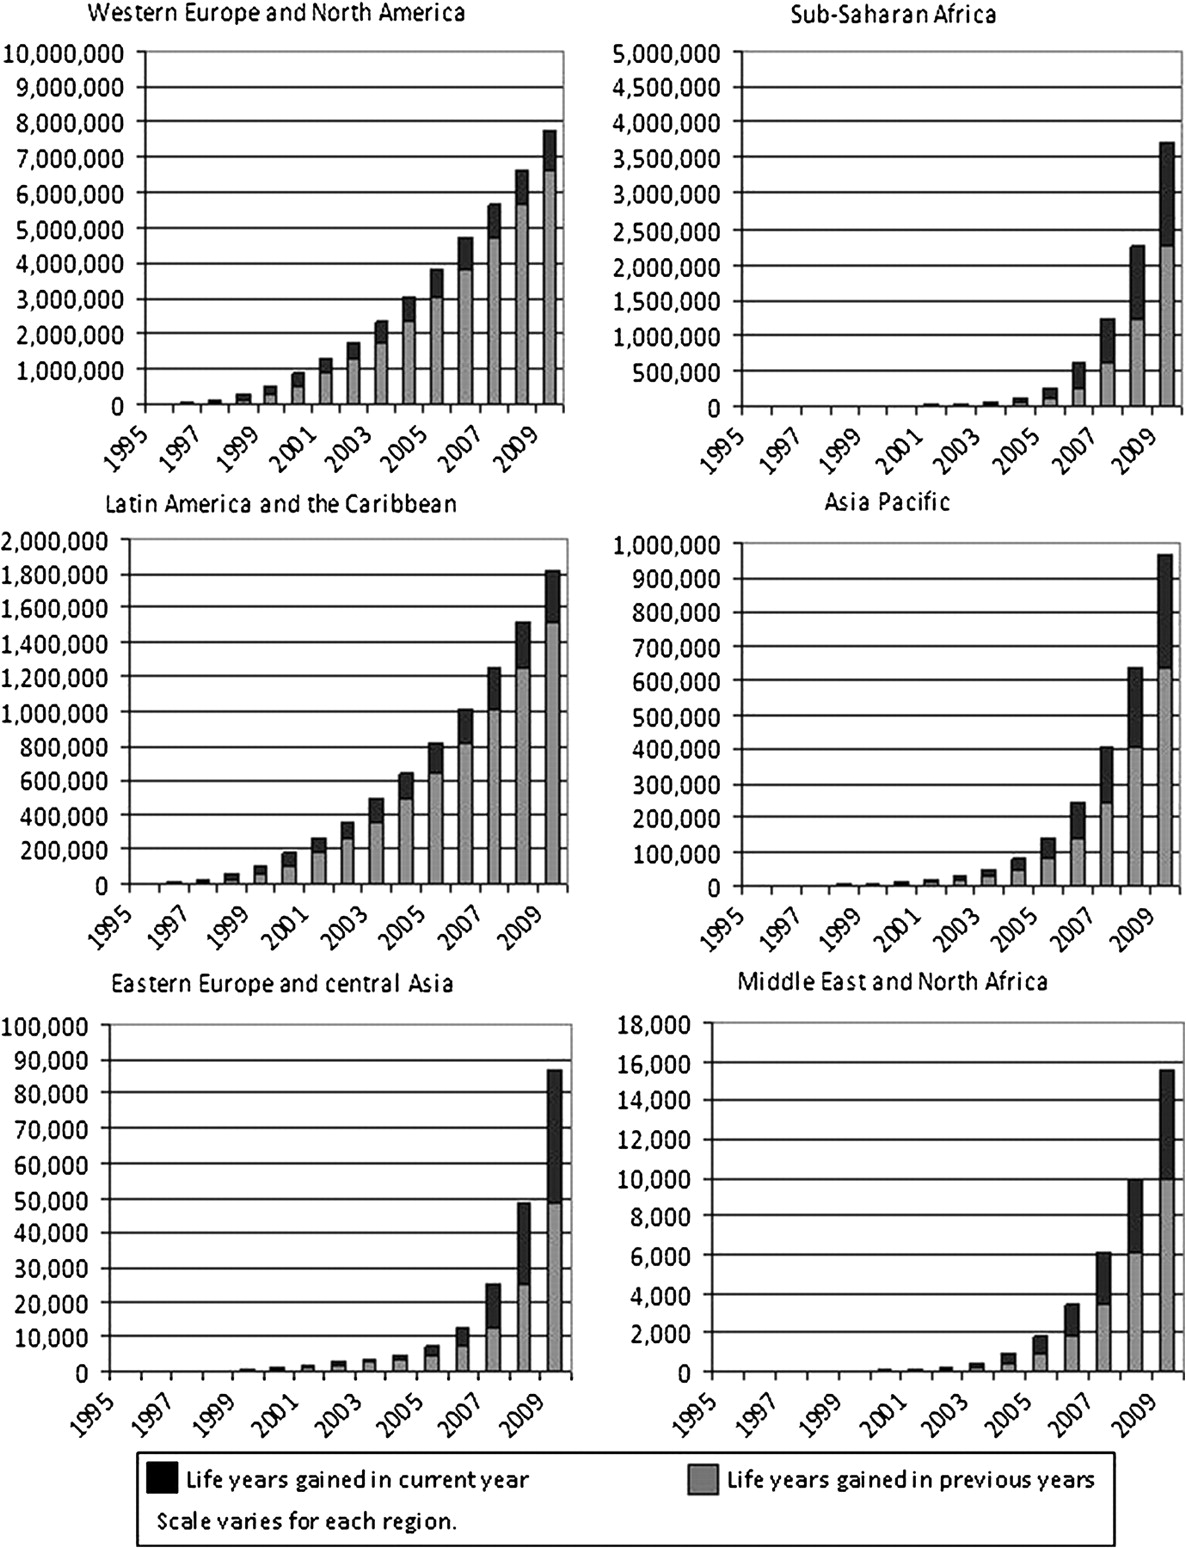
Figure 3 shows the cumulative number of life-years gained by region as of 2009. The increase in the number of life-years gained has been dramatic in some regions and more gradual in others. In all regions except western Europe and North America and Latin America and the Caribbean there was over a 50% increase in life-years gained in 2009 alone. In Latin America and the Caribbean, and western Europe and North America there were more life-years gained early in the epidemic. Figure 3 also shows the rapid increase in life-years gained over time in sub-Saharan Africa, home to more than two-thirds of people living with HIV in 2009.

Life-years gained in current year and in previous years among adults due to antiretroviral therapy, by region, 1995–2009.
ART programmes in sub-Saharan Africa have saved over 3.7 million life-years (UB 3.4 million – 4.0 million) since they became available. Whereas in western Europe and North America 7.8 million life-years (UB 6.9 million – 8.9 million) have been saved. In Latin America and the Caribbean 1.8 million life-years (UB 1.4 – 1.9 million) were gained and in Asia Pacific approximately one million life-years (UB 847 000 – 1 071 000) were gained. Eastern Europe and central Asia and the Middle East and North Africa had smaller gains at 87 000 (UB 77 000 – 98 000) and 16 000 (UB 14 000 – 17 000), respectively (table 1).
Estimated number of adults living with HIV and estimated life-years gained due to antiretroviral therapy, by region, 1995–2009
Discussion
Between 1995 and 2009 adult ART programmes resulted in an estimated 14.4 million life-years gained (UB 13.1 million – 15.6 million). More life-years were gained in high-income countries (western Europe and North America) compared with the other regions. This difference could be due to a number of factors including increased accessibility of ART programmes in high-income countries and more aggressive eligibility criteria in high-income countries resulting in longer survival time once they are on ART13a and, in countries with mature epidemics, a larger proportion of the HIV population has progressed to later stages of infection increasing the potential cumulative life-years gained.
Between 2003 and 2009 there was a dramatic increase in the number of life-years gained, especially in eastern Europe and central Asia and sub-Saharan Africa. This coincides with the rapid roll out of ART as a result of the WHO's ‘3 by 5’; campaign, which improved access to ART in low and middle-income countries,14 as well as increased resources through the Global Fund to fight HIV/AIDS, TB and Malaria and the USA's PEPFAR initiative. Before 2003 most of the life-years gained occurred in western Europe and North America where ART has been available for over 10 years.
This analysis provides a measure of the global benefits of ART programmes. Currently, the globally recommended indicators related to ART measure the proportion of people who receive treatment among those in need and the proportion of those who are still on treatment after 12 months among those who started treatment.15 Although these indicators are important for monitoring programmes, they fail to capture the population-level survival impact of ART.
Surveillance of adult mortality, either cause specific or all cause, would be more appropriate to determine the success of ART programmes. Direct measures of adult mortality can be captured through vital registration systems; however, very few countries have vital registration systems that are reliable or from which cause-specific mortality is available.16 Cohort studies or demographic surveillance sites have shown decreases in mortality for small areas but do not measure the national, population-level effect of ART.1 17 18 Some creative attempts have been made to measure AIDS mortality through other sources such as burial societies and sales of coffins; however, these are not reliable sources of data for most countries.19 20 Verbal autopsies and sibling survival histories can be added to household surveys to derive population-based estimates of AIDS-specific mortality.21 22 Ideally, national ART programmes would strengthen their monitoring and evaluation efforts to measure and report outcomes of their patients. However, even with strengthened monitoring systems, capturing information on deaths among patients in the programme excludes individuals who never made it to the clinic or individuals lost to follow-up from the ART programme.
When direct measures are not available from existing sources, models can be used to estimate the impact of ART programmes.23 24 Demographic models, such as Spectrum, make it possible to capture the change in life expectancy or life-years gained—both measures that describe the advantage of saving young lives.
The data used for this analysis have a number of limitations. Data sources for HIV prevalence are used to provide the estimate of national HIV incidence. These data are often incomplete and imperfect in countries.25 The data provided by countries on the number of people on ART are also critical to determining how many life-years were gained over time. The quality of the ART data in some countries is poor because reporting systems are not fully functional.26 In some instances countries are not able to separate the number of people who started on ART but who were lost to follow-up from the programme or died. For the 2009/10 round of HIV estimates the programme data used in Spectrum on the number of people on ART were reconciled with data available from country reports on commitments to the United National General Assembly Special Session on AIDS, Universal Access Report and PEPFAR reports. This reconciliation exercise in 2010 has provided the best available data since reporting on national ART programmes from low and middle-income countries began.
The default parameters used in the Spectrum models are derived from studies that often only cover a limited number of countries or regions. These parameters are based on the best available information at the time and are constantly reviewed and updated by the UNAIDS Epidemic, Modelling and Projections Reference Group. However, more validation of the Spectrum models is needed against empirical data to improve these assumptions and subsequent analyses. The number of life-years gained in this analysis is probably an underestimate as the counterfactual model does not capture the reduced number of infections as a result of reduced transmission as more people are receiving ART. When ART coverage is low this will not have a large effect but as ART coverage is increased this effect on transmission is likely to be significant.
In conclusion, the large number of life-years gained provides population-level evidence of the dramatic benefits of ART programmes. This information should encourage decision-makers to continue investing in sustainable ART programmes in all regions. As more countries adopt the WHO recommended ART eligibility criteria of CD4 cell counts less than 350 cells/mm3 the number of life-years gained will grow, especially in low and middle-income countries.27
Key messages
ART has saved an estimated 14 million life-years between 1995 and 2009 among adults.
Between 1995 and 2009, the vast majority of adult life-years gained as a result of ART occurred in western Europe and North America.
The largest gains in adult life-years as a result of ART occurred between 2005 and 2009.
Acknowledgments
This paper benefited from useful comments provided by Eleanor Gouws. The authors are grateful to the country teams who produced the initial Spectrum files.
References
Footnotes
Competing interests None.
Provenance and peer review Not commissioned; externally peer reviewed.