Article Text

Abstract
Background: UNAIDS has developed the Estimation and Projection Package (EPP) as a tool for national programmes to use for making national estimates and short term projections of HIV prevalence. EPP provides direct input to Spectrum, which produces incidence, deaths, and AIDS impacts.
Methods: The latest version, EPP 2005, includes substantial methodological improvements over the previous version. These include: (1) parallel, but unique, interfaces for generalised and concentrated epidemics; (2) use of maximum likelihood fitting procedures; (3) a new procedure, known as level fits, adjusting for expansion of national surveillance systems into lower prevalence sites; (4) provisions for handling turnover in at-risk populations, including the reassignment of HIV positive former members to lower risk populations; and (5) user-defined calibration to HIV prevalence levels from general population or other epidemiological surveys.
Results: Following regional training in mid 2005, this new version has been applied by many national programmes to make their end of 2005 estimates of HIV infections. UNAIDS has combined these national estimates to form the 2005 global HIV and AIDS estimates.
Conclusion: EPP 2005 is a substantial improvement over previous versions, forming a solid base for the next round of modifications. Proposed modifications for that next version are presented for the reader’s information.
- EPP, Estimation and Projection Package
- UNAIDS, Joint United Nations Programme on AIDS
- HIV/AIDS modeling
- national estimates
- projection
- surveillance
Statistics from Altmetric.com
The Joint United Nations Programme on AIDS (UNAIDS) developed the UNAIDS Estimation and Projection Package (EPP) as a tool to assist national programmes in estimating and projecting the course of the HIV epidemic in their countries. The package has been through multiple versions, adapting over time as understanding of national epidemics improved and new issues arose during its application in the field. The earliest versions of EPP, based on gamma functions and combinations of logistic curves, were only used in-house by UNAIDS because they overestimated the rate of HIV decline in epidemics. Based on the experience in applying these early models, the UNAIDS Reference Group addressed their limitations by creating a more epidemiologically realistic model for HIV spread,1 which could reproduce the stable high level HIV epidemics observed in many African countries.2–5
The first public release of EPP by UNAIDS in late 2001 used this Reference Group model to fit trends to generalised epidemics that were composed of separate urban and rural subepidemics. Ghys et al6 described the subsequent 2003 version of EPP, which gave users the ability to define their national epidemics in locally relevant terms with various user-defined geographic or subpopulation subepidemics instead of limiting them to urban and rural components. The basic description of the interface and the underlying Reference Group model in that paper is still largely relevant to the current version, EPP 2005. This paper will complement that earlier work by describing changes made to the package since 2003 and the rationale for those changes. The EPP 2005 software and manuals can be downloaded from the UNAIDS website if readers wish to apply it to their own data sets (http://www.unaids.org).
EPP is usually applied by national programmes in conjunction with the Spectrum program.7 EPP provides a fit to the adult prevalence data entered by the user, applying appropriate adjustment and calibration procedures such as the level fits described herein, and then generates a prevalence output file for Spectrum’s use. Spectrum reads this file and then applies a more demographically correct population model to the prevalence trends to produce annual HIV incidence, prevalence, and HIV related deaths, including both adults and children, and other important HIV impacts.
Limitations observed in the field
In 2001 and 2003, UNAIDS, WHO, and their national programme counterparts used EPP to produce the biannual global estimates for most heavily affected countries with generalised epidemics.8 A few countries with epidemics of a more concentrated nature have also applied EPP to national estimates—for example, Cambodia, Myanmar, and Vietnam. In field application and in regional trainings on EPP, a number of issues arose that the UNAIDS Reference Group on Estimates, Modeling and Projection decided to address in the latest release of the software. These included:
-
Expansion of surveillance systems into lower prevalence areas. In many countries, surveillance systems have been expanding over time to include more sites;5 however, the choice of surveillance sites is not random. Surveillance systems normally start out with sites in predominantly higher prevalence urban settings, and later establish sites in lower prevalence peri-urban and rural settings. If one fits a curve to all of the prevalence sites over time, this will tend to give the fitted prevalence an artificial downturn because the inclusion of lower prevalence sites brings the average down, even though trends in the earliest sites may have stayed high. This issue was arising frequently enough that it was felt the EPP software should try to address it.
-
Overestimation of generalised epidemics. As increasing numbers of African countries have conducted general population HIV prevalence surveys in recent years, it has become apparent that surveillance systems, largely based on pregnant women in urban and peri-urban areas, have overestimated the magnitude of the national epidemics.9 The Reference Group decided that EPP 2005 should have the ability to recalibrate the trends fitted from antenatal data so that the fitted HIV prevalence in the survey year agreed with the appropriate urban and rural levels measured during the general population survey.
-
Failure to capture the dynamics of turnover in concentrated epidemics. At-risk populations in many concentrated epidemics tend not to be stable—people move in and out of these populations frequently. Sex workers often work for a few years and then return to the general female population. Men are sometimes very active clients of sex workers for a period before they get married and greatly reduce or stop such activities after marriage. Some injecting drug users stop injecting or switch to non-injecting drugs, while new initiates are constantly taking up injecting. In the process of trying to estimate the epidemic in many concentrated settings, it became clear that HIV positive former at-risk population members might be contributing substantially to HIV prevalence in lower risk populations. For example, if sex workers have a high HIV incidence but then exit sex work, return to the general female population, and become pregnant, antenatal surveillance will capture the infections contracted during sex work. This will raise the overall prevalence among pregnant women. Such effects can become quite large in low prevalence concentrated epidemics. Early estimates for Thailand showed that perhaps one fifth of antenatal clinic infections might have come from ex-sex workers, and about 5% of male prevalence from ex-injecting drug users.
The Reference Group reviewed these issues in a series of meetings in 2004 and suggested modifications to the 2005 version of the EPP to address them. The next section describes these changes in detail.
An overview of EPP 2005 and its new features
The basic interface of EPP 2005 consists of nine key pages, which take the user through the steps of preparing a national set of projections:
1. the Workset page where the user selects a country and specifies where to store the results;
2. the Define Epidemic page where the user constructs the national epidemic from locally relevant geographic and subpopulation subepidemics;
3. the Define Pops page where size and demographic information is given for each subepidemic;
4. the Enter Data page where HIV prevalence data and sample sizes are entered;
5. the Project page where the actual curve fitting is done for prevalence trends in each specified subepidemic;
6. the Calibration page—new in EPP 2005—where the prevalence level for the national epidemic is adjusted to fit measured population prevalence;
7. the Results page, where prevalence, incidence (new in EPP 2005), and population trends are displayed and numerical results made available;
8. the Audit page, where checks are made for concentrated epidemics to ensure population sizes, maximum HIV prevalence, and male:female ratios are reasonable given global experience.
9. the Prefs page—new in EPP 2005—where the user can change default demographic parameters, HIV survival parameters, and samples sizes for key populations. The user can also change the language on this page. EPP 2005 supports Chinese, English, French, Russian, and Spanish interfaces.
Interwoven within these pages, through modification to the related pages in the 2003 version of the software, is the ability to address the key issues outlined in the preceding section.
Addressing expansion of surveillance systems: level fits
If the surveillance system expands, one way of approaching this in EPP 2003 was to fit each site’s time series of data separately, applying the appropriate population from the site’s catchment area, and then to combine these within EPP. However, this is time consuming and trends in individual sites can show tremendous variability given a single site’s comparatively small sample size. Furthermore recently added sites may only have one or two points of data, so it is difficult to determine a “trend”.
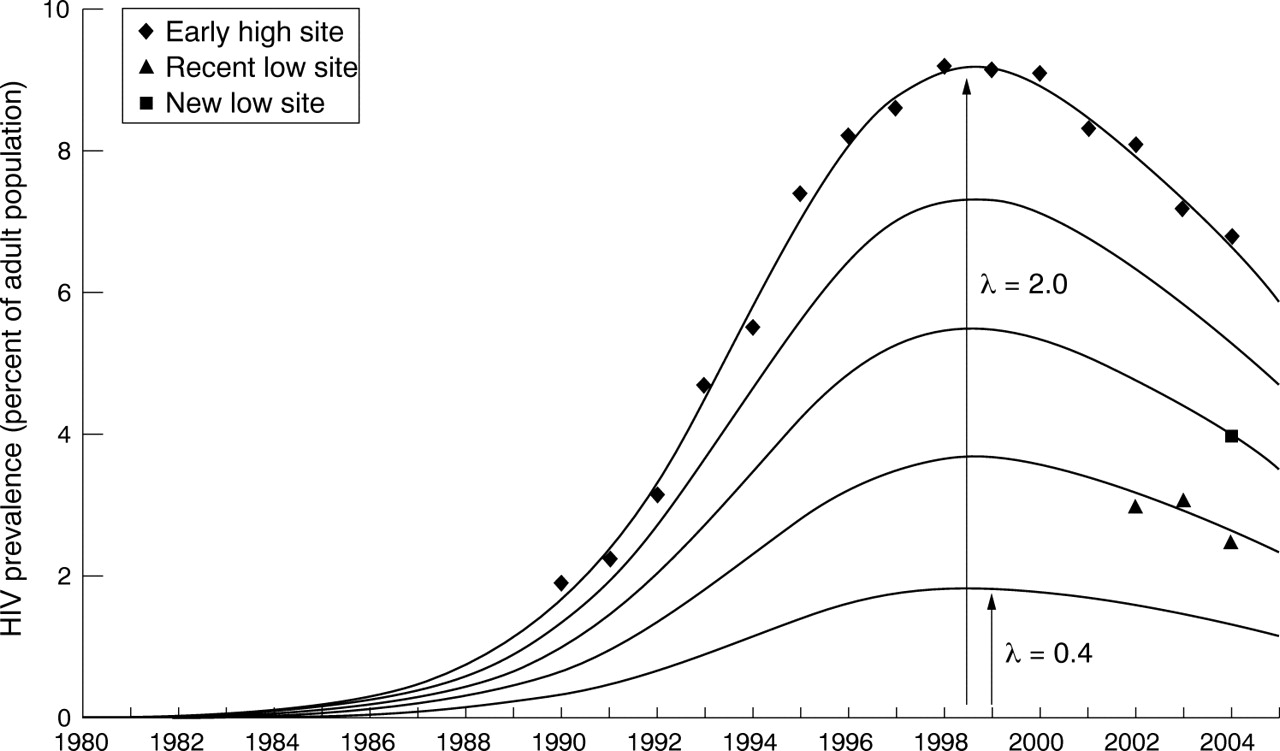
The alternative approach implemented in EPP 2005 is called level fitting, a procedure developed by one of the authors (N Grassly). Levels fits are based on the approximation that, while there are variations in absolute prevalence levels from one site to the next, the overall trend of rising and falling prevalence is the same throughout the region being modeled, for example, all sites in urban Uganda are assumed to follow a similar prevalence pattern over time. The solid curves shown in figure 1 illustrate this concept. Each curve represents a different level of the epidemic, but the overall temporal trend of rise and fall is the same. In fact, if p̃(t) is the function describing the shape of this curve over time, then the top curve is given by 2.0 p̃(t), and the bottom curve is specified by 0.4 p̃(t). To make level fits one then assumes that the epidemic for the region being modeled is the sum of a number of curves for individual sites with different levels, λi, that is, the overall regional epidemic curve, p(t), is given by:

Sites with long runs of data will contribute substantially to determining the shape of the underlying curve, p̃(t), while the lower prevalence sites recently added with relatively short data runs will help in bringing down the overall regional prevalence level when they are summed to form the regional epidemic.
Mathematically, EPP implements this by leaving the individual λi as free parameters that are fit along with the usual Reference Group model parameters1,6 using a maximum likelihood method (see the Appendix for the equation maximised). During the fitting procedure within EPP a final value for λi for each site is calculated to maximise the likelihood function. These λi then say how high or low a given site is above the average best fit prevalence curve. EPP then sums the levels for each site and applies them to the prevalence pattern automatically to give the overall prevalence for the region modeled.
Figure 2 illustrates the impact of this in a rather dramatic way with an example in which the surveillance system is expanded substantially in the early 2000s with many new low prevalence sites.
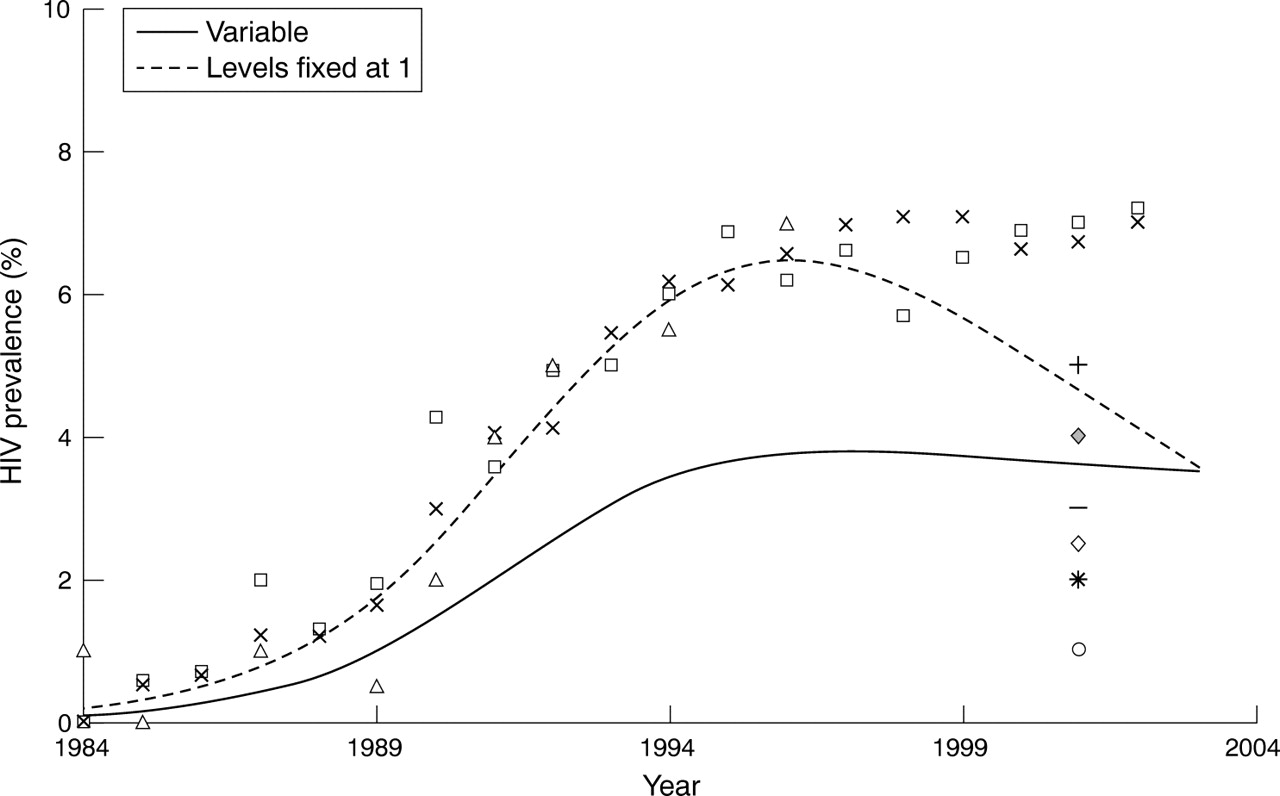
It is clear in this figure that the sites which have been running since the early mid-1980s show a pattern of rising to approximately 7% and then leveling off. However, when one applies the EPP 2003 fitter to these, the fitted curve turns down around 1995 because the lower prevalence values in the sites added in the early 2000s force the curve to fall. However, when the level fitting procedure is applied, the overall shape of the curve remains as it was with the early sites, but the overall level of the epidemic is brought down more in line with the average of the prevalence values from all of the sites in the early 2000s. This gives EPP 2005 the capacity to better adjust for the recently added lower prevalence surveillance sites seen in many countries. Figure 3 shows an example of the application of this approach to actual country data from Kenya, demonstrating how the use of level fits as lower prevalence surveillance sites are added produces a plateauing prevalence curve rather than a declining one.
Incorporating turnover in concentrated epidemics
The fact that at-risk populations are not stable and closed populations has at least two major epidemiological consequences. Firstly, the incidence in an at-risk population must be higher than it would be in a closed population. New uninfected members are entering to replace older members of the population who retire, many of whom are already HIV positive if the HIV prevalence in that population is high. These newer members will tend to dilute the HIV prevalence. However, in few at-risk populations do we actually see prevalence declines. Normally prevalence—for example, among injecting drug users or sex workers, tends to rise to a high level and stay there unless there is substantial behaviour change. If many infected people are leaving the at-risk population by stopping their risk behaviour rather than by death, then the overall incidence in the group must be much higher to sustain the prevalence than would be the case in a closed population.
Secondly, former at-risk population members with HIV are contributing to HIV prevalence in other groups. With the high incidence mentioned above, many HIV positive members leave the at-risk population without dying. These infections among former at-risk population members must be contributing to the HIV prevalence levels in other populations. For example, many sex workers with HIV will quit sex work every year. Since most of these women are still fertile, many of them will later be detected during antenatal clinic surveillance. However, not all former at-risk population members will be captured in surveillance systems. Former injecting drug users and former male clients of sex workers will return to the “general male” population, but surveillance in the general male population is rarely done. Thus, these infections will not be detected in surveillance, but will definitely contribute to adult prevalence in the country.
With the goal of implementing turnover with minimal additional data requirements, the user wishing to include turnover is required to take three steps in EPP 2005:
-
Decide if a given population has turnover. Yes or no? This is determined by selecting either turnover “on” or “off” when defining the populations in a concentrated epidemic.
-
Specify how long on average people stay in the at-risk population. To specify this, the user enters the average time spent in the group in years, d, when defining population characteristics.
-
Select the lower risk population to which at-risk group members return. The user selects the group to which they return on the calibration page for concentrated epidemics. For example, former sex workers might be assigned to general population women.
It is worth noting that adding these features into EPP 2005 made it necessary to give the program two separate “personalities”—one for generalised epidemics and the other for concentrated epidemics. When the user is in generalised mode, the assumption is that the populations are closed and that turnover is not possible. When the user is in concentrated mode, turnover can be specified for any population by taking the three steps specified above, although it is not required.
The user must answer one final question when using the turnover features: are the infections contracted while members of at-risk populations reflected in the surveillance in the lower risk population to which they return? As mentioned above, this is usually the case for HIV+ former sex workers, whose infections are normally captured in antenatal surveillance. However, surveillance rarely captures former male clients or male former IDUs because there is such limited surveillance of low risk male populations. EPP 2005 can handle either of these cases. If the infections are already reflected in low risk population surveillance, EPP 2005 calculates how many infections came from transmission within the low risk population itself by subtracting off infections contracted in at-risk populations, which gives the extent to which other risks are contributing to infections in low risk populations. If they are not reflected, EPP 2005 calculates the number of current infections due to former at-risk population members and adds them to the HIV positives in the low risk populations.
Once the user takes these steps to use turnover, a proportion, 1/d, of members of the at-risk population leave each year and are replaced by members of the lower risk population. For example, if the average time women remain as sex workers is five years, then 20% of the sex workers turn over each year. EPP 2005 then automatically tracks HIV positive at-risk population members when they leave the at-risk group, applies AIDS and background mortality to them, and then puts these infections into the selected return group. The mathematical equations describing this process are shown in the Appendix.
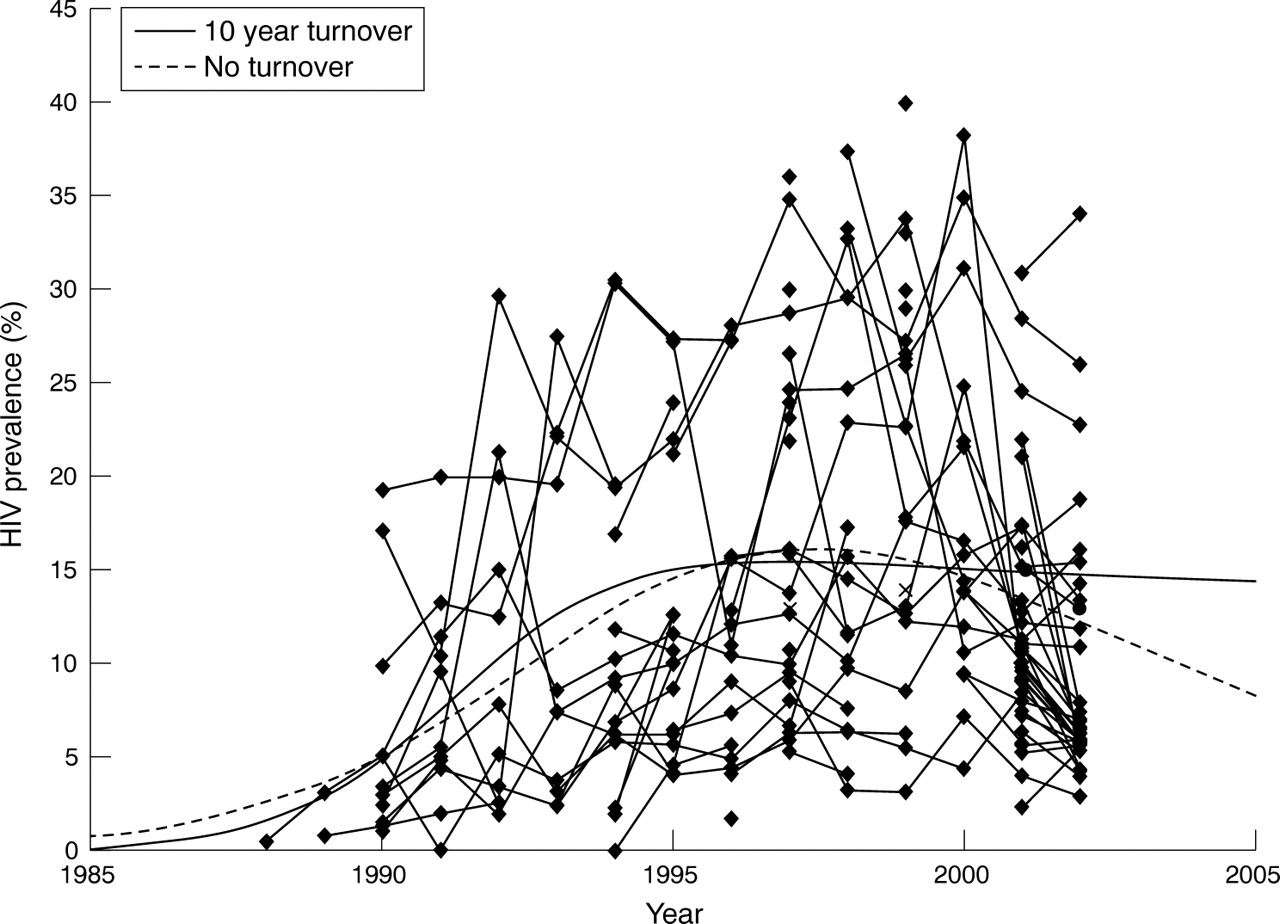
The incorporation of turnover into EPP 2005 makes a qualitative difference in the types of fits achievable, especially for populations such as injecting drug users who tend to plateau at an extremely high HIV prevalence that usually does not decline substantially over time. Figure 4 shows data from Central Thai drug users and the fits that result with and without turnover. When fit without turnover, no choice of parameters prevents the curve from declining. This is because in a closed population with 35–40% HIV prevalence, HIV induced mortality will inevitably lead to depopulation. With turnover, however, it is possible to obtain much more stable fits, which stay high for extended periods. This is more in keeping with the observations of trends in IDUs in most parts of the world.
Calibrating HIV prevalence to general population or other survey data
The final feature added into EPP 2005 is the ability to calibrate the curves for general population survey data, obtained, for example, through Demographic and Health Surveys which are often doing household based HIV testing these days. To allow for this, EPP 2005 added a new Calibration page, shown in figure 5, for generalised epidemics. This page allows the user a number of options for calibrating their projections. The first and most commonly used is to adjust urban and rural HIV levels to the level measured in a household survey. The user accomplishes this by entering the measured prevalence in urban areas and rural areas and the year in which the survey was conducted. EPP 2005 then adjusts the urban and rural prevalences to the specified levels and combines them in accord with urban and rural population sizes to calculate the overall national prevalence level.
These changes have helped to make EPP 2005 a more flexible tool for dealing with the problems encountered in the field in both generalised and concentrated epidemics. However, these EPP changes have been made in an incremental fashion, so the description of fitting an epidemic described in Ghys et al is still accurate. The only major additions are that the user selects whether or not to use level fits and then enters calibration values. By maintaining compatibility with the interface used in the previous version, UNAIDS can focus on new features in trainings, without the need to spend extensive time describing basics. This helps to shorten the learning curve and make the uses of the tools easier at country level.
Future improvements and enhancements to EPP
Obtaining accurate fits to national epidemics is challenging. As national programmes gain more experience, surveillance systems change and adapt, and coverage of treatment programmes expands additional changes will come in EPP 2007 and subsequent versions. The UNAIDS Reference Group on Estimates, Models and Projections regularly reviews the state of HIV surveillance systems, the application of tools such as EPP in the field, and, based on this, recommends changes to improve their utility and the quality of the fits generated. A number of issues are currently under discussion within the Reference Group. Changes anticipated in the near future include:
-
Addressing issues of expanding urban populations in most countries. The proportion of the population living in urban areas in most countries is growing rapidly. Given that urban prevalence is usually substantially higher than rural prevalence, this change in population balance through a difference in urban-rural growth rates or migration is going to have an impact on how urban and rural prevalence are combined to yield a national estimate. The United Nations Population Division projects the urban-rural proportions over time, and the next version of EPP will seek to incorporate these demographic time trends.
-
Adjusting for expanded treatment access and its impact on prevalence. The expansion of life prolonging HIV treatment programmes to a significant number of those developing AIDS will have the net effect of driving up HIV prevalence. Any curve fitting program will need to take into account how quickly these programmes are scaling up and their overall effect in reducing HIV mortality. However, this calls for careful consideration of treatment access in specific subpopulations, as not every population will be eligible for or able to access treatment. For example, sex workers infected recently are unlikely to be eligible for immediate treatment because they will rarely have low CD4 counts or late stage HIV disease—the eligibility criteria for therapy. This means that adjustments for antiretroviral therapy will need to be applied selectively depending upon the characteristics and access of the specific subpopulation.
-
Possible time variation in the force of infection parameter “r” to allow for behaviour change. One approach for dealing with the rapid changes in behaviour occurring in some countries is to allow for some variation in the parameter r. Changes to r over time could adjust for the impacts of changing condom use, improved STD treatment, reduced risk behaviour, and other critical programmatic effects on risk. This could improve the quality of fits in some countries where behaviours have changed substantially. However, the UNAIDS Reference Group must carefully consider how best to approach this, lest inexperienced or biased users apply such changes to manipulate the projections and produce unrealistic outcomes.
Longer term issues being discussed include adding age structure to the modeling, dealing with the impacts of behaviour change, and addressing uncertainty in future projections,10 especially in concentrated epidemics where population sizes are often highly uncertain. As prevention and treatment access scales up under the universal access movement, addressing these issues will be essential to keeping EPP relevant. However, changes will only occur in EPP after proof of concept in field settings and assurances from the Reference Group and EPP’s user base that the changes proposed do not place undue and unreasonable data demands on national counterparts charged with doing estimates.
CONCLUSIONS
EPP 2005 is the next step in the evolution of a tool for fitting national epidemics that has grown in sophistication as understanding of national HIV epidemics improved, yet has striven to maintain a simple interface, making it accessible with only limited training. It has successfully estimated and projected epidemics in numerous countries, but maintaining its utility requires that it continues to address emerging issues, especially those associated with universal access to prevention, treatment, and care.
APPENDIX
THE MATHEMATICS OF TURNOVER AND LEVEL FITS IN EPP 2005
Turnover in EPP 2005
Figure A1 shows graphically the implementation of the UNAIDS Reference Group model with turnover. People enter the not at-risk (X), uninfected at-risk (Z), and infected at-risk (Y) populations either by birth or by being brought in from another low risk population (“outside” population in the diagram). Each year a fraction 1/d of the total leaves each of these three groups, some with HIV and some without. Those with HIV return to other populations and their infections transfer to that low risk population. The fraction of new entrants at risk is f.

Figure A1 The implementation of turnover in the UNAIDS Reference Group equations as used in EPP 2005. Each compartment (X, Y, Z, Fu, and Fi) also includes mortality to HIV and/or other competing causes as appropriate.
The equations below adapt the UNAIDS Reference Group model to include turnover, specified by an average time in an at-risk group, d. Other nomenclature is as in the basic Reference Group model.1


The following two equations then describe the change in uninfected (Fu,) and infected (Fi,) ex-members of at-risk populations. The surviving HIV+ former members, Fi, are then assigned to whichever low risk population the user selects.

Level fits in EPP 2005
Level fits within EPP are done by assuming each projected curve for an individual site is related to the overall projection by a level parameter λi,

Previous work has shown that the distribution of prevalence in surveillance data rather than being binomial is better approximated by a beta-binomial distribution, parametrised in terms of a population mean, μ, and an extra variance term M. In this case, the likelihood function assumes the form:

where x represents the number of HIV positives in a sample of size n. To fit a prevalence projection P, with an estimated population prevalence μ for a given estimate of M we sum these log likelihoods for each data point assuming they represent independent samples (for discussion of this assumption and choice of M see Grassly et al10).
The log likelihood of prevalence qij at site i at time j for a given prevalence projection P is given by:

and the total likelihood of fit is the sum of these individual likelihoods:

where pij = λipj (with λi = level parameter for site i and pj = the projected value for year j based on the values of r, f0, t0, and φ) and where nij is the number of people tested at time i at site j. In practice, the λi, r, f0, and φ are treated as variable parameters to be adjusted so as to maximise this total likelihood function using an iterative approach. Upon convergence the final values are used to calculate the overall prevalence.
Whether this model provides a better fit than the previous approach can be tested using the likelihood ratio statistic. The models are nested (previously λi = 1 for all i), and therefore −2 times the likelihood ratio is approximated by a χ2 distribution with n-1 degrees of freedom (equal to the number of constrained parameters).

Level fits assume that all surveillance sites in a region follow a similar pattern of rising and falling prevalence, but that the individual sites are at different prevalence levels, with some being high prevalence (♦), while others are much lower prevalence (▴ and ▪).
Comparison of applying the level fit approach in EPP 2005 (“Level fits”) to the original approach used in EPP 2003 (“No level fits”). The result is to bring the overall level of the curve down while maintaining the trends seen in the longer running sites.

The result of applying the level fit procedure to data from Kenya, where the surveillance system added a number of new lower prevalence sites in the early 2000s. The level fit procedure (“Variable”) produces a stabilising prevalence curve rather than the declining curve seen when levels are not used (“Levels fixed at 1”).

The impact of turnover of 10 years on HIV prevalence among injecting drug users in Central Thailand. Turnover allows flatter curves to be obtained and reveals that 5.4% of estimated male infections in Thailand in 1995 were due to ex-injecting drug users.

The calibration page in the generalised form of EPP 2005. This allows national programmes to adjust the outcomes of their projections to meet measured prevalence levels in the population.
Acknowledgments
The authors would like to acknowledge the work and support of the many people who have participated in meetings of the UNAIDS Reference Group on Estimates, Modeling and Projections over the years. In particular the authors would like to gratefully acknowledge the specific work of Marc Artzrouni, Griff Feeney, David Schneider, Peter O Way, Ping Yan, Basia Zaba, and Hania Zlotnik, who contributed substantially to early development work for the approach to curve fitting implemented in the UNAIDS EPP.
AUTHORS’ CONTRIBUTIONS Dr Tim Brown prepared the initial draft of this paper for review by and feedback from the co-authors. He developed the equations for turnover in at-risk populations and implemented the code for the EPP 2005 software. Dr Nicholas Grassly invented the level fit algorithm described herein and supplied valuable examples of its application to real world data. Dr Geoffrey Garnett and Dr Karen Stanecki assisted in developing the original EPP equations and have assisted in the ongoing development of this package and its application at country level over the last seven years. All of the authors serve as core members of the UNAIDS Reference Group on Estimates, Modelling and Projections, which oversees the continuing evolution and improvement of the EPP and Spectrum combination.
REFERENCES
Footnotes
-
Competing interests: none.
-
Edited by Peter Ghys, Neff Walker, Helen Ward and Rob Miller