Article Text

Abstract
Background: Since 1998 the Joint United Nations Programme on HIV/AIDS and the World Health Organization has provided estimates on the magnitude of the HIV epidemic for individual countries. Starting with the 2003 estimates, plausibility bounds about the estimates were also reported. The bounds are intended to serve as a guide as to what reasonable or plausible ranges are for the uncertainty in HIV incidence, prevalence, and mortality.
Methods: Plausibility bounds were developed for three situations: for countries with generalised epidemics, for countries with low level or concentrated epidemics (LLC), and for regions. The techniques used build on those developed for the previous reporting round. However the current bounds are based on the available surveillance and survey data from each individual country rather than on data from a few prototypical countries.
Results: The uncertainty around the HIV estimates depends on the quality of the surveillance system in the country. Countries with population based HIV seroprevalence surveys have the tightest plausibility bounds (average relative range about the adult HIV prevalence (ARR) of −18% to +19%.) Generalised epidemic countries without a survey have the next tightest ranges (average ARR of −46% to +59%). Those LLC countries which have conducted multiple surveys over time for HIV among the populations most at risk have the bounds similar to those in generalised epidemic countries (ARR −40% to +67%). As the number and quality of the studies in LLC countries goes down, the plausibility bounds increase (ARR of −38% to +102% for countries with medium quality data and ARR of −53% to +183% for countries with poor quality data). The plausibility bounds for regions directly reflect the bounds for the countries in those regions.
Conclusions: Although scientific, the plausibility bounds do not represent and should not be interpreted as formal statistical confidence intervals. However in order to make the bounds as meaningful as possible the authors have tried to apply reasonable statistical approaches and assumptions to their derivation. An understanding of the uncertainty in the HIV estimates may help policy makers take better informed decisions to address the epidemic in their respective countries.
- ANC, antenatal clinic
- ARR, average relative range
- ART, antiretroviral treatment
- EPP, Estimation and Projection Package
- LLC, low level or concentrated epidemics
- MSM, men who have sex with men
- UNAIDS, Joint United Nations Programme on HIV/AIDS
- HIV
- estimates
- plausibility
- uncertainty
Statistics from Altmetric.com
- ANC, antenatal clinic
- ARR, average relative range
- ART, antiretroviral treatment
- EPP, Estimation and Projection Package
- LLC, low level or concentrated epidemics
- MSM, men who have sex with men
- UNAIDS, Joint United Nations Programme on HIV/AIDS
The 2003 HIV and AIDS estimates1 were the first estimates of the global HIV and AIDS burden to be published by the United Nations with plausibility bounds.2 These scientifically derived plausibility bounds have allowed a better appreciation of the uncertainty about HIV and AIDS estimates among a larger public.3
The 2003 plausibility bounds, while much more sophisticated than the earlier, crude categorical bounds around the estimates,4 were developed for different types of epidemics and surveillance systems, categorised by the level of epidemic (low level, concentrated, and generalised), and for countries with generalised epidemics also the quality of surveillance (good, average, poor) and the stage of the epidemic (rising, steady, and falling). These 2003 bounds were therefore not specific to the surveillance data used to generate the HIV and AIDS estimates in the individual countries. Here we describe the further development of plausibility bounds, as applied to the 2005 HIV and AIDS estimates.
METHODS
1. Generating plausibility bounds around national HIV prevalence over time for countries with generalised epidemics
Generating prevalence curves
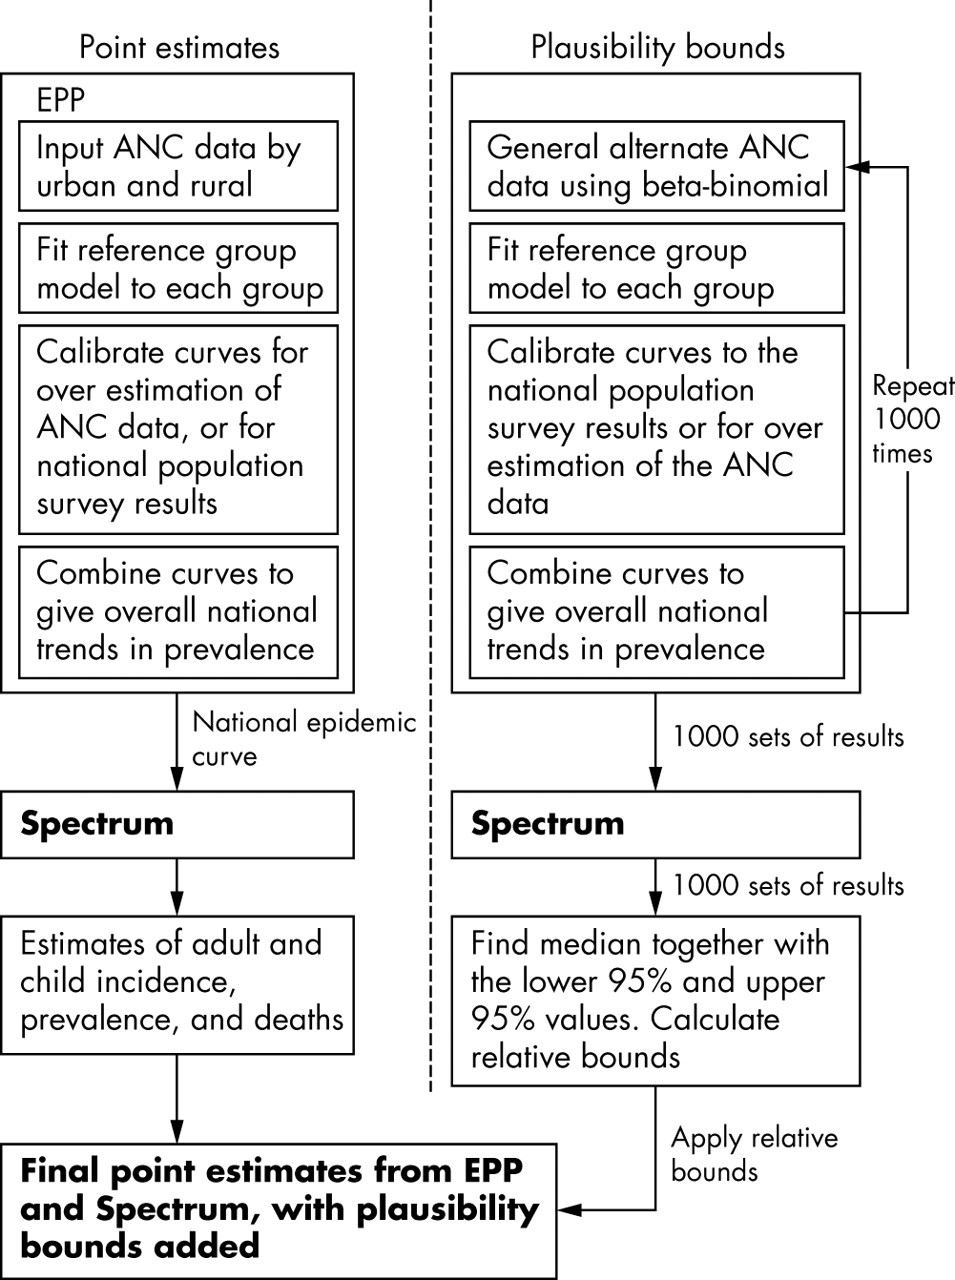
Countries with generalised epidemics typically use the Estimation and Projection Package (EPP)5 to generate an epidemic curve of HIV prevalence over time from antenatal clinic (ANC) surveillance data. Most often prevalence curves are fit for two subpopulations: one for ANCs located in urban areas and another for ANCs located in rural areas. The separate curves are then combined to get overall national estimates. Some countries have expanded on that approach by introducing a third category of semi-urban ANC sites, or instead have divided the clinics by province and then combined separate curve fits by province to produce an overall national curve. Spectrum6 then uses those curves to produce estimates of various quantities of interest, such as the number of new adult and perinatal infections, the number of adults and children living with HIV, and the number of deaths among adults and children.
The calculation of the plausibility bounds mimics this two-stage process of using EPP to generate epidemic curves and then using Spectrum to generate the other quantities of interest (fig 1). Compared to the methods used to generate the plausibility bounds in the previous Joint United Nations Programme on AIDS (UNAIDS) reporting round,1,2 there are two important differences. Firstly, rather than base the bounds only on uncertainty estimates derived from a few prototypical countries, the ANC data for each country were used to produce separate bounds. Also, where available, the results from national population based surveys were used to produce bounds that were country specific. Secondly, the entire process for plausibility estimation for each country was carried through to the application of the Spectrum package to calculate all quantities such as adult and paediatric incidence, prevalence, deaths, and so on.

Estimation of HIV results and the generation of plausability bounds.
The same ANC data used by each country to estimate the HIV epidemic curve were used to produce the plausibility bounds. For each country, 1000 sets of alternate ANC data points were randomly produced using a beta-binomial distribution as described previously.6 This process of generating the alternate ANC data points captures two major sources of uncertainty, namely that related to the sampling of women within a given clinic and the selection of the clinics to be included in the survey. No other sources of uncertainty were considered at this step. For each set of points, the UNAIDS Reference Group Model was fit by maximum likelihood estimation in a manner similar to that used within EPP.5,7 Fitted curves for each subpopulation were then calibrated and combined as described below.
Calibration
The calibration step scales the resulting EPP prevalence curves up or down. Two types of calibration were considered, one for countries with recent demographic health surveys estimating national HIV prevalence to be at least 1.0% and one for countries without such surveys. For countries with surveys, the calibration step accounts for the sampling variation in the surveys. For countries without surveys, the calibration step accounts for the uncertainty in how well the fit ANC prevalence curves relate to the population prevalence.
In the first case, the urban and rural survey results for each country were used for calibration. For each of the 1000 sets of curves, pseudo-random numbers were generated from a normal distribution N(μ, σ2), where μ is equal to the estimated urban or rural prevalence, and where σ is the standard error of that estimate. The ratios of those numbers to the fit prevalence values for the survey year were calculated and then used as multipliers to scale the curves up or down. This process for scaling is identical to that used by EPP when calibrating the curve fits to national population based survey estimates.
In the second case, for countries without a national population based survey, data from other countries with surveys8 were used to account for the uncertainty around the adjustment that is typically applied in EPP to prevalence data from rural sites.5 The prevalence ratios of published national surveys as compared to the unadjusted EPP result based on ANC data for urban and rural areas are shown in table 1. From these data the mean urban, rural, and pooled ratio were calculated, together with their standard deviations. To calibrate the urban and rural maximum likelihood fits for each of the 1000 different sets of ANC data points, pseudo-random numbers for the appropriate ratio were generated taken from normal distributions having the means and standard deviations shown in table 1. Then, in the same manner as is done in the EPP software package, the prevalence curves were scaled by multiplying by those numbers. For countries with only a national set of ANC data, or with provincial or semi-urban data, the pooled mean and standard deviations of the ANC ratios were used for the calibration.
Comparison of prevalence among antenatal clinic (ANC) attendees* and in national surveys in countries with generalised epidemics
Those countries with population surveys having less than 1.0% HIV prevalence were adjusted in the same manner as countries without population surveys. The survey data were not used because hidden populations such as sex workers, men who have sex with men (MSM), and injecting drug users are not fully captured in household surveys, while they constitute a substantial portion to the overall prevalence.
Combining subpopulation groups to produce the national prevalence curve
Once the curves for individual subpopulation groups were fit and calibrated, they were combined to produce an overall national prevalence curve. The curves were combined as a weighted average of the most recent population proportions in the subpopulations used in EPP (usually urban and rural, and for some countries also semi-urban or provincial).
2. Generating plausibility bounds around prevalence over time for countries with low level and concentrated epidemics
Estimating plausibility bounds for countries with low level or concentrated HIV epidemics follows the same general approach as that used with generalised epidemics, but there are differences. The tool used to make these estimates is called the Workbook.9 It is described in another paper in this issue, but the methods will be briefly reviewed here as they pertain to estimating bounds. The major difference comes from the different information that is used to estimate adult prevalence in countries with these types of epidemics. As is explained in another paper of this issue,9 adult prevalence is estimated by first identifying the various subpopulations that are most exposed to HIV. These include sex workers and their clients, MSM, injecting drug users, and any other population in a country that is more exposed to HIV. In addition to these groups, the workbook method also allows for sexual transmission of HIV from members of these more exposed populations to their sexual partners.
For each population, countries develop estimates of both the size of the populations and the prevalence of these populations. For both the population size and prevalence, low and high estimates are made in such a way as to capture the range of possible values for each. From these the number of people who have HIV in a population is calculated as the product of the prevalence and population size. This results in a range of estimates for each population that range from “low population size times low prevalence” to “high population size times high prevalence”. The values for each population are summed to produce the “low-low” and “high-high” estimates for the number of adults living with HIV or AIDS. This range is then taken as the plausible range for the estimate of adults living with HIV and AIDS as defined by the analysts in the national programme making the estimates. The two values divided by the total adult (15–49 years) population yields the range on adult prevalence.
The ranges reported in the workbooks were not directly used as the plausibility bounds. This is because there was no set of metrics that could ensure that what one analyst or country thought of as the “plausible range” of population size or prevalence corresponded to that used in another country. Rather than allow for individual judgment to solely inform the plausibility bounds, we instead chose to use the average bounds from all of the countries with low level or concentrated epidemics. This yielded a lower bound of 45% of the best estimate and an upper bound of 165% of the best estimate. These average bounds were then applied to all countries that had been judged to have a good surveillance system, based on an updated scoring of the quality of serosurveillance systems in LLC countries using previously described methods.10,11 For countries with medium quality data the ranges were expanded by an additional 10% on the lower and upper bounds; for countries with poor data systems the adjustment was an additional 20% over that used for countries with good surveillance systems. The plausibility bounds were calculated for each year for which an estimate of adult prevalence had been made in the Workbook.
The resulting set of point prevalence estimates and their plausibility bounds were then used to fit a curve for national prevalence. For each country, a total of 1000 curves were fit based on data points randomly generated from the point estimates and bounds for each time period provided by countries in their UNAIDS workbooks for concentrated epidemics. The values were generated based on two normal distributions as described below. Two distributions were used in order to preserve an asymmetry between the upper and lower bounds for that point. A value higher than the point estimate was generated with probability 0.5, or a value lower than or equal to the point estimate was generated. If higher, the actual value was taken from the upper half of a normal distribution have the point estimate as the mean and the variance equal to ((U-P)/1.96)2, where P is the point estimate and U is the upper bound for that time point. If lower, the value was taken from the lower half of a normal distribution with a mean P and variance ((P-L)/1.96)2, where L is the lower bound.
Either a single logistic curve representing increasing HIV prevalence or double logistic curve9 representing declining prevalence was fit to the randomly generated data points. The type of curve used was determined from the workbook supplied to UNAIDS from country representatives. Curves with implausibly high values for prevalence in 2005 (greater than 5.0%) were ignored. The fits were done by least squares non-linear regression using the Statistical Analysis System.12 The resulting 1000 curves were then input to Spectrum and the relative plausibility bounds were calculated.
3. Estimating uncertainty due to other epidemic characteristics
The projections of adult HIV prevalence are used in the Spectrum projection package to determine the consequences of the prevalence projections, including estimating the number of people living with HIV by age and sex, new infections, AIDS deaths, AIDS orphans, the need for treatment, and the impact of treatment.6,13 To determine the uncertainty associated with these estimates for a particular country, Spectrum was modified to use the different estimates of prevalence and add variation around the other major inputs. For each run Spectrum selects a prevalence curve sequentially from the 1000 curves and selects values for each of the other inputs randomly from a defined range. This analysis includes variation in each of 14 inputs (table 2). The first four inputs are patterns that vary with time.
Ranges for key inputs in spectrum
-
Progression from HIV infection to AIDS death. Progression is expressed as the cumulative proportion of a cohort of people infected with HIV that has died of AIDS by the number of years since infection. Separate progression patterns are used for adult males, adult females, and children. The adult patterns are Weibull curves with median time from infection to death of 8.6 years for males and 9.4 years for females.7,13 The child pattern is a double Weibull with half of the children progressing to death by age 2, 61% by age 5, 69% by age 10, and 81% by age 15.6 For the adult patterns, 25 different Weibull curves were produced with median times to death from 7.4 years to 9.8 years in increments of 0.1 years. For each of the 1000 runs, a median survival time for females was selected from the range and then the corresponding Weibull curve was used. The male pattern was the curve with a survival time 0.8 years less than the female pattern. For child survival, 1000 different patterns were developed by first fitting double Weibull curves by non-linear least squares to the data points from the database of child survival by age from the published cohort studies.14,6 Then 1000 sets of alternate double Weibull parameters were randomly generated from a multivariate normal distribution N(M, Σ) where M is the vector of parameter estimates and Σ is the covariance matrix resulting from that fit. These sets of parameters in turn were used to produce the 1000 different patterns for mortality in HIV infected children.
-
Distribution of HIV prevalence by sex. Adult prevalence is divided into male and female prevalence using the ratio of female to male prevalence. This ratio is much less than one at the beginning of an epidemic but increases with time to a different value for generalised versus low level/concentrated epidemics and then remains constant.6 Different patterns of the sex ratio over time were created based on the assumed asymptote reached by the 15th year of the epidemic.
The other inputs are all single values that remain constant with time. For each run the value of each input is selected from a normal distribution with a mean and standard deviation as shown in table 2.
-
Prevalence among 15–24 year olds. Adult prevalence for the age group 15–49 is distributed across five year age groups using patterns derived from survey data. For each five year age group we calculate the ratio of prevalence at that age group to prevalence for the 25–29 age group for the same sex. These patterns are averaged across all survey countries to produce a model pattern for generalised epidemics which is used for countries without surveys. We used the survey data8 to determine the range around the prevalence ratios for 15–19 and 20–24 for males and females.
-
Mother to child transmission rate. The mother to child transmission rate is the percentage of children born to HIV infected mothers who will themselves become infected during gestation, at birth, or after birth through breastfeeding. Spectrum uses two different rates, a base rate for those women that do not receive any antiretroviral treatment to prevent transmission and a programme rate for those women who do receive treatment.
-
Reduction in fertility due to HIV infection. The fertility of HIV infected women is generally less than for women who are not infected. The default value in Spectrum is that fertility is reduced by 70% in HIV infected women aged 20 and older. In women aged 15–19 fertility is assumed to be 50% greater than for uninfected women, as all infected women are sexually active while many uninfected women in this age group are not sexually active.15
-
Effect of antiretroviral treatment (ART) on survival. The effect of ART on survival is described as the percentage of those on ART who would die in the next year without ART who survive to the following year because of ART.16
-
Effect of treatment on child survival. Survival of HIV infected children can be improved by treatment with cotrimoxazole or ART or both. The effect is described as the percentage of infected children who would die in the next year without treatment who survive because of the effects of treatment.16
The results of each of the 1000 Spectrum runs are analysed to determine the median values and the 95% bounds for key indicators of interest.
PLAUSIBILITY BOUNDS FOR REGIONAL AND GLOBAL ESTIMATES
Two types of regional estimates are reported by UNAIDS. For counts such as total number of adults with HIV and the number of AIDS orphans, the estimates for individual countries are simply summed to give the regional estimates. For percentages such as HIV prevalence, a weighted average is calculated where the weights are equal to the size of the underlying population.
Two possible extremes were considered when combining the country plausibility bounds into the regional bounds. The first extreme was to assume that the estimates for each country are statistically independent and that the plausibility bounds are roughly equivalent to 95% confidence intervals about those estimates. The upper bounds and lower bounds were considered separately to maintain any asymmetry. For each country an approximate variance based on the upper bound U was calculated as ((U-P)/1.96)2 and an approximate variance based on a lower bound L was calculated as ((P-L)/1.96)2, where P is the estimate. Under the independence assumption, the variances for regional counts may then be calculated as the sum of the variances for the countries in the region. Likewise the variances for regional percentages may be calculated using standard formulae for the variance of a linear combination of random variables.17 Having the necessary variances for regional counts and percentages, the approximate bounds were calculated in the usual way.
The other extreme was to assume that the estimates for the countries in a region are highly correlated. For counts, the upper and lower regional bounds were calculated as sums of the respective country bounds. For percentages the regional bounds were calculated as simple weighted averages.
In practice we do not know exactly what the correlations may be between the estimates for the different countries in a region, but do feel that any correlations that may be present are weak. Therefore we have chosen to report the regional plausibility bounds as a weighted average of the two extremes, giving three times more weight to the bounds calculated assuming independence than to those bounds calculated assuming high correlation.
RESULTS
Figure 2 summarises the results by type of epidemic. The ranges on adult prevalence for countries with generalised epidemics come directly from the EPP fits to the surveillance data. For those 15 countries with a national serosurvey in the past few years the uncertainty from −18% to +19% is due mostly to the sampling variation in those surveys. For the 27 countries without national surveys the larger uncertainty from −46% to +59% is due to the fact that the urban, semi-urban, and rural calibration ratios varied widely.

Ranges for key indicators in 2005 by type of epidemic expressed as mean percentages below and above the median value (for the raw data for this figure, and a colour version, please see http://www.stijournal.com/supplemental).
Countries with low level and concentrated epidemics also have ranges that are larger. For those six countries with good quality data the average uncertainty in adult prevalence is from −40% to +67%. As the quality of the data declines, the sizes of the ranges generally increase. For the nine countries with medium quality data the average range is from −38% to +102%. For the 12 countries with poor quality data the average range is from −53% to +183%. The fact that the lower bounds for LLC countries with good and medium quality data are comparable is likely an artifact of the small number of countries in each group and variability of the ranges by country.
The number of people infected with HIV is related directly to prevalence and, therefore, has a similar range of uncertainty. The number of infected females has a large uncertainty range because of the uncertainty around the female to male ratio of prevalence. The range around prevalence among young people aged 15–24 is similar to overall prevalence when derived from a national survey, but much larger otherwise. New infections among adults have larger uncertainty ranges than prevalence because of the extra variation in time from infection to death. The extra variation is especially noticable in LLC countries with medium and poor quality surveillance systems.
The indicators for children show even more variation due to the extra uncertainty around the mother to child transmission rate and the progression from infection to death. The uncertainty range around AIDS orphans is similar to that for adult AIDS deaths. The uncertainty around new AIDS orphans (not shown) is considerably larger but the accumulation over many years leads to an uncertainty range for total AIDS orphans that is similar to the range around adult AIDS deaths.
DISCUSSION
The approach to estimating uncertainty in HIV estimates described here improves on the methods used for the 2003 estimates2 in several ways. One major improvement is that data reported from each country are used to determine the uncertainty range specific to that country rather than basing the bounds on typical patterns, according to the quality of the surveillance system and the maturity of the epidemic. A second major improvement is the use of Monte Carlo techniques to determine the uncertainty range for all of the Spectrum outputs rather than estimating these ranges directly from the prevalence range. This allows an examination of the uncertainty over the entire time period of the projection and accounts for different patterns of demographic and epidemic change. A third major change in generalised epidemics is the use of data from national serosurveys to adjust prevalence estimates in the year of the survey.
The average ranges calculated here are somewhat different from those provided for the 2003 estimates.1 For countries with national surveys the estimates of the ranges of prevalence, adult deaths, and new infections are significantly smaller than for countries with good surveillance systems but no national surveys. The ranges for the child indicators are somewhat larger than in 2003 due to the improved specification of uncertainty around survival of HIV infected children. For countries without national surveys the ranges are smaller than those estimated in 2003 for countries with average surveillance systems. This may be due at least partially to having two more years of surveillance data and more rural surveillance sites in many countries than in 2003.
The plausibility bounds have addressed only the uncertainty about each of the inputs in the estimation process, but they do not account for potential biases. In both the 2003 and 2005 sets of country estimates1,4 there have been corrections to earlier estimates, adjusting for bias that was often due to the poor representation of rural areas in the sentinel surveillance system. These corrections were possible because of the national surveys that have been conducted in many countries. However, because many countries with generalised epidemics have now conducted a survey, and corrections have been made in other countries based on the regionwide insights from these surveys, it is likely that most of the bias that existed previously in estimates for countries with generalised epidemics has been adjusted for.
For countries with low level or concentrated epidemics, the plausibility bounds are less robust. For these countries, the bounds are still based on average perceived variation of the estimates of the underlying size of most exposed populations and prevalence data. Also for these countries, the adjustment for data quality was not based on a measured difference in additional uncertainty due to data quality. These additional sources of uncertainty are important but also hard to quantify, making the plausibility bounds much more reliant on judgment than the bounds for countries with generalised epidemics.
The calculation of the regional and global bounds is presented here for the first time, based on simple statistical methods and a practical approach acknowledging our lack of knowledge about the correlation between estimates in different countries.
In conclusion, the plausibility bounds about the 2005 HIV and AIDS estimates have been considerably improved compared to the bounds used in 2003. For countries with generalised epidemics, especially those with a national survey, the current bounds appear appropriate compared to the data that inform the estimates. However, for low level and concentrated epidemics plausibility bounds remain very large as a rule. Further work is needed to improve the quality of the workbooks for a larger number of countries, and to refine methods to combine uncertainty in the several population groups that are used to build up the estimates in these countries. Additional improvements are to be made by implementing these new methods in the EPP, Workbook, and Spectrum software.
Although scientific, the plausibility bounds do not represent and should not be interpreted as formal statistical confidence intervals. However in order to make the bounds as meaningful as possible, we have tried to apply reasonable statistical approaches and assumptions to their derivation when we felt there was sufficient information to do so. The bounds should help policy makers and the public better understand that the size and impact of the HIV epidemic in their respective countries is not known with absolute precision and that various estimates and projections produced by different organisations may in fact be consistent with one another. These insights may also help policy makers to make more informed decisions to improve the response to the epidemic in their countries.
Acknowledgments
We would like to thank Tim Brown and Nicolas Grassly for help with programming the application that generated the multiple sets of curves, Ann Way and colleagues for providing sampling errors for the Demographic and Health Surveys, and Rob Lyerla for updating the scoring of the quality of serosurveillance in countries with low level and concentrated epidemics.
REFERENCES
Supplementary materials
Footnotes
-
The findings and conclusions in this report are those of the authors and do not necessarily represent the views of their respective organisations.
-
Edited by Peter Ghys, Neff Walker, Helen Ward and Rob Miller