Article Text

Abstract
Objectives The objective of this study was to determine the optimal time interval for a repeated Chlamydia trachomatis (chlamydia) test.
Methods The authors used claims data for US women aged 15–25 years who were enrolled in commercial health insurance plans in the MarketScan database between 2002 and 2006. The authors determined the numbers of initial positive and negative tests that were followed by a repeated test and the positivity of repeated tests. The authors used a dynamic transmission pair model that reflects the partnership formation and separation processes in 15–25 year olds to determine the time course of repeated infections in women under different levels of notifying the current partner. The authors then explored the additional impact of repeated testing uptake on reducing chlamydia prevalence.
Results 40% (4949/12 413) of positive tests were followed by a repeated test compared with 22% (89 119/402 659) of negative tests at any time. Positivity of repeated tests followed by an initial positive test was high: 15% (736) after a positive test versus 3% (2886) after a negative test. The transmission model showed a peak in repeated infections between 2 and 5 months after treatment. For a chlamydia testing uptake of 10% per year, the additional impact of repeated testing on reducing chlamydia population prevalence was modest.
Conclusions The mathematical model predictions support the recommended interval for repeat chlamydia testing. This study provides information that can be used to design randomised controlled trials to determine more effective interventions to prevent chlamydial reinfection.
- Chlamydia trachomatis
- women
- deterministic model
- preventive health services
- epidemiology
- notification
- control
- chlamydia
- mathematical model
- HIV
- Neisseria gonorrhoea
- health service research
- sexual health
- chlamydia infection
- chlamydia
- STD surveillance
- epidemiology
Statistics from Altmetric.com
- Chlamydia trachomatis
- women
- deterministic model
- preventive health services
- epidemiology
- notification
- control
- chlamydia
- mathematical model
- HIV
- Neisseria gonorrhoea
- health service research
- sexual health
- chlamydia infection
- chlamydia
- STD surveillance
- epidemiology
Introduction
Repeated infections with Chlamydia trachomatis (chlamydia) in women are common.1 Repeated infections can come from treatment failure, sexual contacts with new partners or from reinfection within an existing partnership. Chlamydia is the most common reported infection in most developed countries2 and is largely asymptomatic in both men and women.3 Chlamydia can ascend from the endocervix to the upper genital tract to cause pelvic inflammatory disease, which is a risk factor for ectopic pregnancy and infertility.4 Repeated infections can increase the probability of these complications.5
Many countries have adopted guidelines about repeated testing after treatment for a positive chlamydia test.6–10 The reasons for and the preferred timing of repeated tests vary between countries. In most countries, a repeated test to confirm clearance of infection (test-of-cure) is not recommended, see for example, the guidelines from the UK,6 USA,7 New Zealand9 and Scotland.10 Reasons for doing a test of cure are as follows: if there is doubt about whether treatment was taken,6 ,7 ,10 non-standard treatment was given,6 ,9 there is a risk of reinfection,6 ,7 ,10 symptoms persist7 or in pregnant women.6 ,7 ,9 ,10 A survey of chlamydia control activities in European countries showed that seven countries recommended a repeated test as a test of cure.8 A repeated test to detect reinfection is recommended 3–6 months after treatment in New Zealand,9 3–12 months after treatment in Scotland10 and 3 months after treatment in the USA.7
Data about the optimal timing of repeated testing are inconclusive. A systematic review that combined repeated infection rates from different studies showed a peak in repeated infections between 8 and 10 months after treatment.11 However, it is difficult to determine the optimal repeat testing interval in epidemiological studies. If a woman has a negative test after a given interval, one does not know whether she has had a repeated infection before and cleared it spontaneously. Furthermore, to our knowledge, there is no randomised control trial that has investigated the impact of repeated testing on population prevalence. Mathematical modelling can help to better understand the time course of repeat chlamydia infections in women and to assess the expected impact of repeated testing on population prevalence. Here, we first analyse data from commercially insured US women aged 15–25 years12 to estimate positivity of repeated chlamydia tests. We then used a dynamic transmission model to determine the time interval during which the prevalence of repeated infection after treatment is highest. Finally, we estimate the additional impact of repeated testing on reducing population prevalence of chlamydia.
Methods
Data
We used data from the US women aged 15 to 25 years, enrolled in commercial health plan in the MarketScan database between 2002 and 2006.13 The MarketScan database links data about healthcare encounters and claims to detailed patient information from health plans provided by about 100 large employers across the USA. Details of the data set have been described elsewhere.12 In brief, a chlamydia test in the database was determined by using relevant Current Procedural Terminology codes, as recommended by the National Committee for Quality Assurance for claims data or a diagnosis of chlamydia according to ICD-9 codes. We defined a month to be 32 days, as in a previous study.12 Any test done within 1 month after the initial test (irrespective of the result of the initial test) were not included because nucleic acid amplification tests can detect inactive DNA for some weeks after treatment.6 ,7 ,9 ,10 A positive test was determined by linking chlamydia-specific treatment data7 to the testing data. All chlamydia-specific treatments that were prescribed a month after the chlamydia test and all diagnoses for chlamydia were assigned as positive. This definition is stricter than used previously12 to avoid double counting of positive tests. All other tests were assumed to be negative. The reason for the test (test-of-cure, test for reinfection, testing as a result of partner notification or for investigation of new symptoms) was not documented.
We determined how many tests were followed by another test 1 month or more after the initial test (repeated test). We counted the number of tests rather than women with a test because a woman can receive multiple tests. A secondary analysis using only the first two tests for each woman did not change the results. We calculated the interval in months between the initial and the repeated test (repeated test interval) stratified according to the result of the initial test. We then determined the percentage of repeated tests that were positive (positivity) in each month according to the result of the initial test. The 95% CIs of the positivity after an initial positive test by month were calculated, assuming the normal approximation for binomially distributed data.14
Model
We used a compartmental pair model that explicitly describes the formation and separation of partnerships and thus incorporates reinfection within partnerships. The model structure has been described elsewhere15 and is extended here to include repeated testing and treatment failure. A detailed description of the extended model is given in the online appendix text S1, figure S1 and table S1. In brief, we assume a closed heterosexual population of men and women aged 15–25 years. The behavioural model parameters are adapted from sexual behavioural data from the second UK National Survey of Sexual Attitudes and Lifestyles (Natsal 2000), a population-based cross-sectional survey,16 because not all parameters are available from a single national US source. We assume that 70% of all individuals are in a sexual partnership and the average number of new partners is 1.5/year. These two parameters were used to derive an average partnership duration of 5.6 months and average gap duration of 2.4 months (see text S1). We assumed the partnership and gap duration to be exponentially distributed taking into account that some partnerships (and gaps) are very short, whereas others can be long. Chlamydia transmission can happen within partnerships assuming one unprotected sex act per week and the transmission probability per sex act is calibrated to a baseline prevalence of 3%. We assume the infectious period to be 1 year.17 We also assume a short period of immunity after natural clearance of 3 months but not after test and treatment.15 ,17 In the model, women are tested at a certain rate per year. Women can also notify their current partner. We assume that once the male partner is notified, he always accepts treatment. We assumed treatment to be 92% efficacious.1 In the model, this value combines false-negative tests, antibiotic failure, insufficient treatment taken and possible transmission during the time between treatment of the index case and the partner.
The model was extended to allow a certain fraction of women who were tested positive, to have a repeated test 3 months after treatment. The interval between tests was divided into multiple compartments to rescale the distribution of the interval between tests from exponential towards constant.18 Women receive a repeated test and treatment every 3 months until they test negative.
First, we use the model framework to simulate the natural history of repeated chlamydia infections to determine the optimal testing interval in the absence of preventive interventions. We calculate the proportion of women with a repeated chlamydia infection after testing and treatment in continuous time for different rates of partner notification uptake (see also appendix text S1). We can then determine the time point at which the prevalence of repeated infection is highest (optimal testing interval). We also calculate the corresponding cumulative incidence of repeated infections in these women. We express this as the percentage of all women initially tested and treated. Second, we calculate the impact on reducing population prevalence of testing women at a rate of 0.1/year with 50% of those women receiving a repeated test 3 months after treatment or with 50% of the current partners being notified or both. We repeat the analyses for a testing rate of 0.3/year.
Uncertainty analyses
We performed an uncertainty analysis for the optimal testing interval. In total, 10 000 combinations of parameters were chosen uniformly from the parameter ranges shown in table 1. This resulted in different mean partnership durations varying from almost half to double the baseline duration. Of those, 8874 parameter combinations were selected based on the constraint that the per sex act transmission probability cannot be higher than 1. For every parameter set, we obtained the optimal testing interval within 2 years after treatment. Of the 8874 parameter sets, an additional two sets could not be used because there was no peak in the prevalence of repeated tests after 2 years. For the remaining estimated time points, the median and 0.025 and 0.975 percentiles as credible intervals were obtained.
Parameter values for the pair model describing chlamydia transmission
Results
In 2.6 million women aged 15–25 years who were enrolled between 2002 and 2006 in the MarketScan database, 415 072 chlamydia tests were done.12 Of the total number of tests, 12 413 (3%) were positive. Of the chlamydia positive tests, 40% (4949) were followed by a repeated test at any time and 25% (3088) were done between 2 and 5 months after treatment (figure 1A); the median test interval was 110 days (IQR: 56–240 days). After a positive test, 15% (736) of subsequent tests were also positive, which was higher than the overall test positivity of 3% (figure 1B). The median testing interval between two positive tests was 85 days (IQR: 48–177 days). Note that after 1 year, the number of repeated tests is low, so estimates of positivity become unreliable.

The percentage of repeated tests (A) and test positivity (B) by month split by initial test result (positive, n=4949 or negative, n=89 119) in commercially insured women aged 15–25 years between 2002 and 2006 in the USA. Note that a month is defined as 32 days and that all tests done in 1 month after the initial test were not counted. Data are shown up to 24 months because absolute test numbers are low for longer intervals.
Repeated testing after a negative test was less frequent; 22% (89 119) of the negative tests were followed by a repeated test at any time. Repeated test intervals were longer than those following positive tests (dark area in figure 1A); 7.7% (31 159) were done between 2 and 5 months after initial testing and there is a peak in the repeated testing interval around a year. The positivity in subsequent tests after a negative test was 3% (2886), which is the same as in the entire data set. The level of positivity was similar for all repeated testing intervals (figure 1B).
Using the dynamic transmission model (figure 2A), the proportion of women with a repeat infection was highest 3.4 months after treatment (27%). Chlamydia prevalence among previously treated women remains high; 2 years after a positive test, the chlamydia prevalence in previously treated women is still higher than the population prevalence of 3%. Notification of the current partner decreases the percentage of women with a repeated infection substantially, indicating that most repeat infections occur in women who are still together with their infected partner (reinfections). The level of partner notification among the women in the testing data set was not recorded. However, setting partner notification uptake to 50%19 results in positivity in the model that is in good agreement with the 95% CI of the positivity data from the MarketScan database from the third month. When partner notification uptake is low, transmission can happen shortly after treatment of the index case if they remain in a partnership with their infected partner. This is reflected in the cumulative incidence of repeated infections, which increases most quickly shortly after treatment and then levels off (figure 2B).
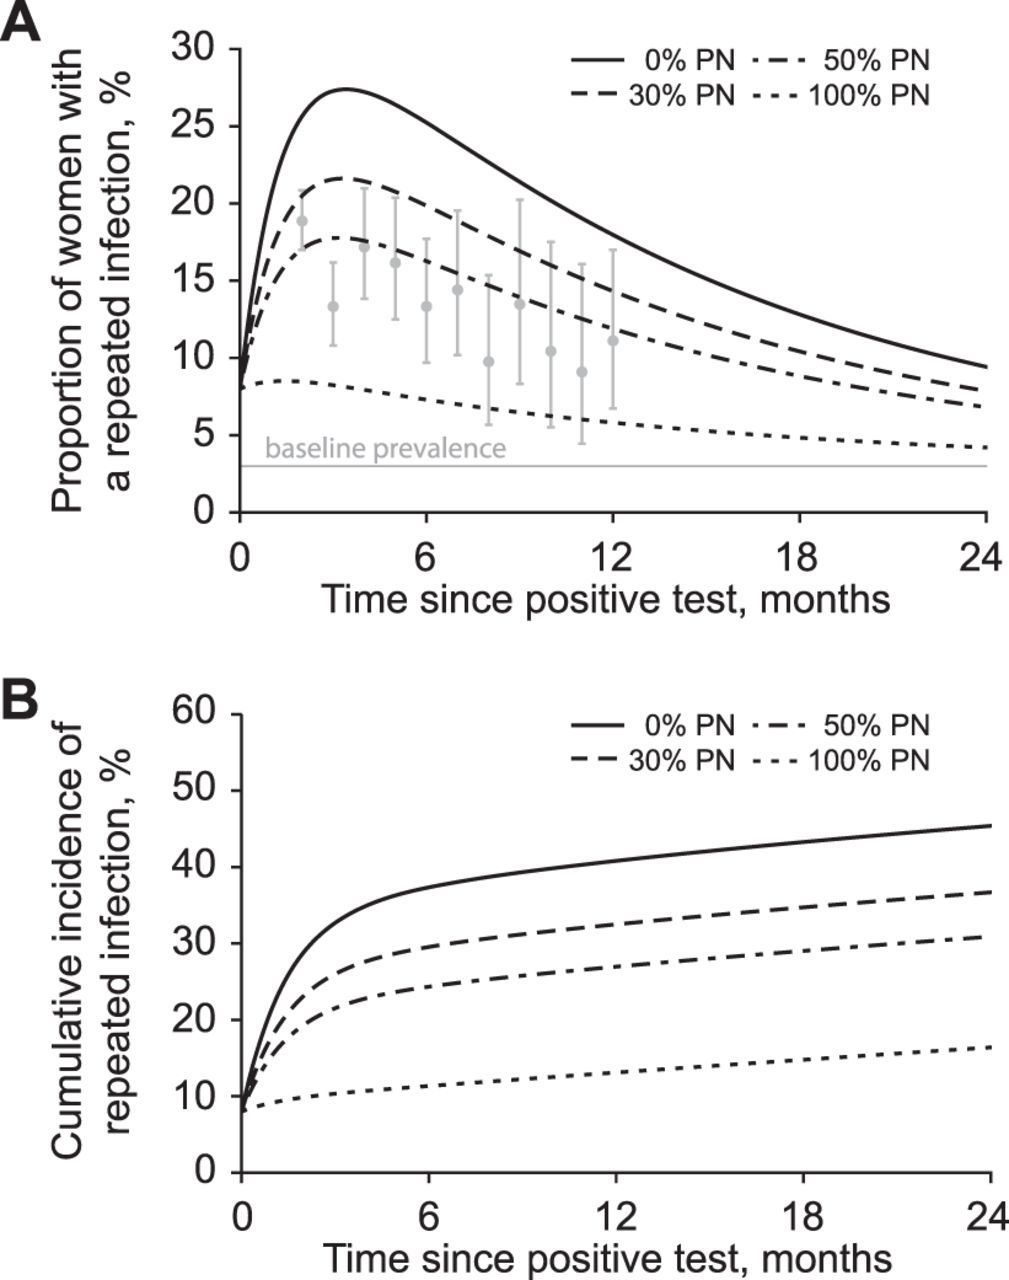
Proportion of women with a repeated chlamydia infection (A) and cumulative incidence of repeat infections (B) after successful treatment, under different levels of partner notification (PN). Chlamydia prevalence in the general population was calibrated to 3%. Partner notification is performed for the current partner at the time of treatment of the woman. In (A), the dots denote positivity of repeated tests as shown in the light gray bars of figure 1B together with 95% CIs. In all scenarios, the intervention parameters are set to zero, only the partner notification uptake at the time of index case treatment is changed from 0% to 100%.
The timing of the peak in the percentage of women with a repeated infection is barely influenced by partner notification levels between 30% and 50%; when 50% of current partners are successfully notified and treated, the proportion of women with a repeat infection is highest 3.2 months after treatment (figure 2A). An uncertainty analysis of the time point at which the prevalence of repeated infection is highest for different values of the parameter values including different levels of partner notification (table 1) showed a median time interval of 3 months (95% credible interval: 1.1–5.6 months) (appendix figure S2).
At testing rates of 0.1/year (equivalent to 9.5% of women being tested at least once every year on average), there is little relative additional impact in reducing population chlamydia prevalence of repeated testing compared with testing alone (figure 3). Successfully treating 50% of current partners has a greater impact on reducing prevalence than successfully treating 50% of the women 3 months after treatment. A strategy with both partner notification and repeated testing yielded only a small additional reduction in population prevalence compared with doing only partner notification. The order of the three strategies and the additional impact on reducing population prevalence was similar for testing uptake of 0.3/year (appendix figure S3).

Impact of testing women for chlamydia at a rate of 0.1/year on reducing population prevalence under different assumptions of the repeated testing uptake and notification of the current partner at the time of test and treatment. Note that the y-axis starts at a prevalence of 2%.
Discussion
In the cohort studied, 25% of women with an initial positive chlamydia test had a repeat test 2–5 months later; 15% of repeat tests were also chlamydia positive. Women with an initial negative chlamydia test had the same level of repeat positive tests (3%) as the cohort as a whole. A dynamic transmission model suggests that the probability of a repeated chlamydia infection is highest 2–5 months after treatment. The estimated impact of repeated testing in women on reducing chlamydia population prevalence was less than the impact of notifying and treating the current sexual partner.
The advantage of the MarketScan database is that there are longitudinal records of healthcare attendances and claims for services for more than 2 million US women enrolled in commercial health insurance plans. There are, however, limitations to the analysis of data about repeated testing for chlamydia. First, the reasons for repeat testing are not documented in the data set. This makes it difficult to know why most repeated tests among chlamydia-positive women were done 1–2 months after the date of the initial test. Assuming a short delay between testing and treatment, the timing is suggestive of tests of cure, but the US Centers for Disease Control and Prevention guideline only recommends this in limited circumstances.7 Second, if a woman received her first chlamydia test shortly before leaving the insurance plan, repeated tests might not have been counted. Furthermore, we determined the positivity of tests by linking the test to treatment data. It is possible that not all women with a positive test received treatment and therefore that some tests were incorrectly assigned negative. However, neither limitation is likely to be a major source of underestimation. Limitations relating to the generalisability of the MarketScan data to US women in general and to underestimation to overall chlamydia testing levels through exclusion of tests done in other settings have been discussed in detail elsewhere.12 In this study, it is reasonable to assume that a woman who received a chlamydia test and treatment within her insurance plan is likely to have been followed up by the same physician.
Our estimates of the percentage of women with a repeated test are very similar to other published estimates.20 ,21 An analysis of US Laboratory Corporation data from June 2008 to May 2010 from women aged 15–34 years also showed that retesting was more common after a positive test compared with a negative test.21 The percentage of positive tests that was repeated was slightly higher (49% vs. 40%), but this might be explained by the wider age range of women studied. The difference cannot be explained by the inclusion of tests done ≥3 weeks after treatment because using this criterion in our study resulted in only 1% more repeated tests. Our estimates of the repeated testing uptake are in the same range as found in a recent review.20
The advantage of the pair model for describing chlamydia transmission is that it explicitly takes into account the formation and separation of sexual partnerships. The model has some limitations, which we have discussed elsewhere.15 Since we describe the transmission of chlamydia in the general population, our baseline scenario assumes that the mean duration of sexual partnerships is roughly half a year. Partnership durations of this length permit reinfection and strongly contribute to the repeated infection rates. In a population with higher partner change rates, but shorter partnership durations, reinfection within partnerships is less likely to occur but repeated infections from new partners would be higher. Our uncertainty analyses, which did include shorter partnership durations, did not change the results. The model estimates of repeat infection rates are consistent with data from trials of partner notification,22 ,23 and the cumulative incidences obtained in the model are consistent with published estimates.24
The findings of our modelling study suggest that there is a critical period 2–5 months after treatment of chlamydia infection when the risk of a repeated infection is highest. This supports the rationale for guidelines that recommend repeat testing 3–6 months after treatment.7 ,9 ,10 If the repeated test is done too soon after treatment, many women at risk of repeated infection will not yet have become infected and would be falsely reassured by a negative test. If delayed too long, the infection might have cleared naturally but already caused upper genital tract damage. At the population level, however, repeat testing had little impact on reducing chlamydia prevalence because most chlamydia infections were in ongoing partnerships and detecting and treating these did not prevent much onward transmission. This is compatible with the finding of a modelling study, which examined individual- and population-level effects of partner notification in the general population.25
This study has implications for clinical management and research. In theory, partner notification should prevent reinfection in a person who has been treated for chlamydia. A prospective study in Sweden found that only 4% of people treated for chlamydia were infected 6–8 months later after treatment and notification of an average of 3.2 partners per index case.26 The high observed levels of repeat chlamydia in many studies in other developed countries1 ,11 suggest, however, that either partner notification is often not done or is not done adequately. In the UK, the average number of partners treated per index case is about 0.5.19 Repeat testing after treatment for chlamydia therefore has potential as an adjunct to partner notification. While modelling studies like ours can give insights into the expected effects of repeat chlamydia testing and partner notification in reducing population prevalence, it is not known whether these will be achieved in practice. A systematic review of interventions to increase repeat chlamydia screening did not identify an optimal strategy, and partner notification uptake were not reported.20 This modelling study provides information that can be used to design randomised controlled trials to determine the most effective interventions combining partner notification and intensified repeated testing to prevent chlamydial reinfection.
Key messages
-
Chlamydia positivity in repeated tests after an initial positive test was higher than after an initial negative test.
-
The mathematical model suggests a peak in the proportion of women with a repeat chlamydia infection between 2 and 5 months after treatment.
-
This study provides information that can be used to design randomised controlled trials to determine more effective interventions to prevent chlamydial reinfection.
References
Supplementary materials
Supplementary Data
This web only file has been produced by the BMJ Publishing Group from an electronic file supplied by the author(s) and has not been edited for content.
Files in this Data Supplement:
- Data supplement 1 - Online supplements 1
Footnotes
Funding This work was supported by the Swiss National Science Foundation (grant numbers 320030_118424, 320030_135654, PDFMP3-124952 and PZ00P3_136737) and the US Centers for Disease Control and Prevention (Atlanta, USA). The findings and conclusions in this manuscript are those of the authors and do not necessarily represent the views of the Centers for Disease Control and Prevention.
Competing interests In 2010, JCMH and NL received fees from GlaxoSmithKline for attending a meeting about chlamydia vaccines.
Provenance and peer review Commissioned; externally peer reviewed.