Article Text

Abstract
Background: Genital warts (condyloma acuminatum) remain one of the most commonly reported sexually transmitted infections (STI) worldwide. Most genital warts are caused by non-oncogenic human papilloma virus. Recurrence is common and many patients receive several rounds of treatment. There are limited data in the literature on the burden of illness and costs associated with genital warts at a population level.
Methods: Episodes of anogenital warts (AGW) were identified from the physician billing database, hospitalisation records and STI clinics from 1998 to 2006. To be included from the physician billing and STI databases, the person had to have a claim that had a diagnosis of condyloma acuminatum (078.11), viral warts (078.1), viral warts unspecified (078.10) or other unspecified warts (078.19), as well as one of the relevant fee codes associated with the treatment of AGW. To be included from the hospital database, the person could be of any age and have a diagnosis of AGW (A63.0), condyloma acuminatum (078.11), viral warts (078.1 or B07), viral warts unspecified (078.10) or other unspecified warts (078.19) in any of the diagnosis fields, as well as one of the relevant procedure codes associated with the treatment of AGW.
Results: A total of 39 493 people was diagnosed with AGW and during this period they had a total of 43 586 episodes. The average cost per episode of AGW was $C190 ($C176 for men; $C207 for women). The majority of treatment was with ablative therapy alone (98%).
Conclusions: AGW are associated with a significant burden of illness and costs to the healthcare system.
Statistics from Altmetric.com
Human papillomavirus (HPV) is a large family of viruses and approximately 40 of these are transmitted sexually.1 Of these 40 HPV subtypes, 15 are considered high risk and can lead to the development of cervical cancer.2 3 The other subtypes of HPV are considered low risk and include types 6 and 11, which cause condyloma acuminatum or anogenital warts (AGW).4
Two vaccines have been developed to protect against HPV disease: Gardasil (Merck Frosst, Quebec, Canada) and Cervarix (GlaxoSmithKline, Brentford, UK).5 6 Both vaccines contain HPV types 16 and 18, the high-risk serotypes associated with cervical cancer, but Gardasil provides additional protection against genital warts as it also protects against HPV types 6 and 11. Several studies have now shown that the use of HPV vaccine in girls aged 12 years is cost-effective in terms of protection against cervical cancer.7–15 However, the additional benefit of Gardasil compared with Cervarix, given its additional protection against genital warts, is unclear. This is partly because published data on the epidemiology, treatment and costs of genital warts at a population level within North America are lacking. Most recently, however, administrative data were used to describe the incidence and prevalence of AGW in Manitoba for the period 1985–2004 and the associated costs for the period 1995–2003.16 17 We conducted a population-based study to determine the epidemiology, treatment and costs associated with AGW in British Columbia, Canada, to validate the Canadian data. Ethics approval for this study was obtained from the University of British Columbia’s Behavioural Ethics Committee.
METHODS
Databases
Data were obtained from all episodes of AGW in British Columbia with physician, hospital or sexually transmitted infection (STI) clinic visits in 1998–2006. The sources of these data were the STI clinic, PharmaNet (College of Pharmacists), Medical Services Plan (MSP) (the physician billing database) and the hospitalisation separation databases18 in British Columbia. The reliability and validity of all datasets are high, with underreporting and misclassification being minimal.19 Data were obtained from 1998 to 2006 for all episodes of AGW in British Columbia.
The PharmaNet database contains a record for all ambulatory care prescriptions dispensed to all residents of British Columbia. Data include the date of dispensing, drug name and dose, duration of treatment, age and sex of the resident and geographical location of the pharmacy. Prescriptions that were analysed for the purposes of this study included those used for the treatment of genital warts such as fluorouracil, imiquimod, podofilox, podophyllum, salicyclic acid and podophyllum.
The MSP, hospitalisation and STI clinic databases included patient age, sex, date of visit, physician reimbursement claims, according to the International Classification of Diseases, 9th Revision (ICD-9 codes) and physician specialty. The provincial STI clinic provides care for over 10 000 clients per year and of these, approximately 10% have AGW. For the MSP records, only patients 15 years of age and older were included as many patients under that age were treated for plantar warts.
Records from these databases were linked by a third party (Data Access Services, Ministry of Health) using the patients’ personal health number; however, personal identifiers were removed in the final dataset used for analysis to protect confidentiality and anonymity. Each prescription was linked to the most recent physician or hospitalisation visit. Dispensed prescriptions that could not be linked to a visit (eg, refills or phone prescriptions) were excluded from the analysis. The final database thus included only those who were hospitalised or went to physicians or STI clinics for the treatment of AGW, some of whom may have been treated with a prescription medication.
Definitions
In defining a case, we adapted the methodology used in the Manitoba study.16 In the physician billing database, for patients 15 years of age or older, visits were identified using the following criteria: all physician visits with a diagnostic code for condyloma acuminatum (078.11) and any visits with a diagnosis code of viral warts (078.1), viral warts unspecified (078.10) and other specified viral warts (078.19) also required a genital-specific fee-item code that specifically stated “warts”, “condyloma” or “anal lesions”. For the purpose of calculating costs a wider selection of fee-item codes were used that did not specifically state “warts”, “condyloma” or “anal lesions” but were classified as being associated with a genital-specific wart visit (ie, consultation and office visits). Any physician claims that had a diagnosis of 078.1, 078.10 or 078.19 and one of the wider selections of relevant fee items in the 2 weeks before and the 2 weeks after a specific wart visit were included. If a similar combination of diagnosis and fee-item codes occurred in the subsequent 2 weeks (ie, weeks 3–4 after a physician visit with a genital-specific wart fee item) then these physician visits were also included. Hospitalisations for AGW were identified from the hospitalisation database based on the following criteria: all visits were included if a diagnosis code of A63.0 (AGW) or 078.11 appeared in any of the 12 diagnosis fields; if a diagnosis code of B07 (viral warts), 078.1, 078.10 or 078.19 appeared in any of the 12 diagnosis fields then a relevant procedure code also had to appear in one of the procedure fields.
In determining an episode of AGW, all physician, hospital and STI clinic visits were included until a 12-month disease-free period of genital warts was observed (ie, no specific genital wart claim was observed in the physician, hospitalisation or STI clinic databases). An episode was incident if it was preceded by a 12-month disease-free period of genital warts, otherwise it was considered to be prevalent. As some episodes in 1998 could have been prevalent cases from earlier years, to determine incidence we considered data from 1999 onwards. Annual prevalence rates were determined as of 31 December for each calendar year. For the calculation of incidence and prevalence, we used British Columbia population estimates in the denominator from BC Vital Statistics. To calculate episode length only data from 1999 (excluding episodes that could have been prevalent cases from earlier years) and completed episodes (ie, a patient had a period of 12 months without treatment) were considered.
We determined whether rates changed over time using the Cochran–Armitage trend test. The Mann–Whitney test was used to test for differences in the number of episodes and episode length between genders. All analyses were conducted using SAS statistical software, version 9.1.
Burden of illness and costs
Costs were assigned to health resource utilisation used for the treatment of an episode of AGW. The costs associated with hospital inpatient cases were estimated using the resource intensity weight and the hospital cost per weighted case. STI clinic costs were calculated using the number of genital wart treatments in 2006 and estimates of costs for nursing and physician time. Physician billing for office visits was calculated using the fee-item costs associated with a genital wart visit provided in the MSP database and costs for prescription drugs were calculated using the costs given in the Pharmanet database. We used the British Columbia health consumer price index to inflate the costs to 2006 Canadian dollars.
RESULTS
Incidence
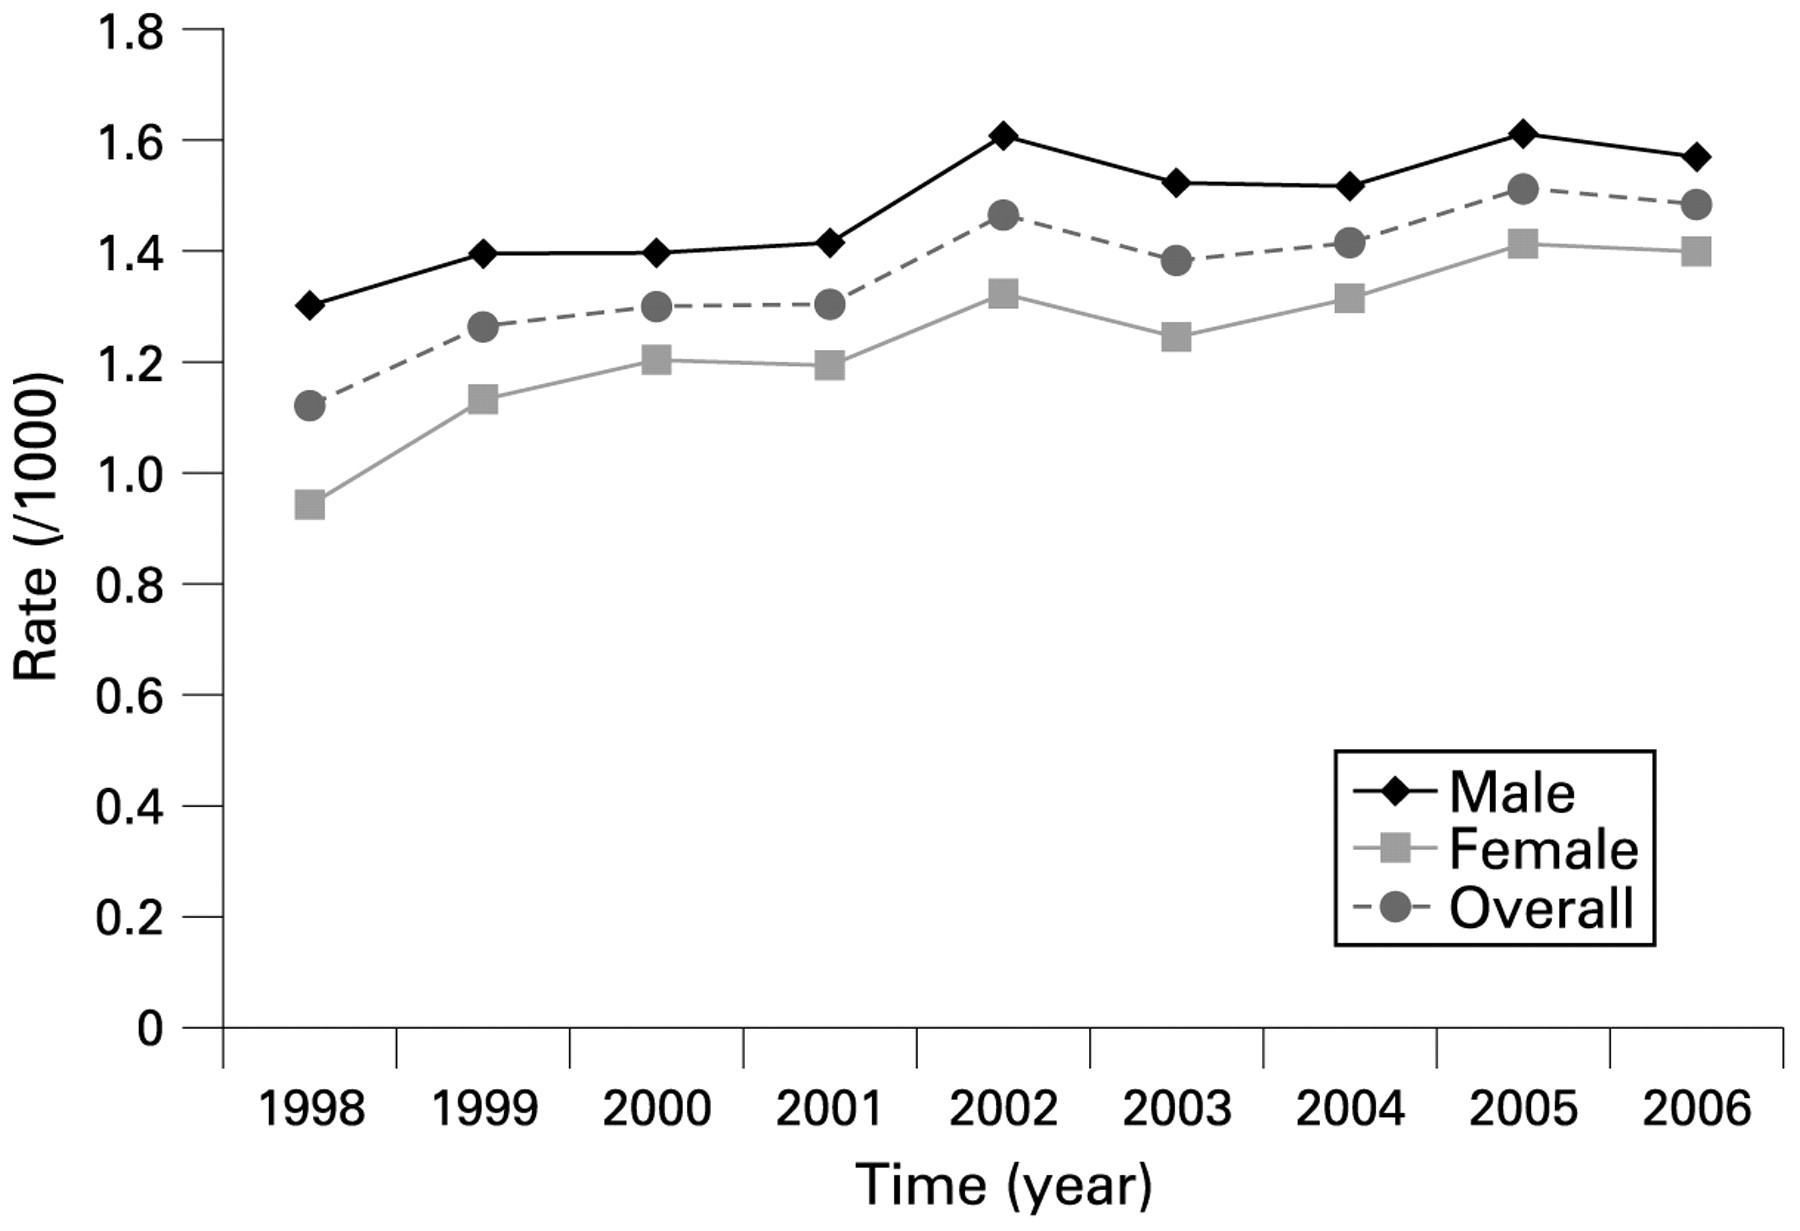
According to our definitions, we identified a total of 39 493 people with 43 586 episodes of genital warts from 1998 to 2006. The majority of these patients were identified from the physician billing (76%) and STI clinic (15%) databases. Hospital records alone accounted for 7% of the episodes, whereas 2% of episodes were identified in both the medical claims and hospitalisation records. There were 39 122 incident episodes of AGW from 1999 to 2006. In 1999, the overall incidence was 1.07 per 1000 population and this increased slightly in 2006 to 1.26 per 1000 population (p<0.001) (fig 1).

Incidence rates (per 1000) stratified by gender from 1999 to 2006.
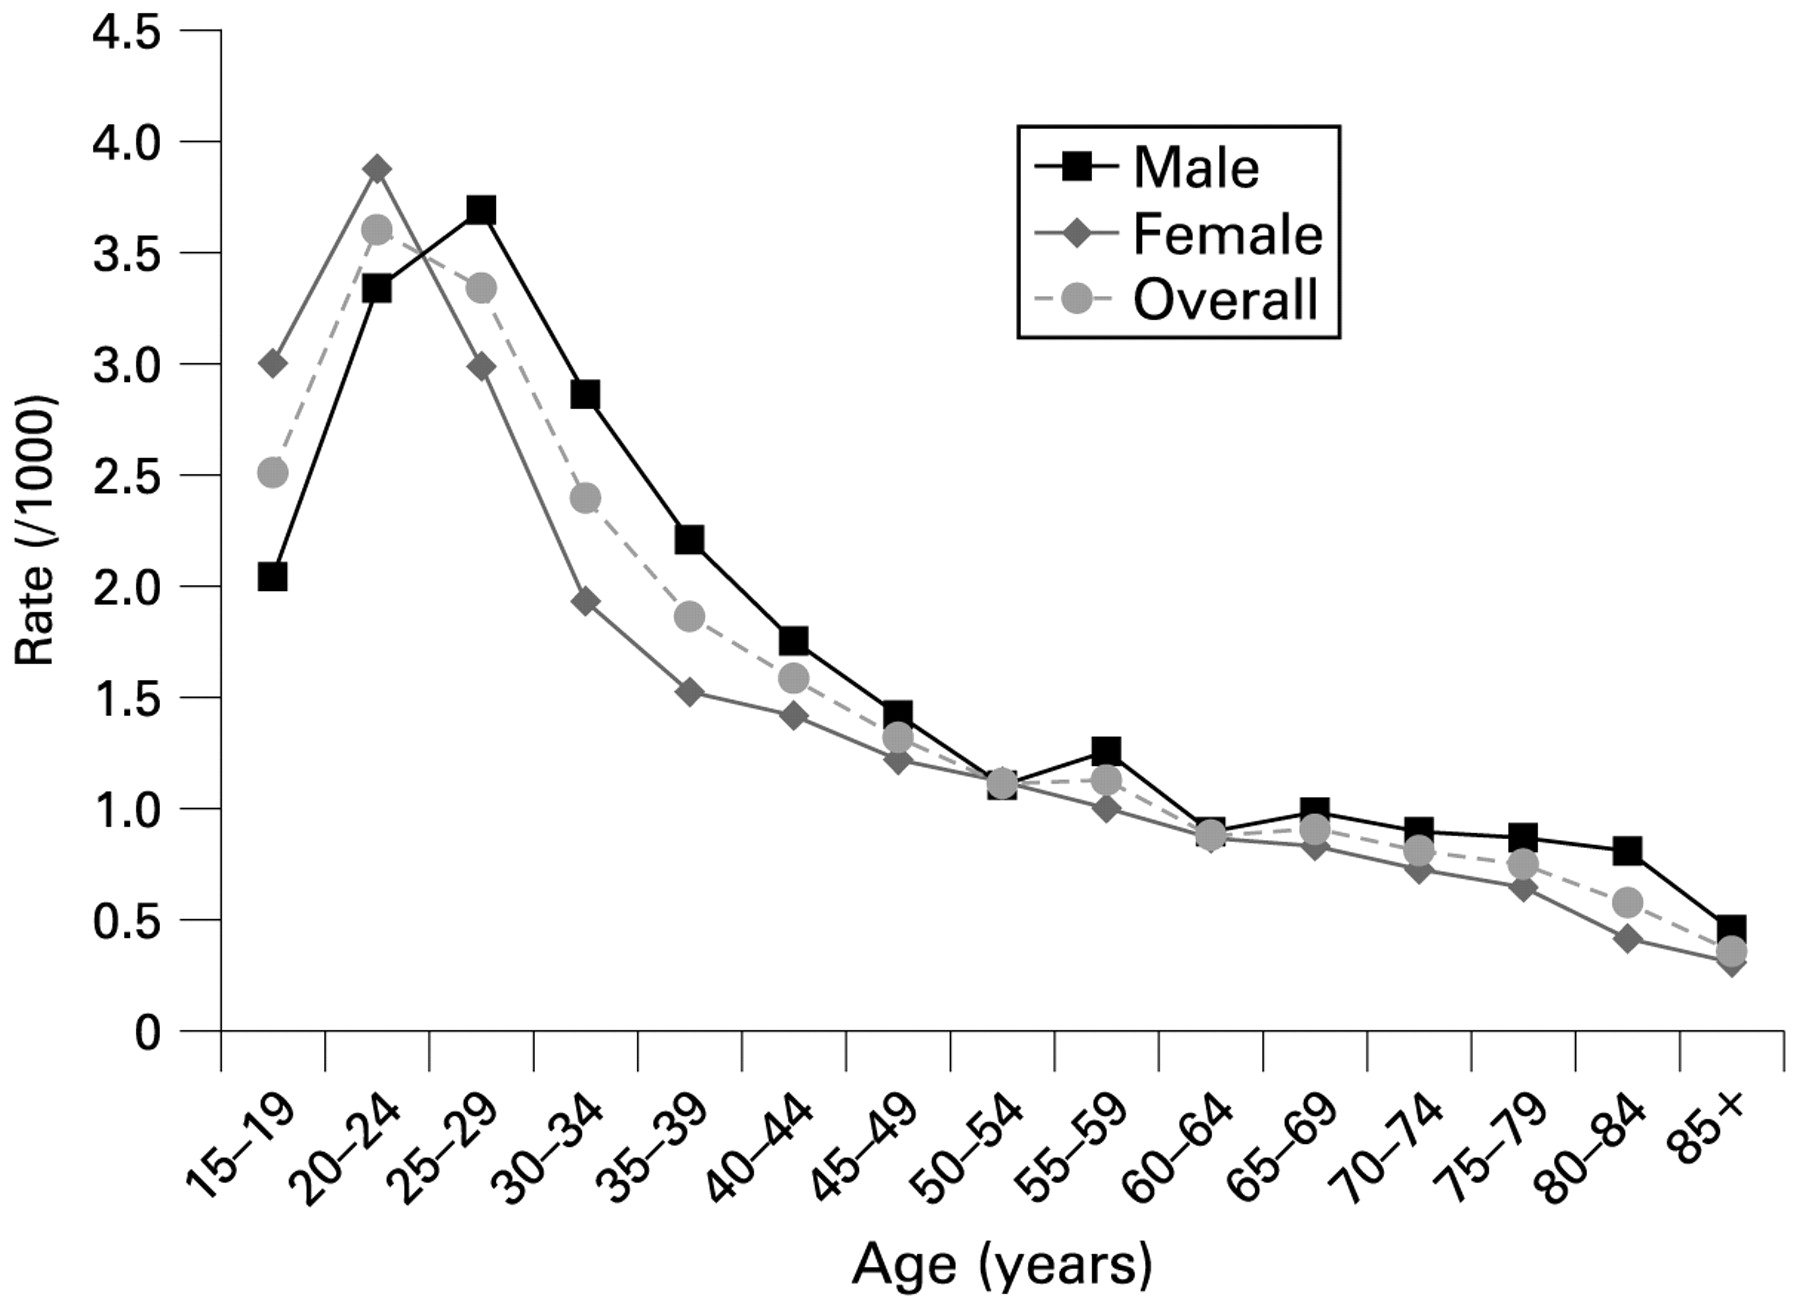
The overall incidence between 1999 and 2006 was always higher in men than women, with the 2006 rates being 1.31 per 1000 population in men and 1.21 in women. The latest data (2006) showed that the incidence was highest among women between the ages of 20 and 24 years (3.38 per 1000 population), whereas in men, the incidence peaked between the ages of 25 and 29 years (3.03 per 1000 population). Rates for both sexes decreased gradually with age thereafter (fig 2).

Incidence rates (per 1000) stratified by gender and age for 2006.
Prevalence
According to our definitions there were 50 634 prevalent cases of genital warts between 1998 and 2006. In 1998, the overall prevalence was 1.12 per 1000 population and this increased in 2006 to 1.48 per 1000 population (p<0.001) (fig 3). The overall prevalence between 1998 and 2006 was always higher in men than women, with the 2006 rates being 1.57 per 1000 population in men and 1.40 in women. The latest data (2006) showed that the prevalence was highest among women between the ages of 20 and 24 years (3.88 per 1000 population), whereas in men, the prevalence peaked between the ages of 25 and 29 years (3.69 per 1000 population). Rates for both sexes decreased gradually with age thereafter (fig 4).

Prevalence rates (per 1000) stratified by gender from 1998 to 2006.
Prevalence rates (per 1000) stratified by gender and age for 2006.
Burden of illness and costs
The average number of AGW experienced during 1998–2006 was 1.10 episodes per patient in those who were diagnosed with an AGW. On average, men had slightly more episodes than women (1.13 vs 1.08; p<0.001). The mean episode length was approximately 2.5 months (69 days), with the physician and clinic-related episodes being 71 days and 80 days, respectively, whereas the hospital-related episodes were much shorter (14 days) (table 1). If patients were seen both in the hospital and physician office, their average episode length was much longer (150 days). The average episode length was significantly longer in men than women (76 days in men vs 61 days in women, p<0.001).
Approximately a third of men and a quarter of women had only one medical contact per episode of genital warts. On average, men had 2.8 medical contacts per episode compared with 2.7 in women. Medical contacts per episode ranged from one to over 20 in both sexes.
In 2006 Canadian dollars, the total direct medical cost burden of AGW from 1998 to 2006 was $C8 295 101 (approximately $C922 000 per year). The average cost per episode associated with a diagnosis of genital warts was $C190 (SD $C1004) ($C176 (SD $C1136) for men; $C207 (SD $C829) for women) in 2006 (table 2). People treated as outpatients in physician offices or clinics had an average cost of $C111 (SD $C180) (physician offices $C110 (SD $C189); STI clinic $C111 (SD $C126)), whereas the average cost associated with hospitalised patients was $C1026 (SD $C2986). The average cost for people treated in both hospitals and physician offices was $C876 (SD $C3982). The majority of treatment was with ablative therapy alone (98%). Of the 2% who were also treated with drugs, 50% of episodes were treated with fluorouracil alone at a mean cost of $C14.75 (SD $C9.85); 23% were treated with podofilox alone at a mean cost of $C36.79 (SD $C22.01) and 19% were treated with podophyllum at a mean cost of $C20.71 (SD $C12.57).
DISCUSSION
We report on the incidence, resource use and costs associated with a population-based assessment of the treatment of AGW in British Columbia, Canada. Our results show that the treatment of AGW results in a significant burden on the healthcare system. The overall incidence is 1.26 per 1000 population, at an average cost of $C190 per episode for treatment. In British Columbia, this translates into almost $C1million in annual, direct medical costs.
Key messages
The incidence and prevalence of AGW in Canada appear to be similar to other jurisdictions.
The costs associated with the diagnosis and treatment of AGW in Canada are significant.
Treatment of AGW was mostly performed with ablative therapy rather than pharmaceutical products.
These data may help inform decision-makers regarding the cost-effectiveness of vaccination and screening strategies for HPV.
Our estimates on the incidence of genital warts are of similar magnitude to the Manitoba study (in 2004: men 1.54 per 1000, women 1.23 per 1000)16 and the Genitourinary Medicine Study in the UK (1.3 per 1000).20 These results, in their agreement with ours, are reassuring in that, in the UK AGW are a reportable communicable disease. Also the UK health system is similar to that in Canada, with a social funding and universal access to care ensuring that people of all socioeconomic status are captured by the data. We had deliberately used similar case definitions to Manitoba in order to determine the comparability of results from the two Canadian provinces. However, our results are slightly lower than those found among privately insured patients in the USA,21 where the 2004 the incidence rate was 1.7 per 1000 in men and 1.5 per 1000 in women and Conway et al22 in Australia (2.2 per 1000).
Like ours, most of these studies also found that the peak occurrence in men happened slightly later in life than in women. In contrast to the other studies, however, our study showed a lower peak incidence in women and men, 3.38 and 3.03 per 1000 population, respectively. The peak incidence in women ranged from 4.6 to 8.6 per 1000 population and in men the incidence ranged from 4.0 to 8.0 per 1000 population.16 20–22
Similar to Insinga et al,23 our study also showed that on average episodes of care lasted for a long time, approximately 2–3 months, but in contrast to Insinga et al,23 who found genital warts episodes involved 3.1 physician office visits with an average cost of US$436, we showed a similar number of physician visits to the Australian data (2.8 vs 2.9 physician visits).24 Similarly, our average costs were also in agreement with the Manitoba costs ($C200 per individual treated)17 but lower than the Australian costs (US$297 per woman treated and US$263 per man treated) and USA costs (US$404 per female episode treated and US$477 per male episode treated).23 All studies, including ours, showed that physician-applied treatment was more common than patient-applied prescription medications.17 23–25
This study had several limitations that should be noted. First, a large component of our dataset was from the physician billings dataset. Although the dataset is cleaned, miscoding and misclassification may occur. In our calculation of incidence and prevalence, only treated AGW can be counted. The incidence and prevalence are probably greater as those electing not to seek treatment would not be captured by our data sources. Second, we excluded data from individuals less than 16 years of age in order to minimise contamination from non-genital wart data, but in doing so, we may have underestimated the incidence of AGW. Third, although we included the data from British Columbia’s largest sexually transmitted disease clinic, there are other clinics that were not included such as family planning clinics, youth clinics and student health centres. However, the inclusion of these would account for a small proportion of cases that were omitted from our analysis. Fourth, we only included direct medical costs associated with the treatment of genital warts. Given the number of repeat visits to the physician and associated costs with cervical intraepithelial neoplasia type 1 related to HPV types 6 and 11, we have probably underestimated the costs of genital wart treatment as HPV-6 and HPV-11 are frequently associated with low-grade dysplastic lesions, and studies have shown that over 10% of low-grade squamous intraepithelial lesions have either HPV-6 or HPV-11 present.26 In British Columbia, over 20 000 women have low-grade abnormalities on their Pap smears per year, and thus potentially 2000 women per year have HPV-6/11-related lesions.27 These low-grade lesions result in repeat practitioner visits for follow-up Pap smears, repeat Pap testing and, not infrequently, colposcopy evaluations. The cost of these interventions has not been included in this analysis. Finally, we have not included the decrement in the patient’s quality of life in determining the burden associated with genital warts. This disease has a significant effect on patients’ quality of life, which leads to even greater societal costs. This reduction in the patient’s quality of life is of similar magnitude to that seen in patients with moderate to severe asthma or those with osteoarthritis.28 29
Our study shows that the treatment and associated costs with AGW are significant. Among other factors, this burden and cost should be considered when deciding on which HPV vaccination programmes should be provided by publicly funded health systems.
Acknowledgments
The authors would like to thank the British Columbia Ministry of Health and the College of Pharmacists for providing the data for this project. They acknowledge the contribution of Dr Marc Brisson in the design phase of the study period. Dr Brisson was an employee of Merck Frosst Canada at the time of his contributions and is now a Canada Research Chair in Mathematical Modelling and Infectious Diseases at the University of Laval, Quebec, Canada.
REFERENCES
Footnotes
Competing interests: None.
Ethics approval: Ethics approval for the study was obtained from the University of British Columbia’s Behavioural Ethics Committee.
Contributors: FM conceived the study, obtained the data, participated in the study design and analysis and co-wrote the first draft of the manuscript. GO participated in the study design, data interpretation, reviewed the final draft and gave approval for the manuscript. LC participated in the study design and functioned as the statistical analyst for this study, she contributed to several drafts of the manuscript and gave approval for the final draft. EK participated in the study design and data interpretation and gave approval for the final draft. CAM participated in the study design and analysis, supervised the statistical analysis, co-wrote the first draft of the manuscript and gave approval for the final draft. FM and CAM function as co-leads on the project and take responsibility of the content.
Linked Articles
- Brief encounters