Article Text

Abstract
Objectives To investigate the epidemiology and risk factors of gonorrhoea (GC) or chlamydia (CT) coinfection in an HIV-positive US military cohort, focusing on the time after participants' knowledge of HIV diagnosis.
Methods The authors analysed data from 4461 participants enrolled in the US Military Natural History Study cohort for GC or CT infection ≥6 months after their HIV-positive test.
Results During a mean follow-up of 7.08 years, 482 (11%) participants acquired a GC or CT infection. Of these, 283 (6%) acquired a GC infection, 278 (6%) acquired a CT infection and 123 (3%) had multiple GC or CT infections during follow-up. Risk of GC or CT infection was significantly greater in those younger, male, African–American and with a history of GC or CT infection.
Conclusions Frequent GC and CT diagnoses observed among members of this HIV-positive cohort indicate substantial ongoing risk behaviours that raise concerns for HIV transmission and underscore the need for continued screening to help identify and treat these sexually transmitted infections in this population.
- HIV
- syphilis
- gonorrhoea
- military
- epidemiology (clinical)
Statistics from Altmetric.com
Introduction
Infections due to HIV and sexually transmitted infections (STIs) remain significant public health issues in the general population and in the US military.1 2 Of particular concern is STI acquisition subsequent to knowledge of an HIV-positive test, which may indicate ongoing risky sexual behaviour that could put others at risk for HIV and STI transmission. The Centers for Disease Control (CDC) recommend STI screening for HIV-positive people as part of a comprehensive care package, including counselling and risk reduction interventions.3 Prevention in HIV-positive people is critically important to prevent further HIV transmission and reduce STI coinfection rates.
Two of the most common STIs, gonorrhoea (GC) and chlamydia (CT), can lead to serious health problems4 5 and increased healthcare costs.2 Rates of GC and CT are high in the USA,6 with rates of 0.99 for GC infections and 4.09 for CT infections per 1000 people in 20095; rates of CT have continued to rise despite national efforts promoting prevention and treatment.7 Rates of STIs are also high in the US military population8–10; 2009 estimated rates were 1.98 for GC infections and 11.4 for CT infections per 1000 person-years (PY).2 Incidence rates of HIV in the US military population have not declined and remain persistent over time.11–13 GC, CT and HIV are typically transmitted through unprotected sexual contact, and STIs in an HIV-positive person may increase the risk of HIV transmission due to increased viral shedding.14 GC and CT infection may also act as a surrogate for ongoing risk behaviour, so understanding the rates and risk factors of GC or CT coinfection among HIV-positive populations is critical.
Since many current estimates of GC or CT coinfection among HIV-positive people are based on retrospective or cross-sectional studies, or from independent sources of GC or CT data combined with HIV data,15–19 determining rates of coinfection in a prospectively followed cohort of HIV-positive people is warranted. Additionally, given that many GC and CT infections are asymptomatic and routine screening is rare, reporting based on symptomatic cases may underestimate the true rate of GC or CT coinfection among HIV-positive people.
The aim of this study was to investigate the epidemiology and risk factors of GC or CT coinfection in an HIV-positive US military cohort, particularly after knowledge of HIV diagnosis. It is critical to identify risk factors for acquiring GC or CT subsequent to an HIV-positive test since these raise important prevention and public health concerns.
Methods
Study population
A retrospective analysis was conducted using data from the US Military HIV Natural History Study (NHS), a prospective longitudinal study enrolling since 1986 Department of Defense beneficiaries 18 years or older and diagnosed as HIV positive through routine US military screening. Study details have been previously presented20; briefly, the NHS includes >5000 HIV-positive active and retired members of the US military and their beneficiaries receiving care at one of seven military treatment facilities. Prior to 2006, testing for GC or CT was primarily conducted based on symptoms and/or self-reported exposure history. Beginning in 2006, urine from this cohort was routinely screened using nucleic acid amplification tests for GC and CT infection at 6-month intervals.
In this analysis, we investigated GC or CT infection after HIV-positive diagnosis. Inclusion criteria included documented HIV-positive date, minimum 6 months of follow-up and no missing data on variables included in the analysis. A 6-month window, post-HIV detection was chosen to assure that participants had knowledge of their HIV-positive status (provided close to the test date) and decrease the possibility of GC or CT infection present prior to HIV diagnosis. HIV-positive dependent beneficiaries (such as spouses) were excluded from the analysis focusing only on members of the US military. This study was approved by the Uniformed Services University of the Health Sciences Infectious Disease Institutional Review Board.
Statistical analysis
Descriptive statistics reported include median and IQR for continuous variables and counts with proportions for categorical variables. Univariate tests were performed using two-sample Student t tests and Fisher's exact test for continuous and categorical variables, respectively. The primary outcome was time to first report GC or CT at least 6 months after HIV-positive test. Routine screening for GC and CT using urine nucleic acid amplification was implemented in the cohort in 2006. Prior to this, standard of care testing based on published guidelines was used to diagnose these infections in exposed or symptomatic individuals (ie, those with a clinical indication for testing). As in the civilian community, the methodology has evolved over time with replacement of culture for GC by molecular diagnostic methods and non-amplified by amplified molecular tests for CT according to published US guidelines, and prior to 1996, diagnosis was primarily by gram stain and culture of urethral or cervical specimen for GC and non-amplified molecular testing of urethral or cervical specimens for CT. This outcome was analysed using Cox proportional hazards models, including baseline covariates age, gender, race, duty status and prior GC or CT infection (prior to or <6 months after HIV diagnosis). The same model was also fit with a time-dependent covariate for receipt of highly active antiretroviral therapy (HAART). The model was stratified by HIV diagnosis before or on/after the first day of 1996 (the beginning of the widespread availability of HAART). The proportional hazards assumption was met by testing for a non-zero slope for time-dependent covariates. Participants without a documented case of GC or CT were censored at their last known study visit date. For each baseline covariate included in the model, HRs with 95% CIs for time to first GC or CT diagnosis were reported. For analysis of repeat infections, participants were considered to have a repeat GC or CT infection if they had a new infection 30 days or more after their last infection.
To assess rates after implementation of routine urine screening in 2006, capturing asymptomatic and symptomatic participants, an incidence analysis was also performed with a more stringent definition of GC or CT infection. The analysis end point was a positive laboratory test for GC or CT, preceded by a negative laboratory test and limited to 2006 and after. Patient self-report or clinician report not supported by a laboratory test was not included as in the first analysis. The first day at risk was defined as the day of initial documented negative GC or CT test. Participants without a subsequent positive test were censored on the day of their last known GC or CT test. This model includes fewer covariates due to fewer events in this population.
Crude event rates over time were calculated for both GC and CT individually and combined and reported as number of cases per 1000 PY of follow-up. All reported p values are two-sided; p values of <0.05 were considered statistically significant; no planned or post hoc adjustments for multiple comparisons were performed. All analyses were conducted using R (R Development Core Team, version 2.2.1, Vienna, Austria).
Results
From June 1986 to July 2010, a total of 5350 participants consented and enrolled in the NHS cohort; 4461 met our inclusion criteria (figure 1). Overall, the cohort studied was 45% African–American and 43% Caucasian, 96% male, 28.4 years median age (range: 17.7–74.2), 70% were active duty at baseline and 67% had a documented HIV-positive test before 1996 (table 1). During follow-up, 2663 (53%) were on HAART. The rate of tests per person increased from 0.04 pre-2006 to 1.33 in 2006–2010.

Flowchart of eligible participants.
Baseline characteristics of all eligible participants
Rates of GC or CT episode
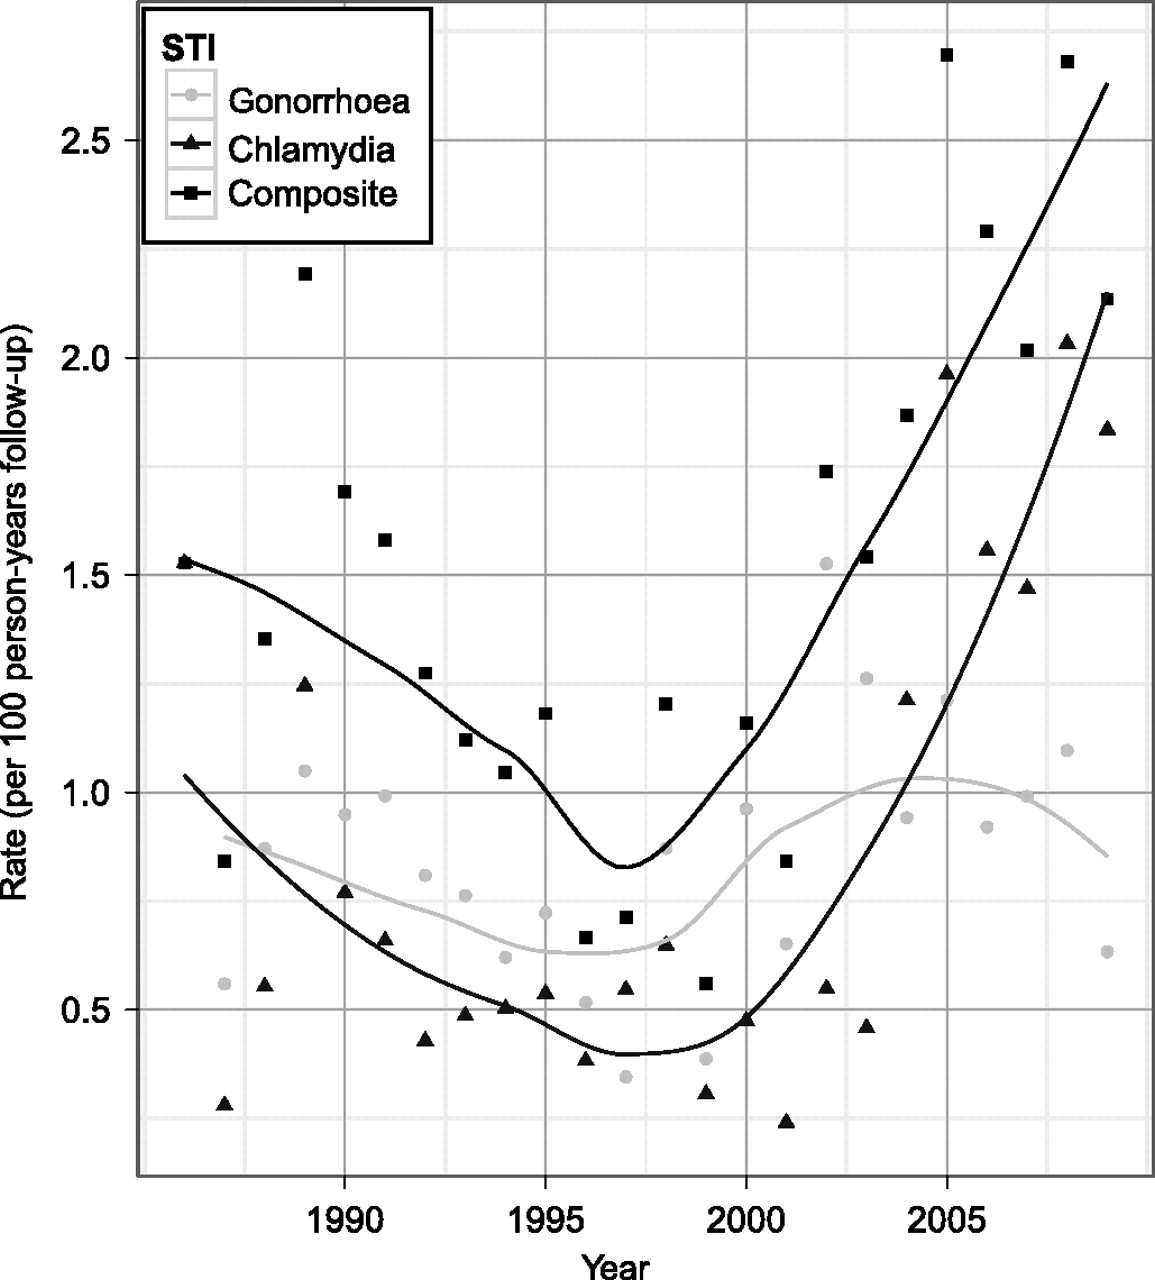
During a mean follow-up of 7.08 years (total follow-up 31 600 PY), 283 (6%) participants had at least one reported GC episode, 278 (6%) had at least one reported CT episode and 482 (11%) reported a GC or CT episode. This translates to a rate of 15.3 (95% CI 13.9 to 16.6) GC or CT reported episodes per 1000 PY during follow-up. Prior to 2006, when primarily symptomatic cases were collected, the rate was 8.3 (95% CI 7.3 to 9.4) for GC episodes, 6.4 (95% CI 5.5 to 7.4) for CT episodes and 13.3 (95% CI 11.9 to 14.7) for either GC or CT episodes per 1000 PY. The event rate for 2006–2010, after routine screening captured asymptomatic and symptomatic cases, was 10.3 (95% CI 7.6 to 13.1) for GC, 18.9 (95% CI 15.1 to 22.6) for CT and 25.9 (95% CI 21.4 to 30.5) for GC or CT per 1000 PY. Rates of reported GC or CT infection have been increasing over time in this cohort (test for trend, p=0.02), particularly since 2000 and particularly for CT infections (figure 2). Among those testing positive for GC or CT during the follow-up period, the median time between baseline and first GC- or CT-positive test (with the first day at risk being 6 months after HIV documented positive) was 2.8 years (range 0–22 years).

Rate of gonorrhoea (GC), chlamydia (CT) and GC or CT infection by calendar year. STI, sexually transmitted infection.
Since routine screening began in 2006, the number of positive GC tests for 2006–2009 (complete years) was 13/933 (1%), 16/1823 (1%), 20/1953 (1%) and 17/2127 (1%), respectively. For CT from 2006–2009, it was 24/929 (3%), 24/1815 (1%), 26/1952 (1%) and 34/2124 (2%), respectively. As the number of persons screened in each calendar year increased, the number of positive tests also increased; the proportion positive remained relatively constant over time.
Risk factors for GC or CT episode
In the univariate analysis for the entire period, participants with reported GC or CT episodes were more often younger (median age 26 years, IQR 23.2–30.8, range 18.61–52.27), African–American (58%), documented as HIV positive before 1996 (61%) and active duty military at baseline (82%) (table 1).
In the multivariate analysis, risk for GC or CT infection remained significantly greater in those younger, male, African–American and those with GC or CT infection prior to or <6 months after HIV diagnosis (table 2). Risk of infection decreased per year of age and was higher in younger participants (HR 0.94 for each year increase, 95% CI 0.92 to 0.95, p<0.001) and twice as high in male participants compared to female participants (HR 2.08, 95% CI 1.20 to 3.62, p=0.01). Risk remained higher in male participants even when analysing female participants separately and accounting for pre-2006 and post-2006 time periods (data not shown). African–Americans had infection risk 1.63 times higher than white people (HR 1.63, 95% CI 1.33 to 2.00, p<0.001). Those with a known history of GC or CT infection had infection risk 1.30 times higher than those with no history of infection (HR 1.30, 95% CI 1.07 to 1.59, p=0.01). There was no difference in infection risk between active duty at baseline and retired participants (HR 0.86, 95% CI 0.66 to 1.12, p=0.263). Being on HAART was included in a separate model as a time-varying covariate, adjusting for covariates previously discussed, and was not a significant predictor of GC or CT (HR 0.92, 95% 0.72 to 1.17, p=0.49).
Results from Cox proportional hazards multivariate analysis for GC or CT infection, stratified by HIV documented positive era
Repeat GC or CT episode
Assuming that all participants with GC or CT received effective treatment for their initial infection, we assessed the number with repeat GC or CT episode 30 days or more after their initial positive GC or CT test. A total of 123 (3%) participants had multiple GC or CT episodes documented during follow-up. Of those with repeat episodes, 87 (71%) had two, 24 (20%) had three, seven (6%) had four and five (4%) had five or more repeat episodes during follow-up. The median time to either GC or CT infection was 1040 days (range: 30–8063 days). Participants with at least one repeat episode were 100% male, 25.6 years median age, 64% African–American, 52% were documented HIV positive in 1996 or later and 91% were active duty.
Incidence of GC or CT infection
Finally, we considered how our results might change if limited to only after routine screening was implemented. This analysis was limited to participants with a documented negative GC or CT test followed by a positive or negative test. A total of 1293 participants had a documented negative GC or CT test; this population is understandably smaller since routine screening was only instituted in 2006. Of these participants, 86 had a subsequent documented positive GC or CT test for an overall incidence rate of 22.2/1000 PY (95% CI 17.5 to 26.9).
Due to small sample size, we were only able to evaluate a limited number of risk factors. We found the risk of an incident GC or CT infection was significantly greater in those younger (HR 0.94 for each year increase, 95% CI 0.91 to 0.97, p<0.001), African–American (HR 2.13, 95% CI 1.24 to 3.66, p=0.006) and male (HR 6.40, 95% CI: 0.88 to 46.59, p=0.067) compared to those without a subsequent positive GC or CT test. These risk factors trends are similar to those in the previously reported rate analysis.
Discussion
In this unique cohort of HIV-positive participants from the US military with equal access to healthcare and accurate HIV seroconversion dates due to mandatory periodic screening, 11% of participants reported GC or CT infection 6 months or more after testing HIV positive. Additionally, 3% of participants had repeat GC or CT infections during follow-up, and the median time was 2.8 years between HIV-positive and first GC or CT positive test date.
The proportion of positive GC or CT tests from 2006 to 2009 remained relatively constant, but the number of infections identified increased with routine screening in 2006. Continued detection of GC or CT in this population indicates a significant public health issue, and these findings support routine STI screening as part of comprehensive care currently recommended by the CDC for HIV-positive populations.3
Risk of reported GC or CT infection was higher in participants who are younger, male, African–American and with prior GC or CT infection. Restricting our analysis to incident GC or CT, although fewer risk factors were considered due to fewer events, higher risks among younger and African–American participants were again identified. These findings are similar to other studies conducted among HIV-positive US military members.21–23
Higher risk of coinfection among younger participants is consistent with findings from studies of other HIV-positive populations,2–24 the general US military population2 and the US population.6 This may be due to a number of factors, including higher numbers of sexual partners, inadequate use of protective measures or other insufficient reductions in risk taking despite knowledge of HIV-positive status; these and other possibilities require additional evaluation.
A higher rate of GC or CT infections in African–Americans is also consistent with CDC data showing higher rates in African–Americans compared to the general US population.6 The CDC hypothesises, based on surveillance data, that this may be due to a number of factors, including decreased access to healthcare, poverty and living in areas with high existing STI rates.25 It is of note that these findings remain consistent in our cohort despite many of these factors being mitigated by equal access to healthcare and lack of unemployment among US military members. One possibility is having partners outside the military without access to these benefits or a difference in social networks related to STI transmission,26 27 but these and other hypotheses require additional investigation.
Although male participants had a higher risk of coinfection, 96% of our cohort was male so conclusions based on gender should be made cautiously. Higher risk of coinfection for those with prior GC or CT infection may indicate a subpopulation engaging in high-risk sexual practices despite knowledge of HIV-positive status. Prevention efforts should target individuals presenting with their first STI, but those with repeat STIs are a critical priority for intervention and risk reduction.
Despite greater risks of coinfection for some populations, these occurred in all demographic groups. Our overall findings are consistent with reported occurrences of other STIs among HIV-positive persons in the NHS cohort, such as syphilis,28 and are consistent with STI rates in the US military.29 A recent study of the general US military population found a similar rate of CT at 11.4 per 1000 PY and a lower rate of GC at 1.98 per 1000 PY.2–10 Our findings are also similar to those in the general US population, with a recent systematic review of STI coinfection after HIV diagnosis finding a median prevalence of 9.5% for GC or CT infection.30
This study has a number of limitations. Behavioural data are not collected in this cohort due to concerns of placing participants at risk of violating the Uniformed Code of Military Justice; therefore, we were unable to determine the nature of specific high-risk practices in this predominately male population. Additionally, only urine is routinely screened for GC or CT urethral infections in this cohort so infections at extragenital sites are excluded. Participants negative for urethral GC or CT may have pharyngeal or rectal GC diagnosed through specimens from other anatomical sites,31 32 but this is not standard testing protocol in this cohort so we likely underestimate the true number of GC or CT infections. Study coordinators review medical records to capture infection from other anatomical sites but are limited to tests done within the military medical setting. Additionally, for those without a negative test on file, the timing of GC or CT infection was uncertain. Absence of confirmatory laboratory data for self-reported/medical history cases is a limitation but also indicates again that we most likely underestimate the true burden of disease given that asymptomatic cases may not result in a clinical diagnosis. Multiple GC and CT screening milestones have occurred during this study, including availability of ligase chain reaction tests and Federal Drug Administration approval of ligase chain reaction, which may have increased infection detection during follow-up. Generalisability of findings may be limited due to all participants being US military members and mostly male. Finally, participants diagnosed with and treated for STIs outside the military care system would not be captured in our system, once again leading to a likely underestimate of the true burden of coinfection. Strengths of this analysis include the extensive longitudinal and comprehensive follow-up, routine GC and CT urine screening beginning in 2006 and equal access to healthcare for all participants.
In this analysis, we identified GC or CT among HIV-positive participants enrolled in a prospective US military cohort. Infection with STIs subsequent to an HIV-positive test is a significant individual and public health issue that may indicate ongoing risky sexual behaviour. Clinicians should continue to incorporate screening and treatment of STIs and risk behaviour counselling into routine medical care for HIV-positive patients.3 33 Despite current prevention programmes, these findings indicate that GC and CT coinfection remains an issue among HIV-positive members of this US military cohort and lend support the current policy of routine GC and CT urine screening to help identify, diagnose and treat these STIs in this population.
Key messages
We found frequent rates of GC or CT infection subsequent to knowledge of an HIV-positive test result in this predominately male US military cohort.
Risk of GC or CT infection was greater in those younger, male, African–American and with prior GC or CT infection.
Although behavioural data are unavailable, routine GC and CT urine screening to help identify, diagnose and treat these STIs remains critically important.
Acknowledgments
We especially would like to thank the participants of the HIV NHS for making this research possible and to acknowledge all military HIV researchers who have contributed to the success of the HIV NHS over time. Specifically we would like to acknowledge the many contributions of and support from members of the IDCRP HIV Working Group: National Institute of Allergy and Infectious Diseases, Bethesda, MD: M Polis, J Powers, E Tramont; Naval Medical Center, Portsmouth, VA: T Lalani, S Banks; Naval Medical Center, San Diego, CA: N Crum-Cianflone, H Chun, M Linfesty; Walter Reed National Military Medical Center, Bethesda, MD: C Decker, S Fraser, J Hartzell, R Rossner, P Waterman, G Wortmann, T Warkentien, T Whitman, M Zapor; San Antonio Military Medical Center, San Antonio, TX: J Okulicz, S Merritt; Tripler Army Medical Center, Honolulu, HI: G Hsue, A Johnson; University of Minnesota, Minneapolis, MN: L Eberly; Uniformed Services University of the Health Sciences, Bethesda, MD: M Kortepeter; Walter Reed Army Institute of Research, Silver Spring, MD: S Peel, C Eggleston; Walter Reed Army Medical Center, Washington, DC: S Fraser, J Hartzell, R Rossner, P Waterman, M Zapor, G Wortmann.
References
Footnotes
Data from this research were presented in part at the Infectious Disease Society of America 48th Annual Meeting, Vancouver, Canada, 21–24 October, 2010, abstract 1433.
Funding Support for this work (IDCRP-000-26) was provided by the Infectious Disease Clinical Research Program (IDCRP), a Department of Defense program executed through the Uniformed Services University of the Health Sciences. This project has been funded in whole, or in part, with federal funds from the National Institute of Allergy and Infectious Diseases, National Institutes of Health, under Inter-Agency Agreement Y1-AI-5072. The content of this publication is the sole responsibility of the authors and does not necessarily reflect the views or policies of the NIH or the Department of Health and Human Services, the DoD or the Departments of the Army, Navy or Air Force. Mention of trade names, commercial products, or organisations does not imply endorsement by the US Government.
Correction notice This article has been corrected since it was published Online First. The sentence ‘positive GC or CT test for an overall incidence rate of 2.22/1000 PY (95% CI 1.75 to 26.9)’ has been updated to read ‘positive GC or CT test for an overall incidence rate of 22.2/1000 PY (95% CI 17.5 to 26.9)’.
Competing interests None.
Ethics approval Ethics approval was provided by Infectious Disease Institutional Review Board at the Uniformed Services University of the Health Sciences.
Provenance and peer review Not commissioned; externally peer reviewed.