Article Text

Abstract
Objectives To evaluate and compare Chlamydia trachomatis (CT) diagnostic test practices of different sexually transmitted infection (STI) care providers in 16–29 year olds from one defined geographic Dutch region (280 000 inhabitants). Both number and proportion of positive CT tests (ie, test positivity) were assessed, and factors associated with these outcomes.
Methods Data on laboratory testing and diagnosis of urogenital, anorectal and oropharyngeal CT between 2006 and 2010 were retrieved from general practitioners (GPs), gynaecologists, an STI clinic and a population-based chlamydia screening programme. Multivariable regression analyses explored associations between age, sex, test year, socio-economic status (SES) and STI care provider and the outcomes being the number of tests and test positivity.
Results Overall, 22 831 tests were performed (1868 positive; 8.2%). Extragenital (ie, anorectal and oropharyngeal) tests accounted for 4% of all tests (7.5% positive) and were almost exclusively (99%) performed by the STI clinic. STI clinics tested most men (37.2% of all tested men), whereas GPs tested most women (29.9% of all tested women). GPs and STI clinics accounted for 73.3% (1326/1808) of urogenital CT diagnoses. In women, the number of tests increased with age, whereas test positivity decreased for all STI care providers. Lower SES was associated with higher test positivity in GP and gynaecology patients.
Conclusions STI clinics performed most CT tests in men, whereas GPs performed most CT tests in women. GPs and STI clinics accounted for the majority of positives. Extragenital CT testing is rarely performed outside the STI clinic and needs to be promoted, especially in men who have sex with men.
- CHLAMYDIA TRACHOMATIS
- SURVEILLANCE
- LABORATORY METHODS
- CLINICAL STI CARE
Statistics from Altmetric.com
Introduction
Chlamydia trachomatis (CT) is the most common bacterial sexually transmitted infection (STI) in Europe. The proportion of positive CT tests is generally 5–10% in sexually active young people.1 The high proportion of asymptomatic episodes result in many undiagnosed CT infections.1 If left untreated, CT can lead to several adverse sequelae, such as pelvic inflammatory disease (PID), and infertility.2
Dutch STI care is organised in a similar way as in the UK3 and Australia,4 with a major role for public health care, that is, STI clinics, and general practitioners (GPs). These STI clinics serve specific high-risk groups, including young people (aged <25). In hospitals, CT tests are predominantly performed by gynaecologists as part of a diagnostic work-up in fertility counselling, before inserting intrauterine devices, or as part of the diagnostic evaluation of suspected PID.
In addition to regular STI care as described above, CT screening programmes have been established, such as in the UK and the Netherlands.5 ,6 Each of these STI care providers or programmes will contribute to CT control, yet a comprehensive assessment of their relative contribution in terms of testing, diagnosis and the populations that they serve is thus far unavailable. Sentinel data from Dutch GPs suggest that GPs diagnose the lion's share of CT cases, with estimates reaching 70% (vs 30% in STI clinics).7 Data from the National Chlamydia Screening Programme (year 2013) in the UK (15–24 year olds) show that the contribution of GPs seems smaller, accounting for 14% of all positive tests (vs >40% by genitourinary (GUM) clinics).8 Recently, an extensive evaluation of Australian CT surveillance was performed, although not providing the relative contribution of the different STI care providers.9 Moreover, the contribution of other STI care providers (eg, gynaecologists) has not yet been explored.
The determinants age,9 sex9 and socio-economic status (SES)10 have all been associated with CT test practice, that is, the number of tests performed and the proportion of positive tests, although it is unknown whether these associations differ between Dutch STI care providers.
While CT control strategies focus on urogenital CT testing, men who have sex with men (MSM) guidelines recommend that extragenital testing is also performed.11 In addition, the prevalence of anorectal CT in women attending STI clinics has been shown to be similar to that in MSM (up to 15% in women12 ,13 vs 14% in MSM).14 Moreover, >80% of all anorectal infections in MSM and 20% in women attending STI clinics are isolated and, thus, will be missed by urogenital testing alone.15 Prevalence of oropharyngeal CT is lower: 1% in women13 ,16 and 3% in MSM.14 These figures illustrate that extragenital CT could contribute to CT transmission and CT-related morbidity.13 ,16
Here, we aimed to provide a comprehensive description of Dutch CT urogenital and extragenital test practices of the following STI care providers: GPs, an STI clinic, gynaecologists and a population-based chlamydia screening programme (here onwards referred to as ‘chlamydia screening’). We examined data from 16–29 year olds from one defined geographic Dutch region from 2006 to 2010. We assessed the number of CT tests and the proportion of positive tests (here onwards referred to as ‘test positivity’) across providers. Hence, this shows the relative contribution of different providers regarding urogenital and extragenital CT control. We also examined the type of populations served regarding age, sex and SES.
Methods
Study population
We used three data sources to obtain all CT tests from January 2006 to August 2010: STI clinic (n=28 591), chlamydia screening (n=6489) and the medical laboratory serving both GPs and hospital physicians (n=24 902). All data sources covered a nearly complete (>95%) region in the southern part of the Netherlands (Parkstad, eastern South Limburg). From 2006 to 2010, Parkstad had a population of 41 000 16–29 year olds (total population: 280 000; http://www.cbs.nl). STI clinic data were retrieved from our own public health STI clinic medical records. Data from the municipal population register included persons aged 16–29 years who had been tested during chlamydia screening. This programme used systematic population-based internet chlamydia screening with a randomised stepped wedge approach. It consisted of three screening rounds (from 2008 to 2010) among 16–29 year olds in three Dutch regions, including Parkstad. Details of chlamydia screening have been described elsewhere.5 ,17 Eligibility for chlamydia testing in Parkstad was dependent on an individual's chlamydia risk score, calculated using an eight-item questionnaire (assessing age, place of residence, education level, condom use at last intercourse, number of lifetime sex contacts, ethnic background, having a new sexual partner in the last six months and symptoms).18
All data sources provided age, sex and four-digit postal code of the tested person, as well as date, anatomic location and result of the test. Using postal code and age, records were selected of patients aged 16–29 years living in Parkstad. Hospital physicians included 14 different specialties of which gynaecology was predominant (90.9%). In order to reduce heterogeneity between hospital physicians, tests by non-gynaecology medical specialties, that is, 458 urogenital CT tests, were excluded from analyses. This resulted in 22 831 tests for analyses: STI clinic (n=5475), chlamydia screening (n=6427), and GPs and gynaecologists (n=10 929) (figure 1).

Selection procedure for the records analysed per database. GP, general practitioner; STI, sexually transmitted infection.
Dutch SES scores were extracted per postal code area and are based on national data on income, educational level and employment (http://www.scp.nl).19
CT diagnosis
Most specimens tested during chlamydia screening and at the STI clinic were self-collected vaginal swabs and urine. GPs and gynaecologists predominantly used clinician-collected urethral and cervical swabs. Anorectal (mainly self-collected) and oropharyngeal (mainly provider-collected) swabs were used for testing these respective anatomical locations. The STI clinic, GPs and gynaecologists all used strand displacement amplification and PCR for CT testing (Becton Dickinson ProbeTec ET system, Maryland, USA, and from 6-1-2010 Abbott M2000, Illinois, USA). Chlamydia screening used PCR (Roche Cobas Taqman, California, USA). All tests were performed according to the manufacturer’s protocols.
Statistical analyses
First, a descriptive analysis was performed to assess the contribution of each STI care provider regarding the number of tests performed and positives diagnosed.
Second, to assess factors associated with the number of CT tests performed and test positivity, multivariable Poisson and logistic regression analyses were performed, respectively, including provider (GP, STI clinic, gynaecologists and chlamydia screening), age (16–21, 22–24 and 25–29),20 SES (low, middle and high, based on tertiles) and test calendar year (continuous). Denominator data for all subgroups included in Poisson regression analyses were retrieved from Statistics Netherlands (http://www.cbs.nl; age, sex and test year) and the Netherlands Institute for Social Research (http://www.scp.nl; SES).
The multivariable analysis was initially performed including ‘provider’ and potential confounders (age, test year and SES) to test for differences in outcomes between STI care providers. Subsequent analyses to determine associations between the outcomes and age, test year and SES were stratified by STI care provider because of statistically significant interactions between ‘provider’ and the other factors.
All analyses were stratified by sex and anatomic location: urogenital (ie, urine, cervical, vaginal and urethral) and extragenital (ie, anorectal and oropharyngeal). Outcome measures presented are adjusted for age, test year and SES (where appropriate).
Analyses were performed using SPSS V.20 (IBM SPSS Statistics for Windows, IBM Corp., Armonk, New York, USA). A p value <0.05 was considered statistically significant.
Results
In total, 22 831 CT tests were performed, including 1868 (8.2%) positives. Stratified by anatomical location, test numbers (test positivity) were urogenital 22 029 (8.2%), anorectal 556 (10.1%) and oropharyngeal 246 (1.6%). For urogenital CT, 73.9% (n=16 289) of the tests were performed in women, whereas these numbers were 42.4% (n=236) and 30.1% (n=74) for anorectal and oropharyngeal tests, respectively.
The urogenital CT test positivity in men was 17.0% (251/1478) at the GP, 11.0% (235/2134) at the STI clinic and 3.7% (79/2128) in chlamydia screening. In women, these numbers were GP 10.2% (499/4871), STI clinic 13.4% (341/2552), gynaecology 4.3% (197/4567) and chlamydia screening 4.8% (206/4299).
Contribution of different STI care providers
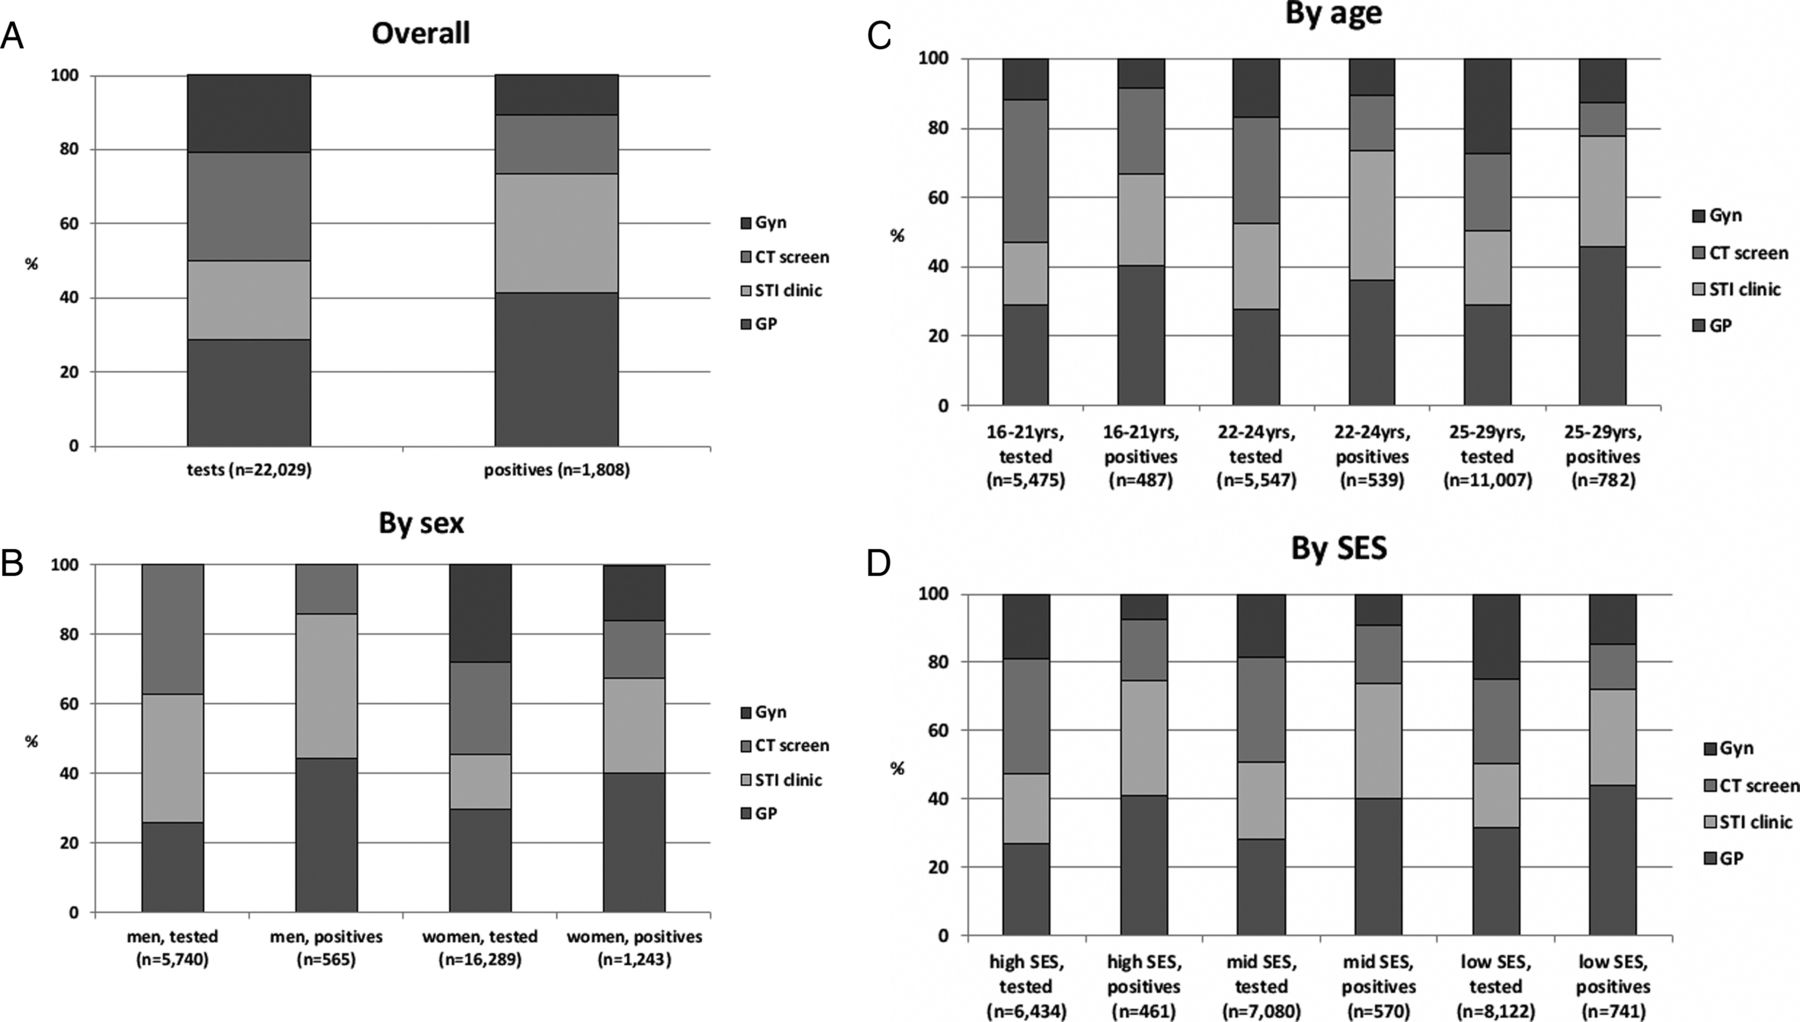
Overall, GPs and chlamydia screening each accounted for 29% of all urogenital tests, whereas the STI clinic and gynaecologists each accounted for 21% (figure 2A). The STI clinic and chlamydia screening tested the largest proportion of men (both 37%), whereas GPs tested the largest proportion of women (30%, figure 2B).

Contribution of the sexually transmitted infection (STI) care providers in terms of number of urogenital Chlamydia trachomatis tests and positives, overall (A), by sex (B), by age (C) and by socio-economic status (SES) (D). CT screen, chlamydia screening programme; GP, general practitioner.
Overall, 73.3% (1326/1808) of the urogenital CT positives were observed in GP (n=750) and STI clinic (n=576) patients. In men, GPs accounted for a small proportion of all tests, but these resulted in almost half of all positives.
Evaluation of testing and test positivity between STI care providers
After adjusting for age, test year and SES, chlamydia screening performed most tests, irrespective of sex (table 1). However, these tests yielded the lowest test positivity in men and women (the latter together with gynaecology, table 2). Although the STI clinic performed more tests in men than GPs, test positivity was lower in the former. In contrast, fewer tests were performed in women at the STI clinic as compared with the GP, but test positivity was higher in the former.
Description of the effects of setting, age, time and socio-economic status on the number of Chlamydia trachomatis tests†
Description of the effects of setting, age, time and socio-economic status on Chlamydia trachomatis test positivity†
Additional factors associated with testing and test positivity
CT tests increased over time for both sexes at the STI clinic (table 1). More urogenital CT tests were performed in 22–29 than in 16–21 year olds across all providers, irrespective of sex. GPs and gynaecologists performed more tests among individuals with lower SES.
In both sexes, GP test positivity decreased over time (table 2). In contrast, STI clinic test positivity increased in men. In women, younger age was associated with higher test positivity. Lower SES was associated with higher test positivity in women at the GP and gynaecologist.
Extragenital CT test practice
GPs performed no anorectal and three oropharyngeal tests (one in a man and two in women), and gynaecologists performed four anorectal and six oropharyngeal tests.
Within the STI clinic, 14.4% (789/5475) of all CT tests were extragenital tests. Of these, 62.2% were performed in men. Most extragenital tests were anorectal tests (65.2% in men and 77.9% in women).
In the STI clinic, anorectal CT test numbers increased over time for both men (OR 1.45, 95% CI 1.31 to 1.60) and women (OR 1.34, 95% CI 1.20 to 1.50). This increase over time was more pronounced in men (OR 1.29, 95% CI 1.01 to 1.65). Furthermore, more anorectal tests were performed among men or women aged 25–29 than among 16-year-old to 21-year-old men (OR 2.78, 95% CI 1.76 to 4.41) or women (OR 4.86, 95% CI 2.99 to 7.89), respectively. More anorectal tests were performed among men with lower versus higher SES (OR 1.55, 95% CI 1.04 to 2.32).
Of all extragenital tests, 7.5% were positive, that is, 56 anorectal and 4 oropharyngeal. In 55.0% (33/60) of the extragenital CT infections, no urogenital CT was diagnosed concurrently. None of the extragenital CT tests performed outside the STI clinic were positive.
The STI clinic test positivity in men was anorectal 10.0% (n=32) and oropharyngeal 2.3% (n=4). In women, these numbers were anorectal 10.3% (n=24) and oropharyngeal 0%.
For women, anorectal CT test positivity was lower in 25–29 than in 16–21 year olds (OR 0.23, 95% CI 0.07 to 0.76). No associations were found between anorectal CT positivity and sex, test year or SES.
Discussion
We examined laboratory surveillance CT test practice data of 16–29 year olds from regular STI care providers, that is, GPs, an STI clinic, gynaecologists and chlamydia screening, covering one particular geographic region. GPs and the STI clinic together performed half of all urogenital CT tests, while accounting for ∼75% of CT positives. Gynaecologists performed over a quarter of all tests in women. Characteristics of tested populations were similar between STI care providers regarding age, but differed regarding sex and SES. Moreover, extragenital CT testing was rarely performed by GPs and gynaecologists, although such testing revealed substantial positivity at the STI clinic in both sexes.
Here, we used a comprehensive data set revealing CT test practice of both regular STI care providers and chlamydia screening, all serving residents of one geographic region. Moreover, the data included information about the anatomical testing site, enabling the evaluation of both urogenital and extragenital CT test practice.
More detailed information regarding the characteristics (eg, sexual orientation) of the individuals tested was unknown, thus we could not compare CT test practice between, for example, heterosexual men and MSM. The proportion of MSM among all men tested in general practice is unknown, which could be evaluated in future studies.
Although the sampling methods between chlamydia screening and the STI clinic (mainly patient-collected), and GPs and gynaecologists (mainly clinician-collected) differed, this probably had negligible impact on test positivity as both methods provide similar, valid results.21 However, the sampling method, that is, patient-collected or clinician-collected, could have influenced the patients’ threshold to seek testing and, thus, on test numbers between STI care providers.21
High laboratory standards and the improbability that a patient is being tested at the same time at different laboratories make double counting of data unlikely.
Finally, we could not correct for intraclass correlation to account for potential clustering within a specific STI care provider in our analyses because the actual STI care provider who performed the test was unknown.
Our findings in men provide a contrast to a previous Dutch study,7 who reported that GPs were responsible for 70% of CT diagnoses when evaluating GP and STI clinic CT test practice, whereas we observed a more equal distribution between these STI care providers. STI clinics target STI risk groups, such as individuals aged below 25, and are therefore more relevant to our 16-year-old to 29-year-old population as compared to the previous study, where all age groups were included.11 More importantly, GP data in this previous Dutch study were based on International Classification of Primary Care codes, with no specific CT code(s), leading to less precise estimates than those made with our laboratory-confirmed data. Moreover, the present study demonstrates substantial differences regarding sex and that gynaecologists contribute significantly to CT test practice in women, alongside GPs and STI clinics.
GP and STI clinic urogenital CT test positivities were >10% for both sexes, whereas test positivities of <5% were found in both chlamydia screening and gynaecology. GPs and STI clinics test predominantly high-risk groups and patients with symptoms,22 whereas population-based screenings target a more general population, and gynaecologists mainly want to rule out CT in their clinical evaluations.
For GPs, test positivity decreased over time, while test numbers remained unchanged. A growing tendency for high-risk populations to visit an STI clinic rather than their GP could explain this trend, as reflected by an increase in test positivity in the former. However, we are only able to speculate about this, and future studies should explore this further and address the reason given for CT testing.
The majority (70%) of CT tests was performed in women, similar to the study by Dimech et al,9 who evaluated CT surveillance data from 15 Australian laboratories between 2008 and 2010. A positive association between age and number of tests was shown across all STI care providers, irrespective of sex. In women, younger age was associated with higher test positivity. Similar associations were shown by Dimech et al and other studies.23 ,24 As argued in these papers, it appears difficult to reach at-risk women below 20 for testing; possible reasons are that they do not feel at risk, be unaware of the possible implications of CT on reproductive morbidity, are more likely to refuse testing or are less likely to consult their GP. This might explain why STI care providers test this high-risk group less than their somewhat older counterparts (20–29 years old) who have lower (yet still substantial) CT prevalence.
Although SES has been associated with CT test practice,10 we observed that SES was only associated with GP and gynaecologist CT test practice . The fact that only patients with a ‘high-risk profile’ are seen at the STI clinic and selected for chlamydia screening in Parkstad could have weakened the association between SES and CT test practice.
Regarding extragenital test practice, prevalence of anorectal CT was considerable (10% in both sexes attending the STI clinic), while oropharyngeal prevalence was much lower (0–3%). Fifty-five per cent of extragenital CT infections would have been missed if only urogenital testing had been performed. Moreover, a similar amount would be missed if extragenital testing would be based on sexual history.13 ,15 ,16 The fact that a substantial proportion of anorectal single infections are found in MSM supports the recommendation that MSM need to be tested at multiple anatomical locations, irrespective of sexual history.15 With the debate surrounding the effectiveness of azithromycin for extragenital CT is ongoing, such recommendation may also be applicable to women, yet more data on anorectal CT treatment effectiveness are needed.
Although extragenital CT testing was predominantly performed at the STI clinic here, extragenital testing in this setting should nevertheless be further explored as testing practices can differ considerably between STI clinics.14 ,25
Extragenital CT can be detected successfully using nucleic acid amplification tests on simple to obtain self-taken samples and both men and women are willing to test.21 Strategies to increase the reach of these self-taken samples, and thereby lower barriers to accessing STI care for both patients and providers,26 ,27 include the use of internet-based programmes, e-health strategies and home-collection.28 ,29
In conclusion, gynaecologists perform a substantial proportion of CT testing in women, although GPs and STI clinics are mainly responsible for CT diagnosis. For all STI care providers, age was associated with increased testing, but lower test positivity. Extragenital CT testing in MSM and possibly high-risk women needs to be encouraged, especially among STI care providers outside the STI clinic, because almost no extragenital tests were performed by GPs and gynaecologists in our sample.
A full picture of CT test practice in one particular region can highlight differences between STI care providers and the populations they test. Moreover, it may alert STI care providers which (sub)groups they need to test more often and give these providers knowledge on where to find certain expertise, such as on extragenital testing. Ideally, it would enhance integrating the services between STI care providers in the region. Thereby, evaluations such as provided here can help optimise CT test practice and could improve the cooperation between STI care providers, which is already in place in several countries (eg, between GUM clinics and GPs in the UK).30
Key messages
In Dutch 16-year-old to 29-year-old men and women, three-quarters of Chlamydia trachomatis infections are diagnosed by general practitioners (GPs) and sexually transmitted infection (STI) clinics.
Gynaecologists order as many chlamydia tests as STI clinics do, yet the proportion of test-positives (in women) tested by the former is much lower.
Characteristics of the tested populations differ between STI care providers regarding sex and socio-economic status, but are similar for age.
Extragenital chlamydia testing is rarely performed by GPs and gynaecologists.
Acknowledgments
The authors thank the staff of the STI Clinic South Limburg, the Department of Medical Microbiology, Atrium Medical Centre Parkstad and the Dutch Chlamydia Screening Implementation (CSI) project group, especially IVF van den Broek, EEHG Brouwers, JSA Fennema, RH Koekenbier, ELM Op de Coul, LL Pars and SM van Ravesteijn, for their valuable contribution to the CSI data collection. Moreover, the authors want to thank Jane Banfield for critically reviewing and editing the English language in this paper.
References
Supplementary materials
Abstract in Dutch
This web only file has been produced by the BMJ Publishing Group from an electronic file supplied by the author(s) and has not been edited for content.
- Abstract in Dutch - Online abstract
Footnotes
Handling editor Jackie A Cassell
Contributors NHTMD-M and CJPAH designed the study, interpreted results and supervised the study. GAFSvL retrieved the data. CDJdH wrote the article, analysed and interpreted the data. All authors commented on the final manuscript. All authors read and approved the final manuscript.
Competing interests None declared.
Ethical approval The medical ethics committee of Maastricht University Medical Centre (MUMC) approved the study (identification number 12-4-042). The chlamydia screening programme was approved by the Medical Ethics Committee of the VU University Amsterdam (identification number 2007/239).
Provenance and peer review Not commissioned; externally peer reviewed.