Article Text

Abstract
Process models offer opportunities to explore the effectiveness of different programme and policy alternatives by varying input behaviours and model parameters to reflect programmatic/policy effects. The Asian Epidemic Model (AEM) has been designed to reflect the primary groups and transmission modes driving HIV transmission in Asia. The user adjusts AEM fitting parameters until HIV prevalence outputs from the model agree with observed epidemiological trends. The AEM resultant projections are closely tied to the epidemiological and behavioural data in the country. In Thailand and Cambodia they have shown good agreement with observed epidemiological trends in surveillance populations and with changes in HIV transmission modes, AIDS cases, male:female ratios over time, and other external validation checks. By varying the input behaviours and STI trends, one can examine the impact of different prevention efforts on the future course of the epidemic. In conclusion, the AEM is a semi-empirical model, which has worked well in Asian settings. It provides a useful tool for policy and programme analysis in Asian countries.
- AEM, Asian Epidemic Model
- IDUs, injecting drug users
- MSM, men who have sex with men
- HIV/AIDS
- modelling
- public policy
- programme planning
- Asia
Statistics from Altmetric.com
In contrast to the curve fitting approaches used in the UNAIDS workbooks1 and the Estimation and Projection Package (EPP),2 the Asian Epidemic Model (AEM) is a full process model that mathematically replicates the key processes driving HIV transmission in Asia. As a result it has more extensive epidemiological and behavioural input requirements but offers the ability, which these other packages cannot, to examine future scenarios in which prevention and care efforts induce behaviour change. This paper will describe the AEM, explain its use, and discuss actual applications.
In 1998, Chin et al proposed that three major factors determined the spread of HIV in Asia: the general pattern of heterosexual risk behaviours, the percentage of men visiting sex workers, and the partner exchange rates of female sex workers.3 With support from the United States Agency for International Development, the AEM was developed to test this hypothesis by implementing a process model focused primarily on the most important transmission routes for HIV in Asia—sex work, marital sex, and injecting drug use—and then testing it against actual epidemiological trends in Asian countries.4 The goal was to develop a model of sufficient complexity to capture the essential dynamics of Asian epidemics, while keeping it simple enough that behavioural and epidemiological inputs could be obtained from existing data sources.
Two key design decisions were made. Firstly, the model would be semi-empirical, not theoretical in nature. It would be patterned after the dominant transmission modes in Asia with appropriate behavioural inputs. However, values for parameters such as HIV transmission probabilities and cofactors would be set on a country specific basis by comparing HIV trends generated by the model directly against observed epidemiological trends, rather than by assuming the parameters to have specific values a priori. Furthermore, important cofactors for HIV, for example trends in other STIs, would be entered empirically as data, rather than calculated from behavioural and transmission parameters. Secondly, it was decided that all behavioural inputs could be specified on an annual basis, rather than specifying constants or starting and ending values. This was essential because the two initial countries in which the model was applied, Thailand and Cambodia, have both seen substantial changes in behaviour over short time frames in response to national programmes.4,5 The result is a semi-empirical model that is closely tied to real world epidemiological and behavioural data that should normally be collected during national response planning, monitoring, and evaluation.
THE AEM INTERNAL MODEL
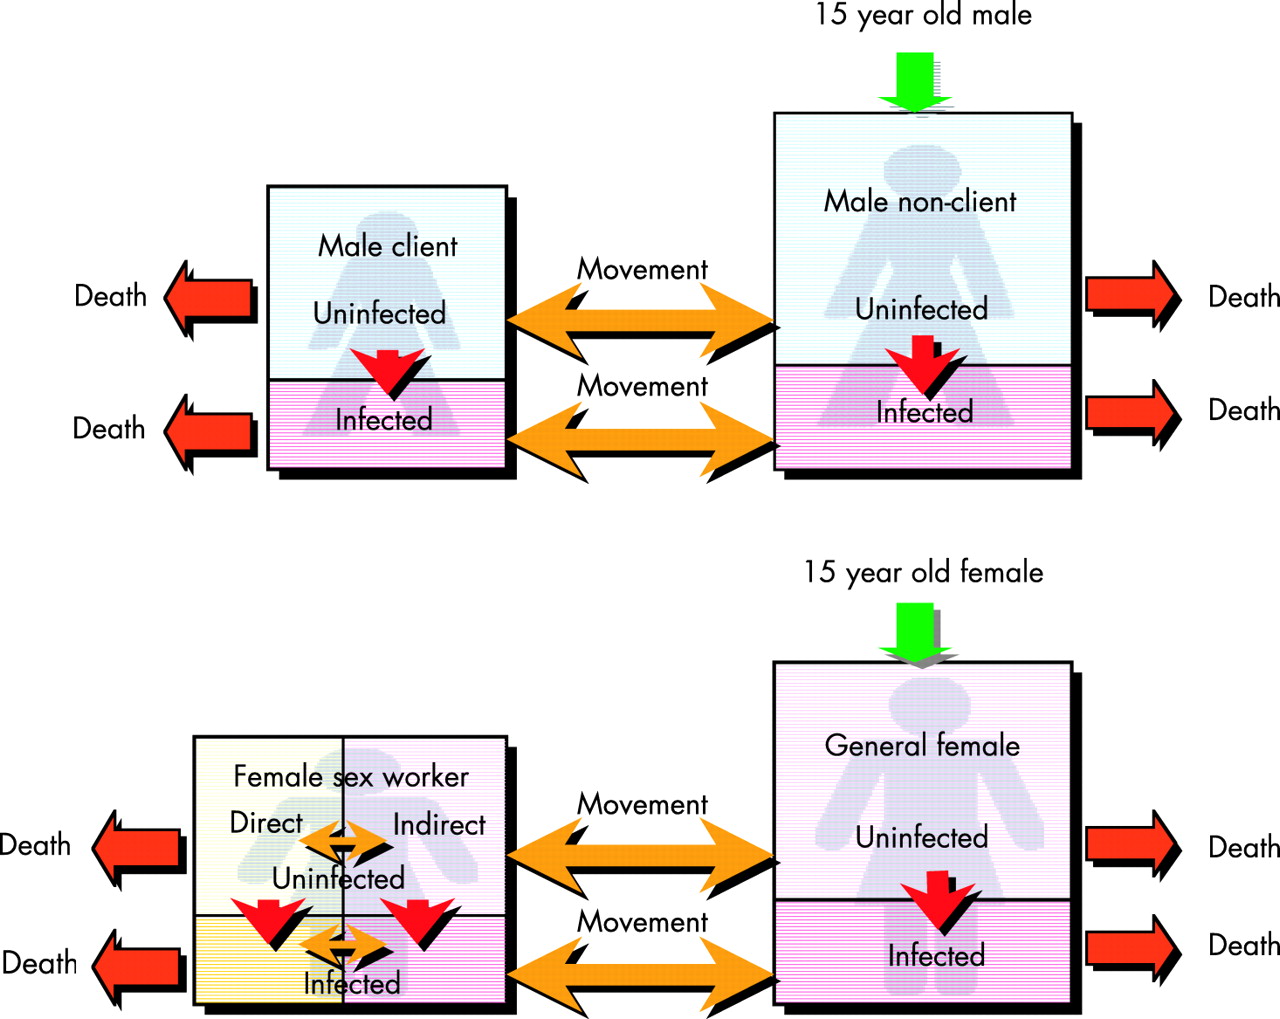
The AEM considers HIV transmission within a population aged ⩾15 years. People enter the population at age 15 and depart by either AIDS related or non-AIDS related (background mortality) deaths. Paediatric impacts are then calculated after the fact based on fertility data and female infection levels. The population is divided into eight compartments, chosen specifically for their relevance to Asian epidemics:
-
males who are clients of sex workers
-
males who are not clients of sex workers
-
lower risk general population females
-
direct female sex workers (those with a higher frequency of partnering)
-
indirect female sex workers (those with a lower frequency of partnering)
-
injecting drug users (IDUs) in higher risk sharing networks
-
IDUs who are in lower risk networks or do not share
-
male sex workers
-
Men who have sex with men (MSM), who are not sex workers.
Each compartment is divided into those infected with HIV and those not infected. Movement is allowed between compartments because, in the real world, people do not remain in one category until death. For example, female sex workers normally work for a period, anywhere from 2–10 years on average, and then return to the lower risk female population. This movement cannot be ignored because infections acquired during past sex work may have a substantial effect on prevalence in the lower risk female population. The rate at which movements occur is determined by the average duration of sex work, which is one of the behavioural inputs. The basic structure of the heterosexual transmission component of the model is shown in fig 1.

The basic structure of the heterosexual component of the Asian Epidemic Model.
Movement between or out of compartments may also occur due to deaths or infection with HIV. For example, fig 2 shows the possible movements of uninfected male clients between compartments in the model. They may move into one of the other uninfected male compartments, may die of non-AIDS related causes, or may become infected either from sex workers or from other lower risk female partners. In the latter case they move into the infected male client compartment.

Movement of those in the uninfected male client compartment to other compartments. IDU, injecting drug user; MSW, man who has sex with woman; MSM, man who has sex with man.
Infection occurs either through sexual behaviour or needle sharing with an infected partner, which has some probability of transmission per contact, a value set on a country specific basis as described below. The number of new infections, that is movement from the uninfected to the infected compartment, is calculated based on the prevalence in the partner population, the frequency of sex or injecting acts, and the probability of transmission of HIV. Corrections are made for increased HIV transmission in the presence of other STIs or due to lack of male circumcision by adding cofactors that increase the effective transmission probability by a fixed amount. These cofactors are also chosen on a country specific basis. Finally, a correction is made for protective behaviours such as using condoms. For example, the number of male clients infected by direct sex workers in a year would be calculated as:
number of new infections in male clients from direct sex workers = probability of female to male transmission per contact × number of client contacts per year with direct sex workers × fraction that are not protected by condoms × per cent of sex workers infected × corrections for other STIs and for circumcision
Similar terms are included for each key transmission mode in the model.
The AEM has much more stringent input requirements than either the UNAIDS workbooks or EPP.1,2 The inputs fall into a number of general categories and are primarily behavioural in nature:
-
The sizes of key populations—total male and female population, male clients, direct and indirect female sex workers, IDUs, and MSM
-
Sexual risk behaviours—frequency of sexual contact between different partner types and levels of condom use with different partners
-
Injecting risk behaviours—frequency of injection and levels of sharing
-
Average duration in different key populations—for example, average time in sex work and average time as a client.
To calculate the number of new infections one additional set of inputs is needed:
-
Levels of STIs—by type of partner, for example among sex workers and general population couples.
This is used in conjunction with STI cofactors to calculate increases in HIV transmission due to other STIs. The user must also enter HIV surveillance data for the key populations, but these are used to adjust the transmission parameters in the model, not for the calculation of new infections. All inputs, both behavioural and epidemiological, can be entered for each year to reflect changing behaviour. For example, in Thailand the proportion of male clients dropped from 22% of adult males in 1990 to 10% in 1993 and stabilised at this level.6–8
SUMMARY DESCRIPTION OF THE SOFTWARE
The software has been structured to assist the user in the three key steps of preparing an AEM projection:
-
collating the various forms of input data together
-
adjusting the transmission probabilities and cofactors to obtain a fit
-
generating useful outputs for policy and programming.
On the inputs screen, see fig 3a, the user enters the values for the various population sizes, behavioural inputs, and epidemiological inputs. By selecting a particular input item in the tree on the left, the user can enter the corresponding values in the spreadsheet and view the results in graphical form. The fig shows the inputting of the total adult male population size with a graph of the input values over time displayed on the right. The user can also export all inputs and outputs directly to a Microsoft Excel spreadsheet, edit them there, and then re-import them into the AEM.

A The inputs screen of the AEM. B The outputs screen of the AEM.
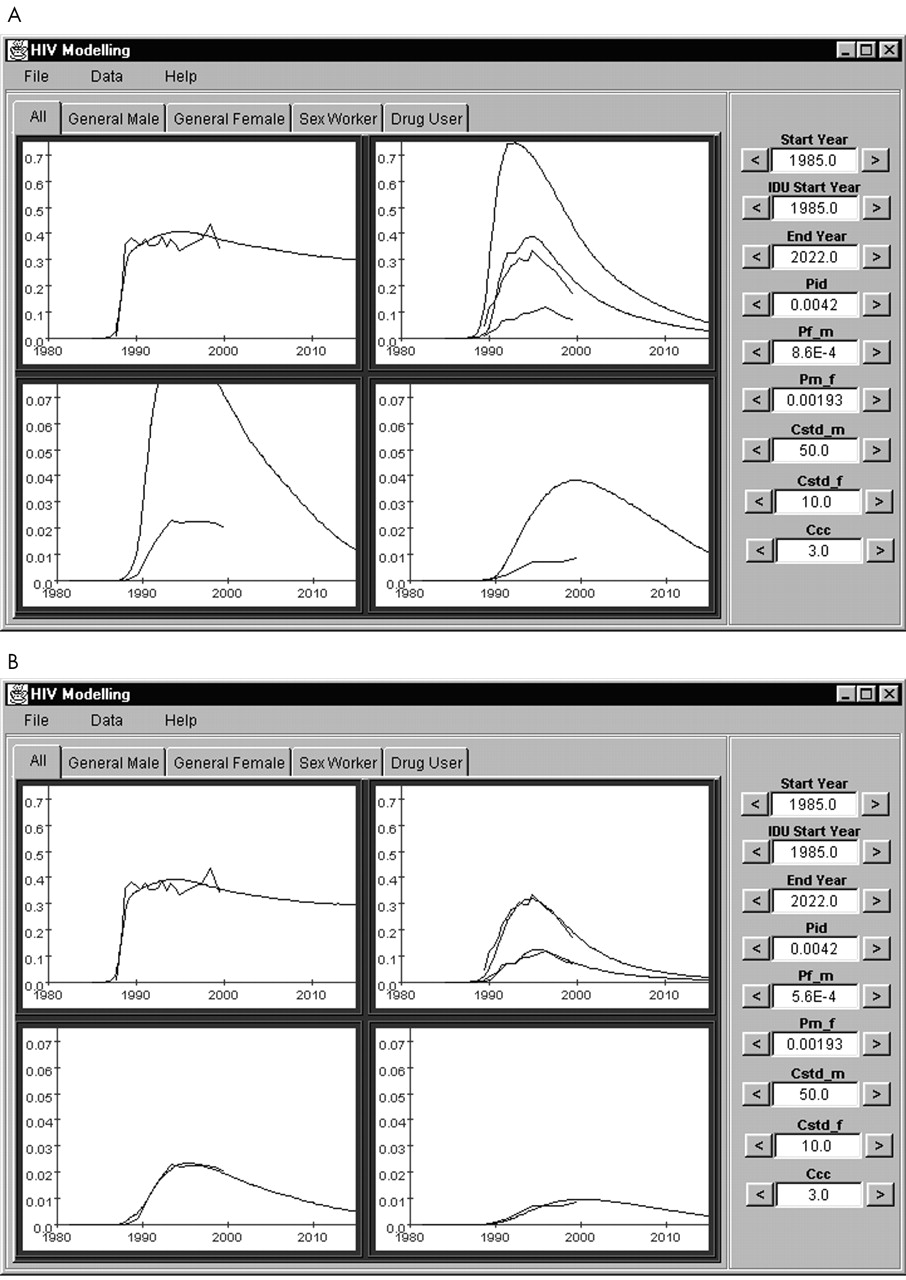
The heart of the AEM is the parameter fitting screen, shown in fig 4. The graphs show four key populations: IDUs, female sex workers, general population males, and general population females. The jagged lines in the graphs are the observed HIV prevalence entered by the user from actual surveillance data during the process of defining inputs. The smooth curves show the results of AEM calculations of HIV prevalence based on the parameters on the right hand side of the screen and the behavioural inputs provided earlier by the user. These user adjustable parameters include: start years of sexual and IDU epidemics, probability of transmission per injection with an infected needle, probabilities of transmission per sexual contact from male to female and from female to male, and cofactors for STIs among males and females and for circumcision.

Example of the AEM parameter fitting screen in use. The jagged lines represent the actual measured HIV prevalence in each population, the smooth lines are the prevalence calculated by the AEM from behavioural inputs. A shows effects of setting too high a male to female transmission probability—all of the curves, except for injecting drug users are too high. B shows the final best fit obtained for the Thai epidemic, correctly reproducing trends in all key populations.
When the user changes a parameter, the AEM recalculates the epidemic and adjusts the smooth lines shown in fig 4. For example, fig 4A shows the effect of setting the female to male transmission probability to 0.00086. This produces far too many infections (a much more severe epidemic: the smooth curves produced by the model are much higher than the surveillance data). When this value is reduced to 0.00056, the value used in the best fit for Thailand shown in fig 4B, the model curves and the surveillance lines are in good agreement for all populations. Similar effects can be seen if the start years or the cofactors are altered. The user can keep adjusting these parameters until he/she obtains a satisfactory fit or an automatic fitting routine can be used to fit the parameters within user supplied upper and lower boundaries.
Some might expect that the same transmission probabilities and cofactors would be used for all countries; however, this is not necessarily the case. The mix of types of STIs may vary substantially from country to country, requiring different STI cofactors.9,10 The HIV subtypes, the structure of sexual networks, the levels of vaginal trauma in sex work, and other factors may influence per contact probabilities of HIV transmission. As a result, these parameters are set on a country specific basis based upon fitting local epidemiological data.
On the outputs screen (see fig 3B) the user can explore any of the model’s outputs, including HIV prevalence, new and cumulative HIV infections, AIDS cases, and deaths. Any of these variables may be extracted for the population as a whole, by age, or by at-risk population. An output window (not shown) allows the user to view age distributions of HIV, AIDS, and deaths, as well as new infections by mode of transmission over time. This gives the user the ability to explore how HIV transmission has shifted from one group to another over time—a critical element in using it to evaluate past, present, and future programme directions.
The updated version software and documentation will be made available on the East-West Center (http://www.EastWestCenter.org) and UNAIDS (http://www.unaids.org) websites in the third quarter of 2004.
EXAMPLES OF THE APPLICATION OF THE AEM—THAI NATIONAL PROJECTIONS—AND THE EFFECTS OF IDU EPIDEMICS
To date the AEM has been applied to the modelling of national epidemics in Thailand and Cambodia. Full reports on these applications of the AEM can be obtained from the Thai Ministry of Public Health or Family Health International Cambodia, or from the corresponding author.7,11 As can be seen in fig 4B, the Thai AEM fit is quite close to the actual HIV surveillance values measured in the country. Male and female general population surveillance values are based upon adjustments to HIV surveillance data in military conscripts and antenatal clinic women. Using behavioural inputs gathered from Thai national behavioural surveys over the period 1990 to 2000, the AEM projection reasonably reproduces 10 years’ of seroprevalence trends in all the populations measured using parameter values in agreement with those in the literature. The agreement between modelled and observed HIV prevalence values in Cambodia is comparable to that seen in Thailand.12
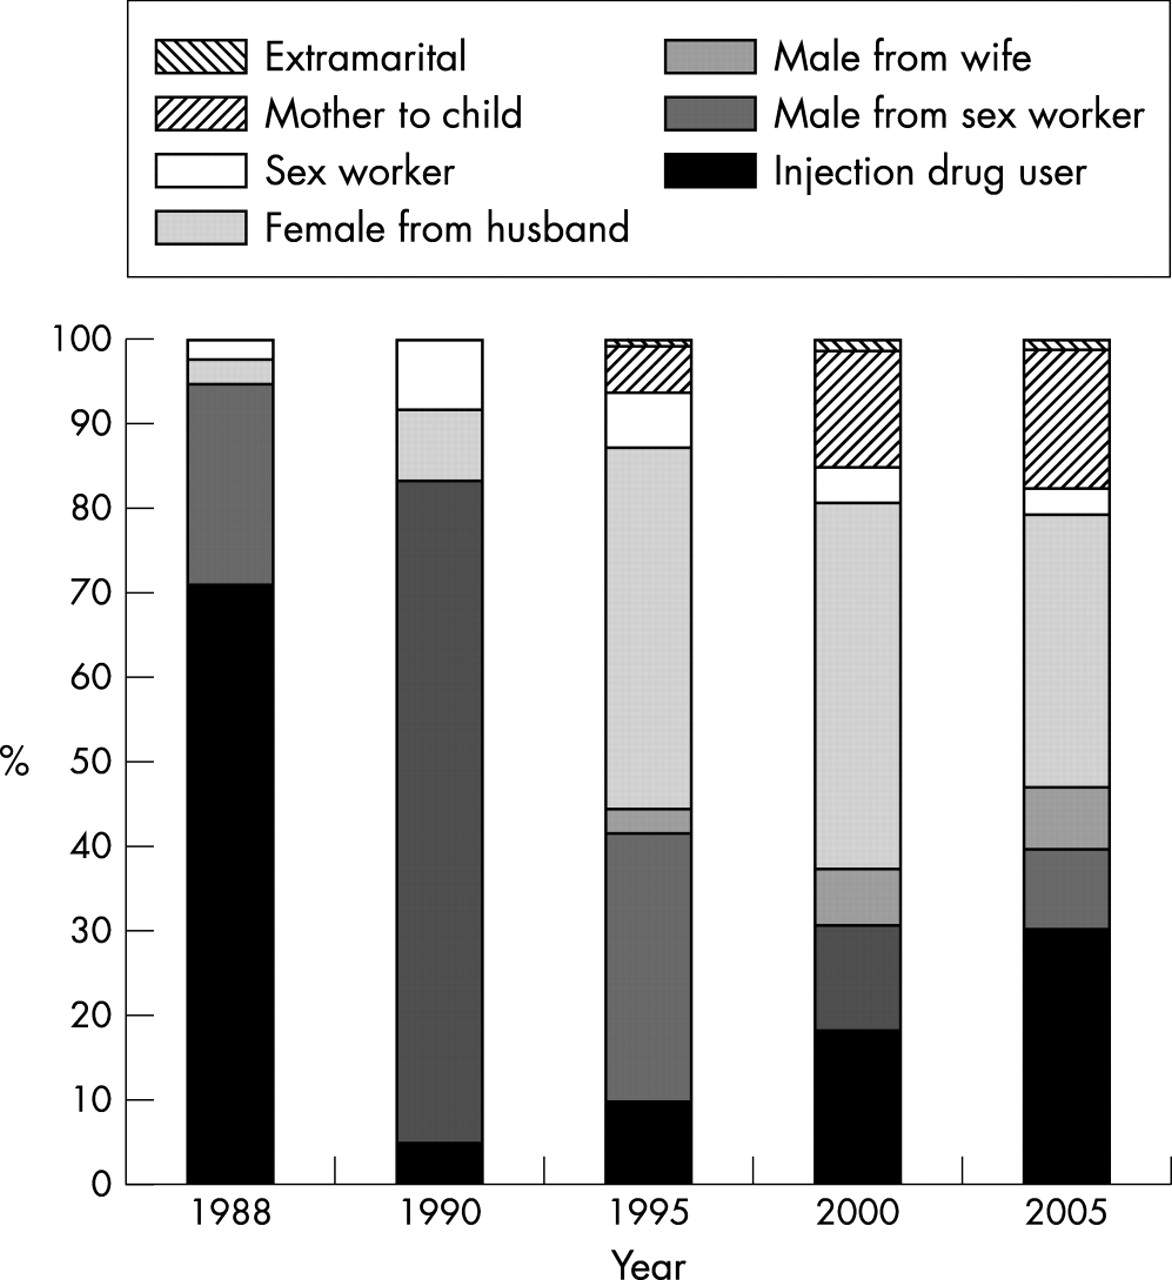
Another advantage of the AEM (and other process models) is that it allows the user to examine changes in the dominant modes of transmission over time. Fig 5 shows how the source of new infections in the Thai epidemic has changed, going from a predominance of new infections among IDUs in the mid-1980s, to sex workers and clients in the early 1990s, and to married couples and IDUs in the early 2000s. This clearly shows the need to adapt the national prevention response over time. Another major advantage of process models with behavioural inputs is that they allow one to examine “what if?” or alternative future scenarios. Fig 6 shows how the Thai epidemic might resurge should condom use between sex workers and clients fall from 85% to 60% in 1998. This drives home the importance of sustaining the hard won successes in condom promotion among clients and sex workers.

The changes in routes of transmission of new HIV infections in Thailand over time as calculated by the Asian Epidemic Model. Source: Thai Working Group on HIV/AIDS Projection.8

A hypothetical scenario for Thailand in which condom use between clients and sex workers drops from 85% to 60% starting in 1998, leading to a resurgent epidemic. Source: Thai Working Group on HIV/AIDS Projection.8
STRENGTHS
Because the AEM is patterned after the dominant modes of HIV transmission in Asian settings and uses semi-empirical fits to actual country data, the resulting projections are likely to reflect the actual HIV transmission patterns in the country. The large variety of outputs available, including transmission routes, male to female ratios, AIDS cases, and HIV trends allow numerous opportunities for external validation of the projections produced against other sources of data. If the projections stand up well against such validity checks, as they have in Thailand and Cambodia, it gives some confidence that the model itself reflects local reality. Programme and policy analyses done with a well-validated model are more likely to be both accurate and relevant to the local conditions.
The ability to extract a more complete picture of what is driving the epidemic, coupled with the ability to explore alternative scenarios, based upon achievable levels of behaviour change, are two other major strengths of the AEM. The ability to change behaviours on a yearly basis allows the user to explore both what might have been, allowing retrospective evaluation of earlier programme impacts; and what might be, permitting relative efficacy of different programme alternatives to be explored.
The use of both behavioural and epidemiological inputs encourages users to undertake an integrated analysis of epidemiological and behavioural data, as recommended in the UNAIDS/WHO second generation guidelines.12 It also helps in identifying gaps in national and local data collection systems. Almost all data inputs for the AEM have other uses in programme planning and evaluation, and if they are currently unavailable it will be difficult to evaluate coverage, effectiveness, or impact of programmes. Thus, as monitoring and evaluation systems are strengthened over the next several years, it can be expected that more and more countries, provinces, and major cities will be able to apply the AEM.
LIMITATIONS
Although the AEM provides a dynamic and realistic picture of an epidemic, the more complex set of inputs compared with the UNAIDS workbooks or EPP also limits the number of places in which the AEM can currently be applied. Most countries at present lack sufficient data to apply the model, although, as data collection systems strengthen in the near future, this will change. In low prevalence countries, the AEM cannot be applied at all, as there is no basis on which to set the parameters.
Caution must also be exercised because the AEM internal model may not be fully appropriate in all settings. For example, if a major mode of transmission is not included, such as sex workers who inject as observed in some cities in Vietnam, the resulting projections may be wrong. Thus, users must understand what is driving their local epidemic and make certain that the key local modes of transmission are already included in the AEM. If not, modifications to the AEM may be required before use.
Finally, models are only as good as their inputs. This is especially true for process models, which are more complex than the other tools described in this volume. So, unless the user takes great caution in evaluating the quality and validity of epidemiological and behavioural inputs to the AEM, a “garbage in—garbage out” situation will ensue.
FUTURE DIRECTIONS FOR THE AEM
Several future directions are anticipated for the AEM. With the support of the World Health Organization (WHO) and the World Bank, work is currently underway to incorporate the impacts of antiretrovirals on HIV prevalence, including the impacts of behavioural backlash. In the future more attention will be paid to expanding automatic input and output validity checks along with review of the user selected parameters for fitting. A sensitivity analysis module is planned, which will allow users to better assess the impact of specific changes and to determine what changes will have the greatest impact on downstream infections. And further work will be undertaken to improve the fitting algorithms in the AEM package.
CONCLUSIONS
The AEM provides a valuable policy and planning tool for Asian countries, provinces, or cities that have sufficient epidemiological and behavioural data to apply it. The process of developing an AEM projection encourages close, integrated analysis of epidemiological and behavioural data and will also help identify and fill in gaps in the data required for planning and evaluating HIV programmes. Once a baseline fit has been developed, it can be easily modified to explore alternative future behavioural patterns and provide important feedback on the relative impact of alternative prevention and care scenarios. As such, the AEM is a valuable complement to the UNAIDS workbooks and EPP for the countries of Asia.
Acknowledgments
The initial development of the AEM was funded by the United States Agency for International Development under a grant to the East-West Center. Support for its application in Thailand and Cambodia was provided by UNAIDS, the Thai Ministry of Public Health, and Family Health International with support from USAID. WHO and the World Bank are supporting the incorporation of antiretrovirals. The authors wish to acknowledge the hard work of our collaborators on this project, including Drs Ofelia Saniel and Maridel Borja of the University of the Philippines and Drs Varachai Thongthai and Pimonpan Isarabhakdi of Mahidol University. We also wish to thank the members of the Thai Working Group on HIV/AIDS Projection and the Cambodian Working Group on HIV/AIDS Projection, who oversaw the application of the AEM in their respective countries. Finally, we wish to thank our colleagues at FHI, especially Dr Tobi Saidel, for their continuing support of the application of the AEM in different settings.