Article Text

Abstract
Objectives: To establish the accuracy of the country specific estimates of HIV prevalence, incidence, and AIDS mortality published every 2 years by UNAIDS and WHO.
Methods: We review sources of error in the data used to generate national HIV/AIDS and where possible estimate their statistical properties. We use numerical and approximate analytic methods to estimate the combined impact of these errors on HIV/AIDS estimates. Heuristic rules are then derived to produce plausible bounds about these estimates for countries with different types of epidemic and different qualities of surveillance system.
Results: Although 95% confidence intervals (CIs) can be estimated for some sources of error, the sizes of other sources of error must be based on expert judgment. We therefore produce plausible bounds about HIV/AIDS estimates rather than statistical CIs. The magnitude of these bounds depends on the stage of the epidemic and the quality and coverage of the sentinel HIV surveillance system. The bounds for adult estimates are narrower than those for children, and those for prevalence are narrower than those for new infections.
Conclusions: This paper presents a first attempt at a rigorous description of the errors associated with estimation of global statistics of an infectious disease. The proposed methods work well in countries with generalised epidemics (>1% adult HIV prevalence) where the quality of surveillance is good. Although methods have also been derived for countries with low level or concentrated epidemics, more data on the biases in the estimation process are required.
- ANC, antenatal clinic
- ART, antiretroviral therapy
- MTCT, mother to child transmission
- HIV
- AIDS
- sentinel surveillance
- estimation
Statistics from Altmetric.com
UNAIDS and the World Health Organization (WHO) have produced country specific estimates of HIV/AIDS and its impact every 2 years since 1998.1–4 These estimates have been useful in developing awareness of the global extent of HIV/AIDS and have been a motivation for increased focus and spending in combating the HIV/AIDS epidemic. At the same time, the estimates of HIV prevalence and AIDS deaths have come under increasing scrutiny, and have been criticised as too high, too low, or simply the result of political expediency. While some of the criticism is justified and some misguided, much of the problem has stemmed from a misunderstanding of the estimates: how they are made, how precise they are, and why they change over time. Other papers in this supplement focus on the methods and assumptions used to make estimates of HIV/AIDS. This paper focuses on describing the uncertainty around the estimates of HIV/AIDS and how bounds about the UNAIDS/WHO estimates for the end of 2003 were developed.
In this paper we briefly review the methods and assumptions that UNAIDS and WHO have used to make estimates of HIV/AIDS and the evidence for the error or variance around each step in the estimation process. For each step we estimate the associated statistical error where feasible and then introduce judgements of plausibility based on the generalisability of these statistical errors. We derive methods to combine these various sources of error to produce the plausibility bounds around the estimates of HIV/AIDS. Different methods are used for countries with generalised epidemics where adult HIV prevalence exceeds 1% and for low level and concentrated epidemics where prevalence is lower but can exceed 5% among at-risk groups in the case of the latter. The paper concludes with a discussion of how new data sources can be used to further refine the estimates and future directions in this work.
METHODS AND RESULTS
Two different approaches are used to make estimates of HIV/AIDS depending on the type of epidemic, generalised or low level/concentrated. These approaches are described in detail in other papers in this volume.5–7 We describe error associated with each step and assumption separately for the two approaches.
Adult estimates for generalised epidemics
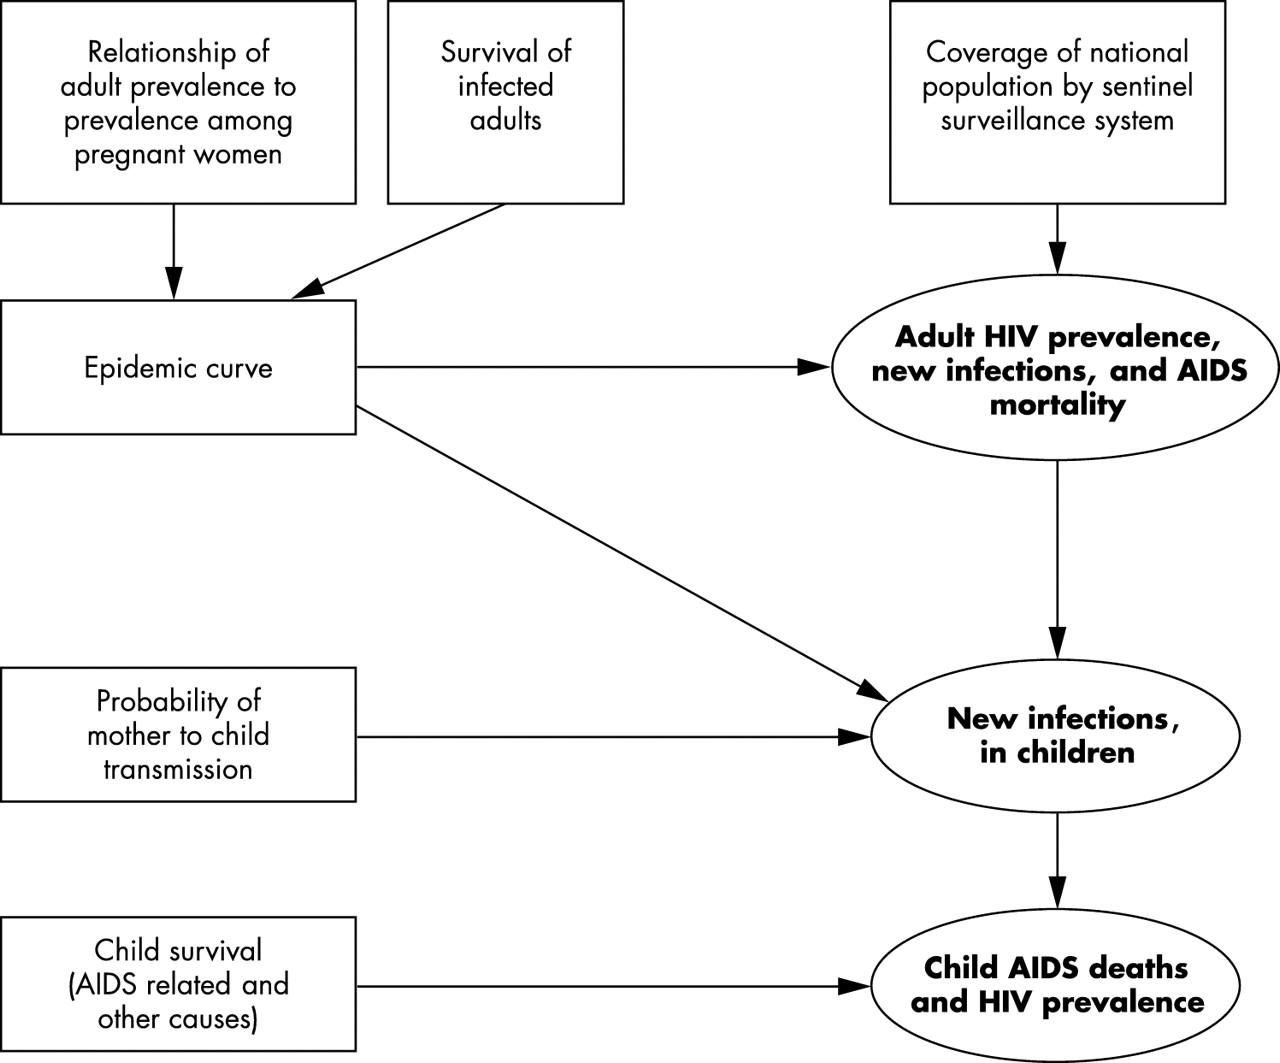
In making a national estimate of adult (15–49 years old) HIV prevalence, new infections, and AIDS mortality there are four primary sources of uncertainty. These are uncertainty in the estimate of:
-
adult (15–49 years old) prevalence from a sample of pregnant women at an antenatal clinic (ANC)
-
survival of infected adults
-
the epidemic curve used to estimate new infections and mortality from prevalence data
-
national prevalence from the typically non-random sample of ANCs (fig 1).

Sources of uncertainty in the steps used to make estimates of HIV/AIDS in countries with generalised epidemics. Boxes represent sources of uncertainty while ellipses represent estimates produced by UNAIDS/WHO. The arrows indicate which estimates are affected by different sources of uncertainty.
Estimates of HIV prevalence, new infections, and AIDS mortality in children (due to mother to child transmission; MTCT) have additional assumptions and sources of error, which are reviewed in later sections.
1) Estimating adult prevalence from pregnant women at ANCs
Estimates of adult (15–49 year old men and women) HIV prevalence from community studies were reviewed and compared with prevalence estimates from ANCs in the same locality at the same time (maximum 1 year difference) (table 1). Only three of the 15 comparisons in eight countries show any significant difference between ANC and community prevalence. Prevalence from the ANC sample overestimated community prevalence in studies in 1997 in Rwanda and Kenya, and underestimated community prevalence in a 1999 study in Zambia. It is possible from these comparisons to explore the statistical attributes of the relationship between ANC and adult population prevalence.
Antenatal clinic (ANC) and community adult HIV prevalence
If pregnant women at ANCs represent a random sample of the local population with respect to HIV prevalence, the number of HIV positive samples X should be binomially distributed with mean ρn, where ρ is the population prevalence and n the sample size. This hypothesis can be tested by comparing the fit of the binomial distribution to the samples described in table 1 with a distribution that allows additional variance and the mean of the ANC sample to differ systematically from the community prevalence. An appropriate distribution is the beta binomial, typically used in Bayesian analysis. In this case the observed number of HIV cases in the sample is drawn from a binomial distribution with a mean θ, which itself is drawn from a beta distribution with a mean that is a function of the community prevalence. In the simplest case the mean of the beta binomial μ = γρ, where γ is the prevalence of the ANC sample relative to community prevalence. Thus, for instance, if prevalence at ANC systematically underestimates prevalence in the community then γ <1. We re-parameterise the beta distribution from beta (a,b) to beta (μ,M), where μ = a/(a+b) the population mean and M = a+b, a measure of extra variance (increasing M decreases the extra variance). We therefore have a two stage compound sampling model:
θ ∼ beta (μ,M)
X|θ ∼ Bin(n,θ)
The beta binomial has the nice property that the expected value of X/n is:
E(X/n) = E[E(X/n|θ)] = E[θ] = μ
and the variance:
V(X/n) = [1+(n-1)/(M+1)] μ(1-μ)/n
where (n-1)/(M+1) represents the extra binomial variance.
The fit of the binomial model to the data in table 1 can be compared to the fit of the beta binomial using the likelihood ratio statistic. We test three hypotheses, namely that prevalence among pregnant women at ANC represents: H0 – a random sample of prevalence in the community (binomial sample); H1 – a random sample of prevalence in the community but with additional variance (beta binomial, M << ∞, γ = 1); and H2 – a biased sample of prevalence in the community (beta binomial, M << ∞, γ≠1). Because these hypotheses are nested within one another, twice the likelihood ratio is approximated by the χ2 distribution with the number of degrees of freedom equal to the difference in the number of parameters.
Compared to hypothesis H1 the null hypothesis H0 of a random binomial sample is rejected (p < 0.001). However, although the ANC sample slightly underestimates community prevalence (ŷ = 0.94), the difference is not significant (p = 0.09). This provides strong empirical support for the assumption made by UNAIDS that prevalence among pregnant women represents a good estimate of adult (men and women combined) prevalence in the local community. However, the variance of the estimate is greater than that expected from a simple random sample (M̂ = 221). For a sample size n = 300, the variance of the sample would be an estimated 2.3 times that expected from a random binomial sample.
2) Adult survival after infection with HIV
Median adult survival without access to antiretroviral treatment or intensive case management with treatment for opportunistic infections was estimated to be 9 years, with a standard deviation of 1 year. This is based on published reviews of cohort studies before the availability of highly active antiretroviral therapy.17,18 The distribution of survival is described by a Weibull distribution with a fixed shape parameter previously estimated.17 The estimate of adult survival is not only important in the estimation of adult AIDS mortality but also determines the shape of the prevalence and incidence curves. Uncertainty in survival was therefore included in estimates of the range of possible epidemic curves.
3) The epidemic curve
HIV prevalence estimates at a given point in time provide information about likely values of prevalence in the following year. Time series of HIV prevalence at ANCs therefore provide more information about HIV prevalence at a given point in time than do estimates based on a single year of reporting. UNAIDS and WHO have developed various approaches to fitting an epidemic trajectory to sampled prevalence data. Currently a simple model of HIV transmission among a susceptible fraction of the adult population is used to fit prevalence data.17 This model is capable of providing a good fit to a range of epidemics with just four parameters including the start date of the epidemic. Estimates of new infections and AIDS mortality are necessarily derived from this model because independent data to estimate these are exceedingly rare.
Data from a given country may be consistent with a range of epidemic curves. Because we have an estimate of the distribution of uncertainty about ANC estimates and survival after infection, it is possible to calculate the likelihood of a given epidemic curve. The likelihood function depends strongly on the assumptions made about whether the distribution of prevalence estimates from ANC surveillance sites in a country is independent. If one surveillance site in a country tends to underestimate community prevalence, other sites may be more likely to do so. This covariance will increase the uncertainty in the estimated epidemic curve over that seen if sites were independent. Covariance of estimates from sites can be modelled by specifying correlation in the mean of the binomial sample (θ) given by the beta prior.
Within the likelihood framework, any curve that is not significantly different from the maximum likelihood is considered to be within the “set of admissible hypotheses”.19 This set of hypotheses is often considered a close approximation of the confidence interval (CI), although they do not represent a CI in the strictest sense, where the type I error rate should equal the significance level, α. However, there is no simple analytic approach to relate uncertainty in the UNAIDS model parameters to uncertainty in prevalence, new infections, and mortality. It is also difficult to numerically find “admissible” curves that give maximum and minimum estimates of prevalence at a given time. We therefore adopt a parametric bootstrap approach to explore the range of curves consistent with the data. Observed prevalence data were re-sampled using the beta binomial distribution with M = 221 (as estimated above), n = 300, and mean equal to the observed value. A median survival time is randomly chosen from the normal distribution with a mean of 9 years and standard deviation of 1 year. The UNAIDS model epidemic curve is then fit using a goodness of fit measure (in this case least squares to match the implementation in the Estimation and Projection Package (EPP) software used by UNAIDS). This is then repeated 1000 times and the distribution of adult prevalence, new infections, and AIDS mortality recorded. Three models of covariance of sites were explored: each ANC prevalence estimate is independent (m0), sites are independent but estimates for a given site over time are correlated (m1), sites in a given country or region are correlated over time and with each other (m2). To implement the parametric bootstrapping procedure random deviates for θ were derived from the beta distribution by solving U[0..1] = beta cdf (μ, M), where U[0..1] is a random number uniformly distributed between 0 and 1, and beta cdf (μ, M) is the cumulative probability density function of the beta distribution. We use the same uniform random deviate for different sites (each with a different associated community mean μ) to allow for correlation in θ. In reality the covariance of sites is likely to lie somewhere between m1 and m2.
Fig 2 shows an example application of this approach to prevalence data from urban Zambia for covariance model m2. As expected, uncertainty in the estimates of new infections and AIDS mortality is greater than for adult prevalence, reflecting the additional uncertainty in adult survival and the shape of the epidemic curve.

The range about the median adult. (A) HIV prevalence, (B) HIV incidence, and (C) AIDS mortality estimates over time for urban Zambia for 1000 parametric bootstrap replicates assuming error in the mean of the sample from each site is correlated (covariance model m2). Zambia has a surveillance system classified as good.
It is not practical to apply this approach to all sets of prevalence data that are used to produce HIV/AIDS estimates in countries with generalised epidemics. We therefore adopt a heuristic approach to derive some general rules from applying the bootstrap approach to a representative set of eight countries. We classified these countries by quality of surveillance: good (Uganda, Zambia, and Ghana); average (Democratic Republic of the Congo and Chad); and poor (Eritrea, Angola, and Djibouti).20 We then applied the bootstrap approach to urban and rural data for each country.
Countries with poor surveillance and rural areas of countries with moderate surveillance have limited prevalence data, reflected in a vast range of epidemic curves that are statistically consistent with the data. In reality, a large fraction of these curves would be discarded by the epidemiologist making the estimate as being unrealistic. This judgement would usually be based on analogy with similar countries or consideration of what is possible epidemiologically. These criteria are not, therefore, provided by statistical analysis of the prevalence data but extrinsic considerations. This necessitates the use of plausible rather statistical bounds on estimates. Countries with limited data also tend to have poor coverage of more rural areas, further making plausibility the only sensible criterion. Plausible bounds for these countries are discussed further in the next section.
Countries with good surveillance and urban areas of countries with average surveillance have a narrower range of prevalence curves (see Zambia, fig 2). The 95% CIs for adult prevalence, new infections, and mortality are asymmetric (larger upper bound) and proportionally bigger for smaller estimates. This suggests the use of the logit transform (ln(x/(1-x))) where x is the estimate as a proportion of the adult population. This transformation results in symmetric, approximately normally distributed bounds about the estimates of prevalence, new infections, and mortality. For a given model of covariance of error across sites, the coefficients of variation (c.v. = standard deviation/mean) for each of the three transformed estimates are broadly similar for the countries with good surveillance data irrespective of prevalence level when calculated at the same point in time with respect to the latest available prevalence data. Thus, for example, estimates of adult HIV prevalence in 2003, 1 year after the latest available data, have broadly similar c.v. for Uganda, Zambia, and Ghana. Estimates for 2001 have smaller c.v. because prevalence data are available for the year of the estimate as well as the following year. The only exception to this pattern is adult AIDS mortality, which has less uncertainty (smaller c.v.) in countries where prevalence is declining or has been steady for some time. This is because AIDS mortality in a given year is largely dependent on prevalence levels 5–10 years earlier, and in these countries earlier prevalence estimates are better specified.
The appropriate model of covariance in the error in different ANC sites reporting at different times is unknown. It is likely to lie between models m1 and m2, as previously discussed, and in developing a heuristic rule we simply take the average of the c.v. for these two models. Further, we assume that the c.v. for a national estimate is the average of the c.v. for the urban and rural epidemic curves weighted by the population numbers in these areas. The heuristic, therefore, consists of a set of c.v. on the logit scale that are applied to country estimates of adult HIV prevalence, women living with HIV/AIDS, new infections, and AIDS mortality based on the quality of the surveillance system and the stage of the epidemic (rising, steady, and falling).
4) National estimates from a non-random sample
Although the method described above accounts for the quantity of data over time, it does not capture the representativeness of the sites with regard to the national population. Historically, the sentinel sites in countries in sub-Saharan Africa have been placed in urban and peri-urban areas. This ensures a larger number of pregnant women to test during the surveillance period and also makes logistics of testing and collation of surveillance data easier. Unfortunately, it also means that most surveillance systems do not provide much data on prevalence among pregnant women in rural areas.
This bias in the surveillance data cannot be accurately measured. In previous estimates for countries in sub-Saharan Africa, we have generally reduced rural prevalence by 20% to adjust for the bias. This adjustment can be improved upon by local review of clinic location and catchment population along with detailed demographic data on the geographic distribution of the entire population. This is only possible through laborious local consultation as carried out recently in Kenya and Malawi.21,22 The amount of coverage of rural pregnant women provided by the sentinel system varies by country. In an effort to capture this uncertainty and possible bias we have chosen to expand the uncertainty associated with the estimates based on the quality of coverage provided by the data.
In the absence of detailed local consultation, the plausibility bounds for countries where rural coverage is poor have been expanded by an additional 10% of their value. This includes most countries where the surveillance system is classified as poor or average.
Child estimates for generalised epidemics
The number of infants born with HIV and the number of children aged <15 years olds living with HIV/AIDS and dying from AIDS are estimated for each country with a generalised epidemic. These estimates are based on prevalence among pregnant women (equivalent to the adult prevalence estimates from ANCs), the probability of MTCT, and life tables for the survival of HIV positive children (fig 1). There is greater uncertainty in these estimates than for adult prevalence alone. Methods to estimate the additional uncertainty in child estimates for generalised epidemics and to produce plausible bounds about estimates are described below. Example plausibility bounds derived using these heuristics for countries with different quality surveillance systems are shown in table 2.
Example application of heuristic rules to obtain plausibility bounds for estimates of HIV/AIDS in a country with a stable, generalised HIV epidemic
Incident child HIV infections
The estimate of the fraction of live births that are HIV positive is simply the product of ANC prevalence and the probability of MTCT. The latter is assumed to be 0.32 with a standard deviation of 0.05 based on a recent review.17 We use the delta method to combine uncertainty in these two estimates to obtain overall uncertainty in the fraction of births that are HIV positive.23 Numbers of incident child infections are simply obtained by multiplying by the number of live births in a country and we ignore any uncertainty in this quantity.
Child AIDS deaths
The number of deaths among children in a country for a given year is derived from the convolution of the trend in HIV positive births and child mortality due to AIDS and other causes. Estimates of uncertainty in some of these parameters may be derived, while for others the uncertainty is largely unknown. We have chosen an approach that allows us to use available data to include some of the uncertainty in the estimates when producing the plausibility bounds, while other sources of uncertainty have been ignored. As such the plausibility bounds presented for child AIDS deaths are probably too narrow.
Firstly, consider the uncertainty in HIV related mortality among infants and children. The UNAIDS Reference Group has taken child survival from a five parameter double Weibull curve fit.17 The parameters in the curve were estimated by a non-linear least squares fit to published data. To estimate the uncertainty in HIV survival, those same data were refit to the double Weibull, again using least squares, and the parameter covariance matrix was estimated. Then a sample of 1000 sets of double Weibull parameters was drawn from a multivariate normal distribution based on that covariance matrix.
The distribution of HIV survival curves was then combined with a distribution of curves for survival from mortality due to other causes using Monte Carlo simulation to estimate the c.v. for the number of deaths due to AIDS in 2003 conditional on three patterns of incidence of HIV infections among infants over time (rising, steady, and falling). Mortality due to causes other than AIDS in the first year of life was assumed to be normally distributed with a mean of 10% and standard error of 5%. In subsequent years the hazard was assumed to be half that of the randomly selected hazard used in the initial year of life. Using this approach the c.v. was found to vary somewhat according to the epidemic pattern. For a rising epidemic the c.v. was ∼0.065, for a steady epidemic it was ∼0.08, and for a declining epidemic it was ∼0.09. This is because for a declining epidemic proportionally more AIDS deaths occur at older ages when estimates of survival are more uncertain.
To derive heuristic rules to generate plausible bounds around estimates of child deaths in each country with a generalised epidemic, uncertainty in child AIDS deaths for a given incidence of child HIV infections must be combined with uncertainty in incidence. We make the simplifying assumption that the number of deaths due to AIDS is a linear function of the number of incident HIV infections. We can therefore use the delta method to estimate uncertainty in the former from the simulated c.v. for the number of deaths given a fixed pattern of incidence and the cv for incidence estimated in the preceding section. Because we are working with numbers rather than proportions, variables are transformed on the log scale.
Child prevalence
The plausibility bounds for the number of children living with HIV are derived in a manner almost identical to that for child deaths. The only difference is that, instead of estimating the c.v. for deaths conditional on the number and pattern of the epidemic, the c.v. for children living with HIV was calculated in the simulation. For a rising epidemic the c.v. for child prevalence was found to be 0.10, for a steady epidemic it was 0.11, and for a declining epidemic it was 0.12.
Adult estimates for low level and concentrated epidemics
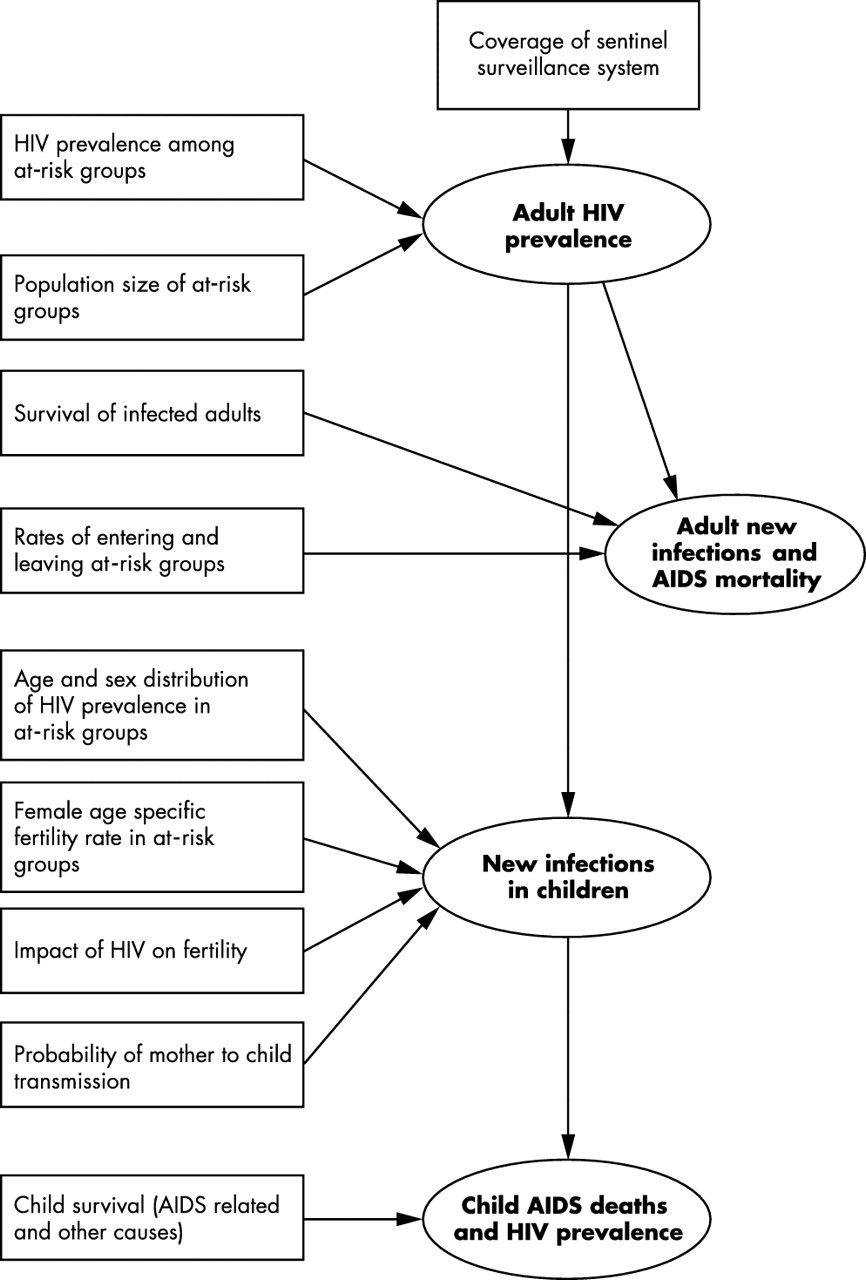
Estimates of national adult HIV prevalence for countries with low level or concentrated epidemics are based on the sum of the products of the estimated population size and prevalence for all groups considered at higher risk of HIV infection, and for the population at low risk. Estimates of adult new infections and AIDS mortality are subsequently derived by fitting an epidemic curve to a series of national prevalence estimates (fig 3). Those groups at higher risk of infection differ between countries, where epidemics may be concentrated among drug users, sex workers and their clients, men who have sex with men, or a combination of these. The diversity of low level and concentrated epidemics means it is difficult to estimate plausibility bounds that are comparable across countries.

Sources of uncertainty in the steps used to make estimates of HIV/AIDS in countries with low level and concentrated epidemics. Boxes represent sources of uncertainty while ellipses represent estimates produced by UNAIDS/WHO. The arrows indicate which estimates are affected by different sources of uncertainty.
Adult HIV prevalence
Workbooks to assist with the estimation process for low level and concentrated epidemics are described in an earlier paper in this series.5 These workbooks require low and high estimates of both prevalence and population size for at-risk groups in addition to the best estimate. These low and high estimates are typically based on expert judgement of plausibility, because surveillance data for these quantities are rarely amenable to statistical analysis. The advantage to this approach to capturing error is that it allows local analysts to set the plausibility bounds based on their knowledge of the strengths and weaknesses of their estimates. The disadvantage is that there is likely to be wide variation in how people decide on plausible bounds given their datasets.
Although statistical CIs can be calculated for estimates of population size for at-risk groups when standard techniques such as capture–recapture or multiplier methods are used, these techniques are rarely employed. Furthermore, where they have been employed, they are typically restricted geographically and therefore judgement must be made as to their appropriateness for application elsewhere in a country to produce a national estimate. Similarly, coverage of HIV sentinel surveillance sites among at-risk groups is typically poor, and judgements about the accuracy of national prevalence estimates must be made. Therefore, for bounds on estimates of adult prevalence and number of adults and women living with HIV/AIDS, we have simply used the median of the bounds provided by countries with low level epidemics (−70% and +100% of the best estimate) and concentrated epidemics (−50%, +60%). These plausibility bounds capture the perceived uncertainty in both the estimates of the sizes of the populations used in making the overall estimate as well as the uncertainty in the estimates of prevalence in each group.
Adult new infections and AIDS mortality
Estimating adult new infections and mortality in countries with low level or concentrated epidemics is more difficult and less certain than for generalised epidemics. The primary difficulty is reliance on an overall epidemic curve composed from national point estimates in multiple years and the concomitant lack of distinct epidemic curves for each of the at-risk groups. Some at-risk groups are likely to have a different background mortality (for example higher rates of death in drug users), and the duration of stay in the at-risk groups may vary. This can have substantial effects on the relationship between observed HIV prevalence and the underlying patterns of incidence and mortality that are inferred from the prevalence using the epidemic curve. Unfortunately country specific data on mortality and changes in risk behaviour are typically absent. So we have simply used the relationship between uncertainty in HIV prevalence and uncertainty in new infections and AIDS mortality estimated for generalised epidemics and applied it to low level and concentrated epidemics to derive minimum bounds about the estimates. This yields median plausibility bounds of −50% to +70% of the best estimate for adult AIDS deaths and −70% to +190% for adult new infections in countries with concentrated epidemics. For countries with low level epidemics the bounds are −70% to +80% for AIDS deaths and −80% to +240% for new infections. These bounds, while quite large, do not reflect the full uncertainty associated with all the steps in estimating adult new infections and AIDS mortality (fig 3) and are likely to be too narrow.
Child estimates for low level and concentrated epidemics
The majority of countries with low level or concentrated epidemics do not have estimates of the prevalence of HIV among pregnant women. Estimates for children require several additional steps compared with countries with generalised epidemics (fig 3). Estimates of the age and sex distribution of prevalent HIV infections are used to calculate the number of women with HIV by age group. Age specific patterns of fertility with suitable adjustments for the impact of HIV on fertility are then used to estimate the number of births to HIV positive women.7 Multiplying by the probability of MTCT gives the number of incident child HIV infections.
The fertility of female sex workers or injecting drug users is likely to differ from that of women in the general population. Unfortunately data on fertility in these groups are currently unavailable. In addition, data on the age distribution of HIV infection in these groups are limited. This makes plausible bounds around estimates of child HIV infections difficult to derive. Estimates of child AIDS deaths and HIV prevalence are based on incident child infections and so plausibility bounds on these estimates are similarly difficult to derive. So, we choose not to publish country specific HIV estimates for children in low level and concentrated epidemics.
DISCUSSION AND CONCLUSIONS
Why plausibility bounds
In this work we have chosen to describe the error around HIV/AIDS estimates in terms of plausibility bounds instead of statistical CIs because not all sources of error are amenable to statistical analysis. Wherever possible, formal statistical procedures have been used to quantify uncertainty. However, the resulting statistical CIs must then be combined with estimates of uncertainty based on expert judgement rather than quantitative analysis because of the absence of appropriate data. For example, biases in estimates of rural HIV prevalence due to the restricted locations of sentinel surveillance sites often cannot be quantified because of the lack of population prevalence surveys with more representative coverage that can provide a comparison. Instead, the size of the bias must be estimated based on consideration of the location of the clinics, rural–urban prevalence differences, and observations from other countries where population surveys have taken place. This use of plausibility bounds is similar to the approach taken in other fields (for example information theory, artificial intelligence)22,23 where information of varying quality has to be combined. It also has links to work in public health where decisions have to be based on expert judgement in addition to formal statistical inference.24,25
Use of other data sources
The HIV/AIDS estimates and their uncertainty explored in this paper are based on the analysis of sentinel surveillance data. Alternative data sources may sometimes be available to help refine the estimates and reduce the plausibility bounds.
Countries with concentrated epidemics often have additional sources of data that can directly inform and constrain estimates, narrowing the bounds to be placed on them. For example, in the Russian Federation all pregnant women are tested for HIV, and so the estimates of the number of children infected via MTCT can be accurate. Likewise, in countries such as Brazil and Argentina that have extensive voluntary counselling and testing programmes, case reports may also substantially reduce the bounds on the estimates.
In countries with generalised epidemics, estimates of deaths derived from vital registration systems or census rounds can be used to look at changes in age patterns of mortality over time and thereby generate an independent estimate of deaths due to AIDS. This approach has been used in Zimbabwe28 and South Africa,29 where the results have helped to improve estimates of HIV/AIDS. Estimates of orphan numbers in countries with generalised epidemics derived from sentinel surveillance of HIV30 can be compared with estimates from household questionnaires to further help validate UNAIDS/WHO estimates of HIV prevalence and AIDS mortality.31 In countries with concentrated epidemics orphan data are less useful as checks on HIV/AIDS estimates because AIDS orphans represent only a small fraction of all orphans. However, in some of these countries case reports of HIV, AIDS, or AIDS deaths can help set bounds on the estimates.
In countries with generalised epidemics, national population based surveys are increasingly becoming available, providing an additional sources of data on HIV prevalence. Population prevalence surveys typically provide HIV estimates for both sexes and also cover more remote rural areas. Available population survey data have been used to help refine the estimates for several countries in the UNAIDS/WHO 2003 estimates. However, it must be noted that although the sampling frame in population prevalence surveys is designed to reach a nationally representative sample, absence from the household and unwillingness to be tested can bias the results.32 Appropriate adjustments have therefore been made to take this bias into account, and additional work is ongoing to further inform these adjustments.
Final conclusions and future directions
In our approach to estimating plausible bounds around estimates of HIV/AIDS we have tried to include all major sources of uncertainty. However, some sources of uncertainty are difficult to estimate and have not been included. These include the availability of antiretroviral therapy (ART), survival of those on ART and effectiveness of prevention of MTCT programmes. Although information on coverage and effectiveness of these programmes is taken into account when making estimates of HIV, the uncertainty around the assumptions is not included in producing the plausibility bounds. For the UNAIDS/WHO 2003 estimates the current low coverage levels for most low and middle income countries makes this source of uncertainty quite small.33 However, as coverage increases this issue will become more important, especially in estimates of new infections and AIDS mortality. Additionally we have not considered errors resulting from problems with laboratory testing. While there are numerous studies showing that both sensitivity and specificity of the commonly used HIV tests are very high,34 these values do not capture the effects of poor sample handling and storage, or the use of out of date tests and poor reagents. Although quality assurance programmes reduce the likelihood of this source of error, this is not always the case. For example, the estimate of 33.7% adult HIV prevalence in Zimbabwe for the end of 2001 was based largely on surveillance data from the year 2000. An unrealistic drop in prevalence for subsequent years led to retesting of the samples for the year 2000 using a more specific test kit. This suggested that problems with laboratory error had resulted in an upward bias in prevalence of about 14% in the 2001 estimate.35
Global infectious disease statistics are rarely presented with bounds based on any formal or rigorous procedure. This leads to unnecessary debate about different estimates for specific diseases when in fact the difference may not be significant. We have presented methods to estimate plausible bounds about the UNAIDS/WHO estimates for HIV/AIDS at the end of 2003. This work represents a first step towards providing global disease statistics with more rigorously derived plausibility bounds. Future work will be needed to refine these methods.
Acknowledgments
We would like to thank the participants at the meetings of the UNAIDS Reference Group on Estimates, Modelling and Projections that have helped inform the methods used in developing HIV/AIDS estimates. Special thanks go to Simon Gregson for making available unpublished HIV estimates from rural Zimbabwe, Basia Zaba for providing estimates of HIV positive child survival, and Josh Salomon, Ping Yan, James Lewis, and Kamal Desai for helpful discussion.