Article Text

Abstract
This paper describes the Estimation and Projection Package (EPP) for estimating and projecting HIV prevalence levels in countries with generalised epidemics. The paper gives an overall summary of the software and interface. It describes the process of defining and modelling a national epidemic in terms of locally relevant sub-epidemics and the four epidemiological parameters used to fit a curve to produce the prevalence trends in the epidemic. It also provides an example of using the EPP in a country with a generalised epidemic. The paper discusses the strengths and weaknesses of the software and its envisaged future developments.
- ANC, antinatal clinic
- EPP, Estimation and Projection Package
- HIV
- modelling
- AIDS
- estimates
Statistics from Altmetric.com
The dynamics of national HIV epidemics are complex and almost all HIV epidemics consist of multiple sub-epidemics. These sub-epidemics may affect different sub-populations, occur with different timing and severity in different geographical areas, and usually evolve at different rates. Modelling the dynamics of many complex national epidemics realistically requires the ability to model the individual sub-epidemics of which they are composed. Even generalised epidemics in severely affected countries require considering urban and rural sub-epidemics separately. The Joint United Nations Programme on AIDS (UNAIDS) Estimation and Projection Package (EPP) has been designed as a tool for epidemiologists and analysts to construct national and sub-national epidemic curves, an essential step in the estimation of levels and trends in the epidemic and its impact. The EPP allows the user to define a national epidemic in terms of a locally relevant set of geographic and population group sub-epidemics, allowing the user to address epidemic complexity more realistically than has been possible in the past.
The EPP has been under development since 2001, and is the currently recommended tool for estimating and projecting HIV prevalence levels in countries with generalised epidemics. Generalised epidemics are defined as epidemics in which HIV is firmly established in the general population, and although sub-populations at high risk may continue to contribute disproportionately to the spread of HIV, sexual networking in the general population is sufficient to sustain an epidemic independent of sub-populations at higher risk of infection (HIV prevalence among pregnant women above 1% on a national basis has been proposed as a numerical proxy for generalised epidemics1). Currently the workbook method is recommended for estimates and projections in concentrated and low level epidemics.2 For countries with an epidemic level that is neither clearly generalised nor clearly concentrated, both methods can be applied. An early version of the EPP was used to produce the end-2001 UNAIDS/WHO estimates for the most heavily affected countries in the world.3,4
DESCRIPTION OF THE SOFTWARE
The EPP interface is designed to lead the user through the process of defining and modelling a national epidemic in terms of locally relevant sub-epidemics. The interface consists of seven key pages corresponding to the steps involved in defining and modelling an epidemic (three of these are shown in fig 1).


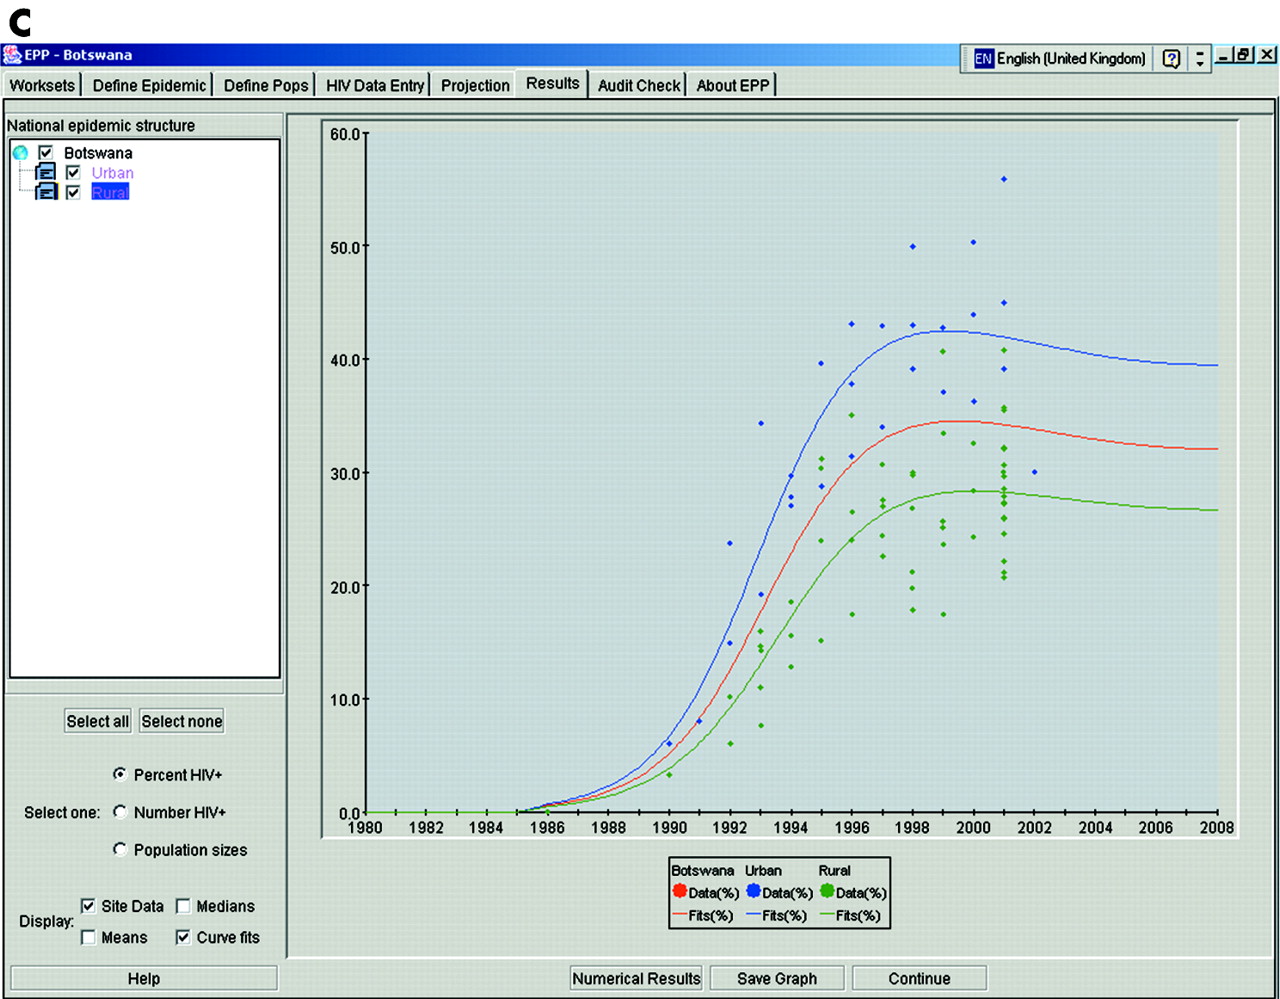
Screenshots of key Estimation and Projection Package windows: (A) HIV data entry page; (B) projection page; and (C) results page.
1. Workset page
The user names the projection workset and selects the country to be modelled. The workset is a single file that stores a complete national projection, including the structure of the national epidemic in terms of sub-epidemics, all of the data entered, the models fit to that data, and the results for later use, review, or modification.
2. Define epidemic page
The user defines what geographical sub-epidemics or sub-populations are relevant to the national setting and composes a national epidemic from these sub-epidemics. The EPP also supports predefined templates consisting of some of the most commonly used sub-epidemic sets, for example the urban/rural template.
3. Define pops page
The user divides the national population among the sub-epidemics defined on the previous page, specifies any special characteristics of each sub-population, and accepts demographic defaults, based on UN Population Division population estimates and projections, or enters his/her own demographic parameters for that sub-population. This is necessary because the EPP includes a demographic model that incorporates population growth over time.
4. HIV data entry page
The user enters HIV surveillance data for each sub-epidemic into a spreadsheet. The user can enter data for all available surveillance sites and years in which data were collected (see fig 1A). The user can also weight or adjust the data as described below.
5. Projection page
This is the heart of the EPP, where the user fits a model to the available HIV prevalence data for each sub-epidemic. The EPP automatically finds a mathematically reasonable fit, and the user can then adjust that fit (see fig 1B).
6. Results page
The user chooses which sub-epidemics and which data to display graphically. The user can display HIV prevalence in percentage, total number of HIV infections over time, and the size of the sub-populations involved in each sub-epidemic (see fig 1C). The user can also output prevalence in tabular form for use with Microsoft Excel or to a *.spt file that can be read by the Spectrum program.5
7. Audit check page
A number of consistency checks are run on the national epidemic developed by the user, including sizes of key sub-populations, maximum prevalence observed, and the ratio of lower risk to higher risk infections in the overall national epidemic.
The package
The EPP comes as a 15 MB Java based software package, and is currently available in English, French (EEP), Spanish, and Russian. The EPP has a user friendly interface with easily comprehensible windows and buttons (fig 1) and can be applied by people with varying professional backgrounds, including national epidemiologists, data analysts, and monitoring and evaluation professionals in countries. The EPP software and supporting documentation, including manuals, are available from the websites of several organisations, including UNAIDS (http://www.unaids.org), WHO (http://www.who.int), the East-West Center (http://www.EastWestCenter.org), and the Futures Group (http://www.FuturesGroup.com).
THE UNAIDS REFERENCE GROUP MODEL
For each sub-epidemic defined by the user, the EPP fits a simple epidemic model defined by the UNAIDS Reference Group on Estimates, Modelling and Projections to the full set of HIV surveillance data points entered by the user.6 This produces an estimate of the time trend of adult HIV prevalence for each sub-epidemic. These fits to individual sub-epidemics are then applied to the populations assigned by the user to each sub-epidemic to produce the prevalence trends in the overall national epidemic.
The UNAIDS Reference Group model incorporates population change over time and, by varying its parameters, can reproduce a variety of epidemic types including slow growing epidemics, rapidly growing epidemics, and stable epidemics in which HIV prevalence has peaked and then stabilised at high levels. The EPP automatically fits the four epidemiological parameters defined in this model (see fig 2). The φ parameter in fig 2 is related to the behavioural response of the population to the epidemic and the gradual exposure of previously unexposed populations to HIV due to geographic or social barriers. The model uses these four parameters to derive a best fit to data points by minimising the least squares difference between the fitted curve and the full set of data points (see reference 6 for mathematical details). It is recommended that at least 5 years of HIV prevalence data are used to fit an epidemic curve. A positive value of the parameter φ indicates that the decline in size of the at-risk population due to AIDS mortality is balanced by an increase in recruitment to the at-risk population. A negative value of φ indicates reduced recruitment to the at-risk population as AIDS mortality increases. Different values for φ allow the model to produce both sharply peaked epidemics (negative φ), and a constant endemic prevalence following the initial peak (positive φ). In the absence of change in recruitment to the at-risk population (φ = 0), the epidemic is still slightly peaked, due to the lag between infection and death from AIDS (see fig 2).

The parameters in the Reference Group model fit by EPP. r, The rate of growth of the epidemic; f0, the fraction of the population considered to be at risk of infection at the start of the epidemic; t0 the start year of the epidemic; φ a parameter that relates recruitment to the at-risk population to declines in the at-risk population due to AIDS mortality.
AN EXAMPLE OF THE EPP IN PRACTICE
In countries with generalised epidemics, the EPP may be applied by defining two major sub-epidemics—an urban sub-epidemic and a rural one. In these countries HIV prevalence in pregnant women attending antenatal clinics (ANCs) is taken to represent prevalence in all adults, male and female, aged 15–49. This key assumption is based on the comparison in a large number of studies of HIV prevalence among pregnant women and in community surveys among all men and women aged 15–49.7–14
Defining the epidemic and the populations
After giving the workset a name on the workset page and adding both urban and rural sub-epidemics on the define epidemics page, the user goes to the define pops page and divides the national population among urban and rural components. The urban/rural population sizes are entered on this page, following which the user enters HIV surveillance data from ANCs for the urban and rural populations, respectively.
Fitting a model and accepting or changing the fitted parameters
On saving the HIV data for the rural women, the user is automatically brought to the projections page where the model can be fit to these data. The EPP fits the epidemic curve to the data points by changing the values of the four parameters of the model. In many cases, the fit that results is acceptable and in agreement with the user’s understanding of the evolution of the epidemic in his/her country.
However, it is possible that the parameters resulting from the automatic fit are not the best ones to represent the local epidemic. Indeed, in many countries surveillance data are scarce, especially in the early years of the epidemic, and while the EPP will fit a curve, that curve will need to be reviewed by the user to ensure that it makes epidemiological sense given his/her knowledge of the local situation. If the initially fitted curve does not appear to represent the epidemic well, the values of any of the model parameters can be changed by the user until a more acceptable fit is obtained. The start year of the epidemic can be changed by modifying t0. The rate of growth of the epidemic can be increased or decreased by raising or lowering the value of r. The prevalence peak can be adjusted by changing the value of f0 and the shape of the epidemic after the peak can be altered by changing φ. The EPP displays both how the changed parameters alter the shape of the prevalence curve and how they affect the sum of squared errors.
Adjustments and weighting of sero-prevalence data
Surveillance data are not perfect—for a number of reasons they may overestimate or underestimate HIV prevalence. The number and location of surveillance sites also often changes over the years. The EPP provides the ability on the HIV data entry page to deal with some of these issues through prevalence adjustments and weights.
Prevalence adjustments
Prevalence adjustments in the EPP, which are applied to all data points in a given year, will reduce or increase the prevalence values before using them in the fitting algorithm. An example of this in practice is in adjusting for the non-representative nature of rural surveillance sites in many countries with generalised epidemics. In many countries the clinics that have been chosen to report unlinked anonymous HIV surveillance data in rural areas are those that have the capacity to collect the required number of samples in the given time. Often, this means that clinics in peri-urban or semi-urban sites have been used. Because there is often a decreasing gradient in HIV prevalence from semi-urban to rural areas, these clinics may overestimate HIV prevalence for the rural population as a whole (defined in the define pops page). The UNAIDS Reference Group has recommended that local knowledge of the surveillance sites and their location should inform decisions about a possible adjustment for this bias. In the absence of local data, the UNAIDS Reference Group recommends seroprevalence values from these rural sites be adjusted to 0.8 of their original value.
Weights
Weighting does not reduce or increase the prevalence values; instead, it gives more or less weight to the data from a particular site in the least squares calculation that is used to fit the epidemic model. For example, consider a country that has six urban ANC sentinel surveillance sites, including one in the capital city. The total urban population is six million, of which three million are in the capital city. In this example the capital city site should have an equal weight as the five other sites together, because it has half of the urban population. Hence, the capital city site would be weighted 1, while the five other sites would be weighted 0.2 each. Similar weighting can be used to correct for unequal representation of other geographic regions by sentinel surveillance sites.
Incorporating information from population based surveys
Several countries with generalised epidemics have recently conducted national community based surveys and several more countries are conducting or planning to conduct similar surveys. These surveys with national coverage provide a direct estimate of HIV prevalence among adults. It is critical to carefully consider the quality of these surveys, to help decide whether they may be biased.15 To explore the possible presence of bias, it is important to quantify the non-response rate and to assess whether absentees and/or refusers may have a higher HIV prevalence. In addition, other aspects of the survey, including the quality of HIV testing, need to be considered. As appropriate, the HIV prevalence from national surveys should be adjusted to correct for biases. The UNAIDS Reference Group on Estimates, Modelling and Projections has recommended the use of the national survey derived HIV prevalence estimates, adjusted as appropriate, to calibrate the HIV prevalence level in the EPP. This should be done separately for urban and rural areas and, if the information is available, also by geographical regions.
The results of a country fit—Botswana
Fig 1 shows the results of fitting an epidemic in Botswana with the EPP. The epidemic was defined as urban and rural. The first panel (HIV data entry page) shows the urban data that were used in fitting the epidemic in the urban parts of the country. In the second panel (projection page) one sees the fit obtained by the EPP to the urban surveillance data in Botswana. In the third panel (results page) one sees three curves: the top curve is the urban prevalence in Botswana, the bottom curve is the rural prevalence in the country, and the central curve is what results when these are combined, that is, the overall national HIV prevalence.
STRENGTHS
In contrast to simple approaches such as EPIMODEL,16 which only required a start date and a prevalence estimate for 1 year, the EPP gives countries the capability to make full use of all available surveillance data in developing epidemic curves. By giving countries the ability to include separate sub-epidemics, for example urban and rural sub-epidemics in most of sub-Saharan Africa, and combining them easily to obtain national prevalence, it simplifies the modelling process. As more countries with complex concentrated epidemics obtain sufficient years of surveillance data in the key populations influencing their epidemics, the EPP will provide an organising framework for collating and combining the results of the various sub-epidemics into a national prevalence curve. Additionally, in countries such as China and India, where each state/province is bigger than many nations, the EPP provides a tool that can deal with the geographical diversity of the epidemic.
The new curve fitting approach incorporated into the EPP is a major improvement on the gamma function used in EPIMODEL. The UNAIDS Reference Group model allows a variety of epidemic shapes to be fit by varying its parameters. And, most importantly, it allows HIV prevalence to stabilise at high levels, as has been seen in many African settings. Such endemic prevalence requires ongoing HIV incidence to counterbalance AIDS mortality as the epidemic ages. The gamma function was incapable of reproducing these epidemics because incidence always declines to zero shortly after peak prevalence.
LIMITATIONS
The major limitations in the EPP are related to the quality and non-representative nature of data available at present. As discussed above for generalised epidemics, rural data are often not very representative of rural populations, and the EPP by itself cannot resolve this problem—improvements must be made in the data systems themselves so that they are obtaining data representative of the populations of concern. Similar concerns are seen in concentrated epidemics, where representative data are often unavailable. For example, surveillance of HIV prevalence among injecting drug users may only occur in clinics in major cities or a handful of detention centres.
The more sophisticated model is both a strength and a weakness. The UNAIDS Reference Group model itself is based on an epidemiologically derived set of equations that model the transmission of HIV—this means it does a good job of fitting the full range of HIV epidemic types observed in the world. The model’s parameters have a relatively simple interpretation such as the rate of growth of the epidemic or the proportion at risk of infection. However, this can lead users to over interpret the implications of specific parameter fits. For some surveillance data, there may be many sets of r, f0, t0, and φ values that provide comparable fits, particularly with widely varying values of r and f0. But many users try to interpret these values as having real world meaning. For example, the parameter for the initial fraction of the population at risk f0, may be interpreted as a measure of risk in a given population. However, uncertainty about this estimate may make this interpretation meaningless. Thus, users must be cautioned against taking the model too literally.
FUTURE WORK AND MODIFICATIONS UNDER CONSIDERATION FOR THE EPP
At present, the EPP can give no estimates of the uncertainty associated with model fits, nor can it estimate high and low future scenarios for the HIV epidemic based on the parameters fit. And yet, this is one of the outputs that could be of the greatest value to policymakers and programme planners in preparing for the future. Approaches to ranges reflecting the certainty around the prevalence estimates have been developed17 and these will be incorporated in the EPP in the future.
The EPP is expected to also support estimates and projections in concentrated and low level epidemics in the near future. In concentrated epidemics, HIV remains focused in higher risk populations. Individuals may only be at higher risk and hence included in such populations for short periods. For example, sex workers enter sex work for a period of time and then the majority of them return to the “general” female population. As currently implemented, the EPP only allows exit from populations through mortality. Different ways of dealing with exit from high risk populations other than death are under consideration by the UNAIDS Reference Group on Estimates, Modelling and Projections as of spring 2004.
The current version of the EPP, for all its sophistication, is still only a curve fitter. It takes the data points provided and adjusts the four parameters to find single fixed values of those parameters that fit the observed data. This does not allow it to deal with issues such as behavioural change in response to interventions (for example increased condom use, decreases in STIs due to improved treatment, and changes in the size of the at-risk population as a result of vaccine introduction). These might be dealt with by allowing for changing values of r or f0 over time, but the Reference Group needs to consider carefully how to do this and whether data availability in most places is sufficient to justify it. Should it prove feasible, it might allow a version of the EPP to be created in which alternative future projections could look at the impact of specific behavioural changes.
CONCLUSIONS
The EPP is an improvement over previously used tools for estimating and projecting HIV prevalence. We believe it is an appropriate tool for use with the currently available surveillance data in most countries with generalised epidemics and, with the modifications that will be made over the next year, will be an appropriate tool for modelling concentrated epidemics as well. The development of the EPP is part of an ongoing process of improving surveillance systems, preparing more accurate estimates, and creating better tools to help national programmes analyse and project their epidemics. Driven by the need to more effectively address national HIV epidemics, this process will continue to evolve over the coming years.
Acknowledgments
The authors would like to acknowledge the work of the people who have participated in the meetings of the UNAIDS Reference Group on Estimates, Modelling and Projections. In particular the authors would like to gratefully acknowledge the work of Marc Artzrouni, Griff Feeney, David Schneider, Peter O Way, Ping Yan, Basia Zaba, and Hania Zlotnik, who were instrumental in developing the approach to curve fitting implemented in the EPP.