Article Text

Abstract
Background: The approach to national and global estimates of HIV/AIDS used by UNAIDS starts with estimates of adult HIV prevalence prepared from surveillance data using either the Estimation and Projection Package (EPP) or the Workbook. Time trends of prevalence are transferred to Spectrum to estimate the consequences of the HIV/AIDS epidemic, including the number of people living with HIV, new infections, AIDS deaths, AIDS orphans, treatment needs and the impact of treatment on survival.
Methods: The UNAIDS Reference Group on Estimates, Modelling and Projections regularly reviews new data and information needs and recommends updates to the methodology and assumptions used in Spectrum. The latest update to Spectrum was used in the 2007 round of global estimates.
Results: Several new features have been added to Spectrum in the past two years. The structure of the population was reorganised to track populations by HIV status and treatment status. Mortality estimates were improved by the adoption of new approaches to estimating non-AIDS mortality by single age, and the use of new information on survival with HIV in non-treated cohorts and on the survival of patients on antiretroviral treatment (ART). A more detailed treatment of mother-to-child transmission of HIV now provides more prophylaxis and infant feeding options. New procedures were implemented to estimate the uncertainty around each of the key outputs.
Conclusions: The latest update to the Spectrum program is intended to incorporate the latest research findings and provide new outputs needed by national and international planners.
Statistics from Altmetric.com
Projections of adult HIV prevalence are prepared using the Estimation and Projection Package (EPP)1 for generalised epidemics and the Workbook for low-level and concentrated epidemics.2 The Spectrum projection package is used to determine the consequences of the prevalence projections, including the number of people living with HIV by age and sex, new infections, AIDS deaths, AIDS orphans, the need for treatment and the impact of treatment. Other demographic indicators of interest, such as life expectancy and under-five mortality are also estimated. Earlier updates to Spectrum have been described previously.3 A full description of the methodology is provided in the manual for the AIDS module of Spectrum (AIM).4 The purpose of this paper is to describe the updates to Spectrum made in the last two years and used in the 2007 global estimates of HIV/AIDS.
Spectrum is a modular program that is used to examine the consequences of current trends and future programme interventions in reproductive health. The program and manuals are updated regularly and available in multiple languages free of charge at www.FuturesInstitute.org. Model development has been funded primarily by USAID with technical collaboration from UNAIDS, WHO, UNICEF, UN Population Division, US Census Bureau, UNFPA and other organisations.
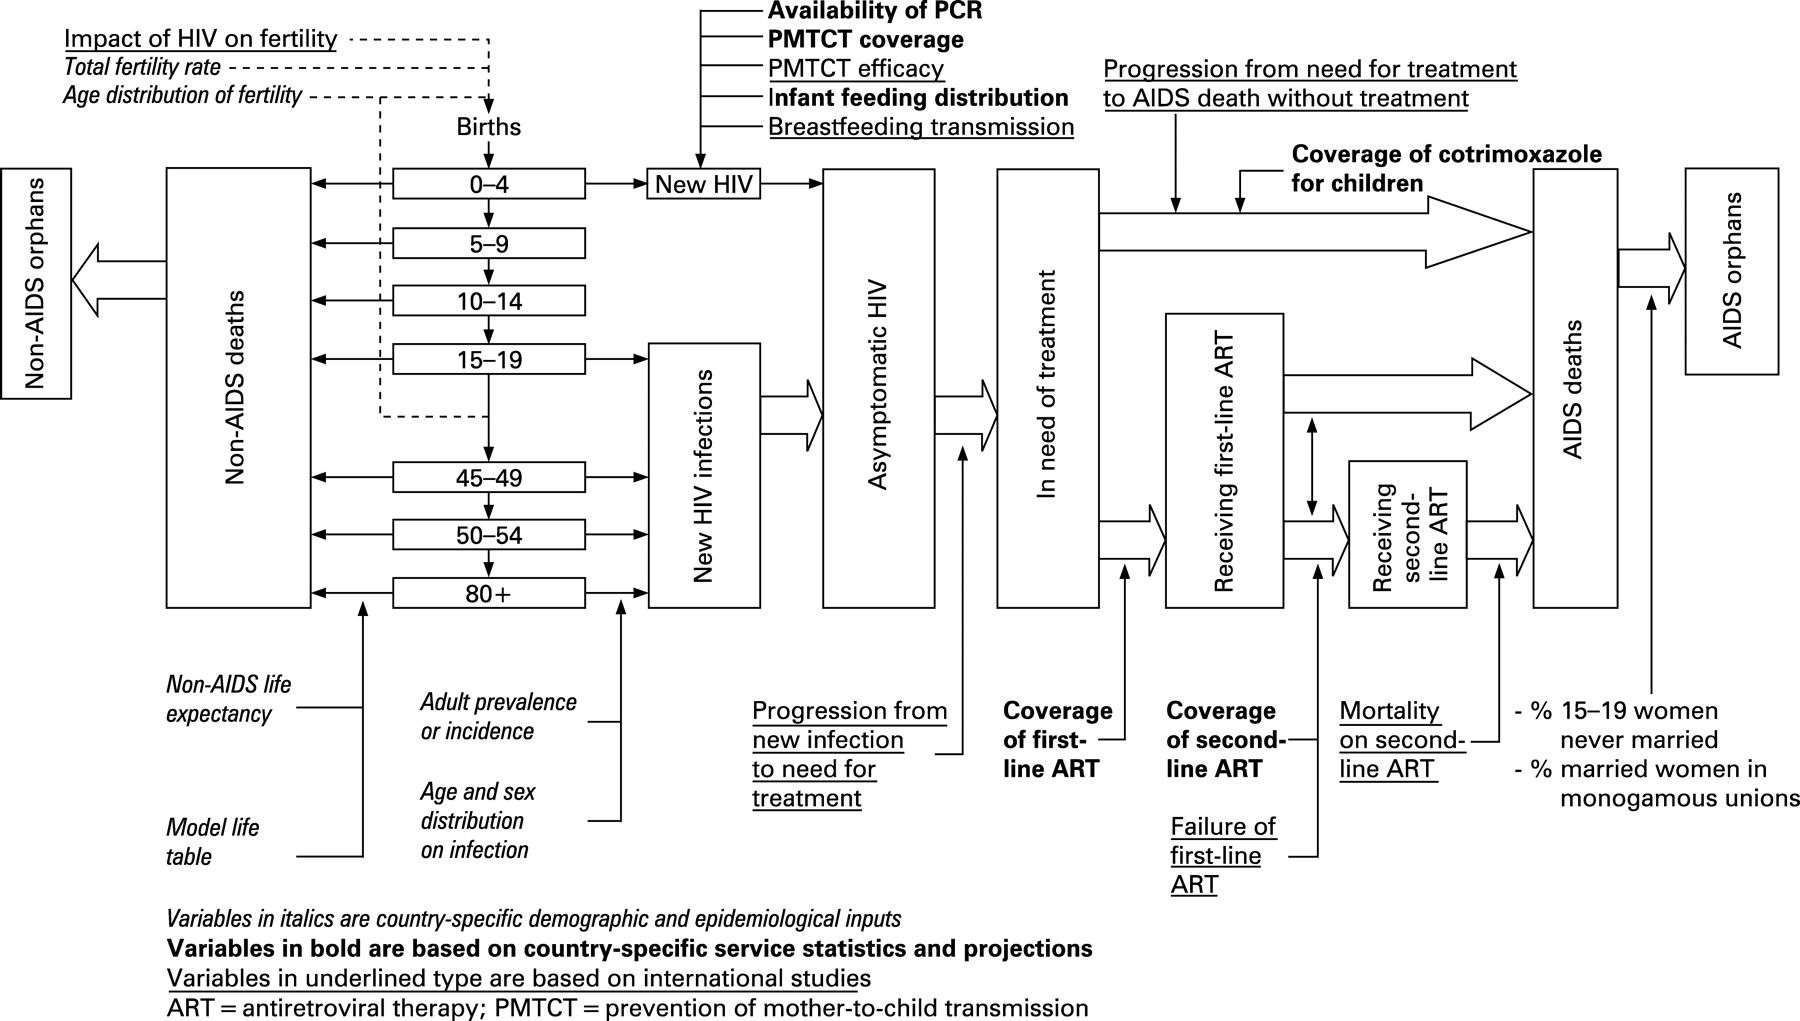
The major inputs and outputs of the AIDS module of Spectrum are shown in figure 1. Demographic projections are based on user inputs or projections prepared by the United National Population Division.5 The projections start with an estimate and projection of adult prevalence, which is combined with information on the age and sex distribution of prevalence and progression to death to estimate the number of new adult infections by age and sex. New infant infections are estimated from prevalence among pregnant women and the rate of mother-to-child transmission, which is dependent on infant feeding practices and the coverage of prophylaxis with antiretrovirals (ARVs). New infections progress over time to a symptomatic stage where antiretroviral treatment (ART) is needed. Those who receive first-line and or second-line ART experience extended survival. People at any stage are subject to non-AIDS mortality at the same rates as those who are not infected. Adult deaths result in orphans.

Several major enhancements were made for the 2007 round of estimates in response to (1) a review of the programme undertaken by the US Census Bureau, (2) new evidence from cohort studies, (3) revised child treatment guidelines, and (4) a need to produce uncertainty bounds for all estimates. The rest of this paper describes the changes to the demographic procedures for projecting by single age, a new pattern for the progression from new infection to need for treatment and AIDS death, new assumptions about survival on ART, revised prevention of mother-to-child transmission (PMTCT) treatment options and the new procedures for estimating uncertainty.
NON-AIDS MORTALITY BY SINGLE YEAR OF AGE
Demographic projections rely on model life tables to describe the age-specific pattern of mortality corresponding to assumed levels of life expectancy at birth. The standard tables, Coale-Demeny and United Nations, show mortality in five-year age bands that are suitable for demographic projections made in five-year intervals. The rapidly changing dynamics of an AIDS epidemic require single-year projections. Previously Spectrum produced single-year projections by dividing the five-year mortality into equal amounts by single age. In order to improve the estimates of non-AIDS survival ratios by single years of age, the new Spectrum uses a modification of the Beers6 osculatory interpolation method to convert abridged model life-tables into complete life-tables. The Beers method has been used for many years by actuaries and demographers to interpolate curves or populations based on five-year age groups to single years of age.7 The problem is that the rapid change in the survival curve as a result of the relative level of infant-to-child mortality makes it difficult for a generalised procedure to reproduce that change. It has been observed that the Beers estimate of the stationary population in a life-table (Lx) for age 1 is usually close to an independently derived value, but the problem is the relative values of the age 0 (that is, under age 1) and ages 2–4. In cases where an independent estimate of age 0 is available (as in the case of model life-tables) the Beers estimate for age 1 can be used and a polynomial can be fitted to the independent age 0, the Beers age 1, residual 2–4, and Beers 5–8, 9 and 10. This results in a smooth curve of 1Lx that fits the original 0, 1–4, and 5–9 and blends smoothly to the Beers estimates for ages 10 and over. The resulting 1Lx values are then used to estimate the survival ratios:
Sx = Lx/Lx−1 (1< = x< = 79)
S0 = L0/l0
S80 = T80/T79
where Sx = one-year survival ratio from age x − 1 to age x, for x = 0 from birth to age 0, for x = 80 from age 79+ to 80+, Lx = life-table stationary population age x, l0 = radix of life table, Tx = life-table stationary population ages x and above.
PROGRESSION FROM INFECTION TO AIDS DEATHS IN THE ABSENCE OF TREATMENT
Previous versions of Spectrum relied on estimates of survival post-infection based primarily on one developing country study: the natural history cohort of the MRC/UVRI study in Masaka, Uganda8 (with additional data from Haiti and a Thai military cohort) implying a median survival time from infection to death of 9 years. Recent analyses produced by the Alpha network9 linking HIV cohort studies in a larger number of developing countries widened the evidence base for estimating survival patterns in HIV-infected adults.10
Comparable analyses of data from studies in six different countries11–16 showed that survival times varied by study site and age, with median survival times for those infected before age 20 more than twice as high as for those infected aged 40 and over. A meta-analysis17 showed that after adjusting to age 25–29 at seroconversion, median survival was longer in South African miners, 11.6 years (95% CI 9.8 to 13.7) and African population cohorts, 11.1 years (95% CI 8.7 to 14.2) than in Haiti, 8.3 years (95% CI 3.2 to 21.4) and Thailand, 7.5 years (95% CI 5.4 to 10.4). Median survival for women was about one year longer than for men, but this was explained by their younger age at infection. Before the introduction of ART, there were no discernible trends in survival time by calendar year of infection.
To make survival estimates for populations with different levels of non-HIV mortality, “net” mortality patterns were calculated in studies that also collected data on mortality patterns of those not infected with HIV.18 Net proportion surviving x years after infection, SN(x), was calculated from observed (gross) survival of infected people, SG(x), and the corresponding survival for uninfected people, SU(x), using the relation:

Figure 2 compares “net” mortality curves for the three grouped East African community studies (Rakai and Masaka in Uganda, Kisesa in Tanzania), and for the South African miners cohort, and shows a superimposed model representation of “net” mortality among HIV-infected people, generated by the Weibull function with φ = 2 and λ = 13.21 (median 11 years):


In the Spectrum model representing survival post-infection before the availability of ART, separate Weibull models are used to represent male and female survival. For most countries the male and female models have median survival times of 10.5 years and 11.5 years respectively, to allow for the older age at infection for males compared to females. For Thailand, Cambodia and Burma, the Thai cohort data are used to produce Weibull models with median survival times of 8.1 years and 8.9 years respectively.
TIME TO ELIGIBILITY FOR ANTIRETROVIRAL TREATMENT
For a rising proportion of people living with HIV the progression to AIDS death described above is modified by antiretroviral therapy (ART). Previously eligibility for ART was estimated as occurring two years before AIDS death. A number of cohort studies provide new evidence on the time to eligibility. The eligibility of antiretroviral treatment (ART) in lower income countries (eART-linc) Collaboration is a collaboration between five cohort studies of HIV-1-infected patients from Africa19–22 and Thailand23 24 initiated in 2007 by UNAIDS for collaborative analyses of the natural history of untreated HIV infection in lower-income countries. The eART-linc collaboration aimed at estimating duration from seroconversion to different treatment eligibility criteria, and duration from ART eligibility criteria to death from all causes. By October 2007, the eART-linc collaboration analysed 2072 seroconverters with 16 157 person-years of follow-up from five cohorts from Côte d’Ivoire,19 Uganda20–22 and Thailand.23 24 Duration from seroconversion to different ART treatment eligibility criteria was estimated by fitting Weibull survival models, censoring individuals when ART start was recorded or when last seen, whichever occurred first. Consistency constraints were set so that the mean time from seroconversion to death was equal to the sum of the mean time from seroconversion to reaching ART eligibility and the mean time from ART eligibility to death. The eART-linc collaboration estimates for the median duration from ART eligibility to death were from 2.1 years to 4.0 years for different ART eligibility criteria.
The estimates of the time from ART eligibility to death (in the absence of ART) were longer than those used in earlier calculations of the number of people needing ART25 and were even longer when excluding the Thai studies from the analysis. The main reason for this was that the models were built in a way to incorporate the true—but never observed—time when a person first reached ART eligibility. Despite the pooling of several datasets in eART-linc, uncertainty of estimates was substantial and the available data were too scarce to estimate the relevant time periods in relation to the full ART eligibility criteria as recommended by the World Health Organization: patients who have either <200 CD4 cells ×106/l or WHO stage 4 disease or a combination of 200<CD4 cells ×106/l <350 and WHO stage 3. Compared to the criterion of CD4 count below 200 cells ×106/l, the combined WHO criteria would result in a shorter time between seroconversion and reaching ART eligibility, and a longer period between ART eligibility and death in the absence of ART.
SURVIVAL ON ANTIRETROVIRAL THERAPY
In the past very little information was available on the effectiveness of ART in averting death in developing countries, but the recent expansion of ART has provided new data. A literature review was conducted to update our knowledge about survival after treatment initiation26–35 (table 1). A systematic review of published reports on survival among HIV-infected patients on ART in LINCs has been conducted, focusing on those reports investigating the factors associated with mortality in adults and children. Three readers independently extracted data from articles that were selected after screening of PubMed/Medline up to December 2006 and abstracts of the 2001–6 international Conferences. Observational cohorts and clinical trials and programme reports were eligible as long as they took place in LINCs and included patients on ART. Only the studies with the occurrence of death as outcome were included in this review (the studies restricting their findings to the immunological or virological response were excluded). The details recorded included patient demographic characteristics, baseline CD4 count, survival estimate and factors associated with mortality on ART.
For adult patients, a total of 25 articles were included in this review among 878 screened. Twelve months after starting ART, the overall mortality rate ranged from 0.06 to 0.26—that is, the 12-month probability of survival ranged from 0.74 to 0.94. It was generally lower in patients starting ART with CD4 <50 cells ×106/l (range 0.67–0.91 ×10⁶/l). The factors associated with poorer survival among adults were low CD4 count (15 reports out of 15 studying this factor), advanced WHO stage 3 or 4 (10/12 reports), low body mass index (6/8 reports), low haemoglobinaemia, with different cut-off values (5/6 reports), male gender (3/7 reports) and poor adherence (1/1 report). The death rate was the highest in the first three months following the initiation of ART (from 5.1 to 37.3 per 100 person-years among five reports). For children, only three articles could be included among 23 originally selected. The six-month survival after ART initiation varied from 0.91 to 0.95. A low CD4 percentage was associated with poorer survival on ART. Little or no data were available on survival according to the different first-line regimens and the treatment switches occurring in the first year on ART.
ART treatment programmes in LINCs have survival rates comparable to those reported in developed countries in the early phase of ART introduction 10 years ago.26 The most recent survival estimates of the ART-LINC Collaboration, pooling individual adult data from 36 615 patients on ART in 17 cohorts in Africa, Asia and South America, are 0.939 one year after starting treatment (95% confidence interval: 0.936 to 0.942) and 0.929 after two years (0.926 to 0.932) (fig 3). However, the frequency of patients lost to follow-up is of serious concern to fully interpret the survival/mortality findings in the cohorts reporting both events36 (table 1). In the ART-LINC Cohort Collaboration, the proportion of patients lost to follow-up in the first six months on ART was as high as 16% among 7651 adults enrolled in 15 cohorts.37 In Spectrum we have used values of 0.85 for first-year adult survival on ART (rounded weighted average from table 1). Data on survival in subsequent years are sparse but are clearly much higher than first-year survival. We have used 0.95 as the annual survival for subsequent years. The annual survival for children over age 1 year on ART is set at 90% in the first year of ART and 95% in subsequent years, based on treatment results in children in Abidjan.38 39 Survival on ART among children under age 1 year is assumed to be 80%.

PROGRAMMES TO PREVENT MOTHER-TO-CHILD TRANSMISSION OF HIV
Recent scientific and programmatic evidence has led to the review of approaches to the use of ARV drugs in the context of PMTCT. In general, longer prophylactic ARV regimens starting earlier in pregnancy are more efficacious than shorter regimens. Studies conducted in both Asia and sub-Saharan Africa have shown that a combination regimen of AZT plus single-dose nevirapine (SD-NVP) is more effective than single-drug regimens in formula-fed as well as breastfeeding populations. AZT plus SD-NVP is as effective as more complex regimens of AZT/3TC starting at around 32-36 weeks given alone or plus SD-NVP. In the absence of any intervention, postnatal transmission of HIV accounts for 5% to 20% additional transmission rate. Mixed feeding is associated with higher transmissions rates compared with both replacement feeding and exclusive breast feeding. Three major cohort studies conducted in Côte d’Ivoire, South Africa and Zimbabwe have shown that exclusive breast feeding for up to six months is associated with a threefold to fourfold decreased risk of postnatal transmission. While data exist on the impact of single and dual prophylactic regimens on postpartum transmission through breast feeding, the safety and efficacy of ART on this mode of transmission is still under investigation. However, programme data from Botswana, Cote d’Ivoire, Mozambique and Uganda indicate that ART initiated in pregnant women might reduce postnatal transmission through breast feeding.
Concerns have been raised regarding the risk of decreased virological response in women with viral resistance related to intrapartum exposure to SD-NVP. Recent data showed that an AZT/3TC “tail” given at the time of SD-NVP and for a short time post partum reduces viral drug resistance when SD-NVP is given either alone or in combination with AZT.
WHO recommends ART for all pregnant women who are eligible for treatment. The goal is to secure the health of women, significantly reduce HIV transmission to their infants and improve child wellbeing and survival. For pregnant women with HIV who do not yet require ART, antiretroviral prophylactic regimens are recommended for the prevention of MTCT. The recommended regimens are based around AZT (from 28 weeks of pregnancy or as soon as possible thereafter) plus single-dose nevirapine, plus maternal 7-day “tail” of AZT and 3TC and one-week AZT for the infant.
Various ARV regimens for PMTCT are currently implemented in low-income and middle-income countries. These regimens range from single drugs, such as SD-NVP and short-course AZT, to dual and triple drugs. Spectrum has been updated to include the full range of treatment and prophylactic options now available and the distribution and duration of infant feeding methods as shown in table 2.
UNCERTAINTY ANALYSIS
Spectrum produces a point estimate for each indicator for each year. However, there may be a considerable amount of uncertainty associated with each point estimate owing to: (1) uncertainty around the prevalence curve produced by EPP or the Workbook, and (2) uncertainty around input assumptions that are based on studies from population samples in selected countries. In previous rounds uncertainty bounds were estimated by cumulating the uncertainty for each step in the calculation for a typical generalised or concentrated epidemic and applying the resulting bounds to all countries. In 2005 those calculations were done for a large number of countries in each category. For the 2007 estimates these procedures have been added to Spectrum and are applied to estimate uncertainty bounds for each country.
The prevalence trend is an input to Spectrum that comes from EPP for generalised epidemics and from the Workbook for low-level and concentrated epidemics as described in other articles in this supplement. EPP generates 1000 prevalence curves from its Bayesian melding approach and passes those to Spectrum for use in this analysis. The Workbook method passes just a series of annual estimates of adult prevalence. Spectrum generates 1000 prevalence curves from the annual estimates of prevalence by fitting a single logistic curve for countries where prevalence is rising or stable and a double logistic curve if prevalence is falling. The equation for the single logistic curve is:
Prevt = a eα (t−t0)/(1+eα (t−t0))
For the double logistic curve the equation is:
Prevt = α e(t−t0)/(1+α e(t−t0))×[2 a e−β(t−t0)/(1+e−β(t−y0))+b]
where a = parameter describing the asymptote, α = parameter describing the rate of increase, t0 = year the curve reaches one-half of the asymptote, b = asymptote after the decline, β = rate of decline.
For each of 1000 iterations the prevalence points are randomly varied within some range and a logistic curve is fit to the resulting points. The range of variation around each data point is dependent on the quality of the surveillance used to estimate prevalence. For countries with good surveillance systems the range is −40% to +60% of the point estimate. The range is increased to −48% and +102% for countries with medium quality surveillance and to −53% to +183% for those with poor quality surveillance systems. The quality of national surveillance systems has been estimated on the basis of the frequency and consistency of surveillance and the number of urban and rural sites.48
The Spectrum uncertainty analysis consists of a large number of Monte Carlo runs, usually 1000, that each randomly select a prevalence curve from the EPP or Workbook fits and input values for other parameters from a range that can be set by the user. The default ranges use standard deviations of 0.05 for mother-to-child transmission rates, 0.2 for the effects of HIV on fertility for 15–19 year old women, 0.1 for the effects of HIV on fertility among 20–49 year old women, 0.10 for the effect of cotrimoxazole on mortality and 0.05 for the ratio of female to male prevalence. Ranges for the age distribution of prevalence are estimated from national surveys of HIV prevalence in sub-Saharan Africa. Ranges for the progression from infection to need for treatment and need for treatment to death are generated from Weibull curves that vary the median time of progression by plus or minus two years. The user has the opportunity to examine and change any of these default ranges before processing. For example, the uncertainty around the female-to-male prevalence ratio may be low in a country that has recently had a national sero-survey but would be considerably higher in a low-level or concentrated epidemic without such a survey. Not all of these inputs will affect the final results. For example, if cotrimoxazole is not used in a particular country then variations in the assumption of effectiveness of cotrimoxazole will not affect the estimate of child AIDS deaths. Once processing starts Spectrum generates 1000 different runs randomly selecting values from these ranges. The results are stored and then sorted to determine the ranges for any percentile selected. We term these ranges plausibility bounds to indicate that they are not true uncertainty ranges.
OTHER ENHANCEMENTS
There are a number of other updates to Spectrum for the 2007 estimates. All the demographic inputs have been updated to use the 2006 round of estimates and projections from the United National Population Division.5 There are new utilities to ease the manipulation of a large number of country files. These utilities include Extract, which extracts the time series for any indicator or selection of indicators from multiple Spectrum projection files; Aggregate, which combines multiple projection files into a single file for a region; and Scenario Generator, which applies the same set of scenario projection assumptions for the key HIV inputs across a selection of projection files.
Another new feature allows the input of incidence, rather than prevalence, to drive the Spectrum projection. This is particularly useful in examining the impact of prevention interventions when the impact on incidence can be determined or for examining the impact on prevalence of enhanced survival due to ART.
STRENGTHS
The outputs of Spectrum include indicators useful for understanding the scope and magnitude of the epidemic, such as numbers of people infected, new infections and AIDS deaths, and indicators needed for planning the response, such as the number of people needing treatment or PMTCT services. The estimates are used by both national programmes and by international agencies mobilising commitment and resources. Recent updates to Spectrum incorporate the latest research findings and allow national programmes to examine the implications of those results for their programmes. Key researchers contribute their expertise to the selection of approaches and assumptions used in Spectrum through participation in meetings of the UNAIDS Reference Group on Estimates, Modelling and Projections.
LIMITATIONS
Many of the assumptions in Spectrum are derived from a small number of studies. These studies may not be representative of all populations. Many more studies are generally available for African populations than for those in other regions. The results from research studies with good service delivery and adherence and may not reflect the impact that will be achieved when implemented nationally. The new procedures to estimate uncertainty rely on expert judgment and the variation found within available studies and surveys. This may underestimate the uncertainty caused by applying these assumptions to other regions.
CONCLUSIONS
Spectrum is one of a package of tools that has been developed to estimate the impact of the AIDS epidemic at the national level. It continues to be updated to incorporate the latest research findings and provide indicators needed for programme planning. Recent updates of the progression from infection to death in the absence of treatment have benefited from the experience of long-running cohort studies and newer treatment cohorts have provided valuable data on the effects of ART on survival. These updates allow analysts from national programmes to estimate their needs in order to achieve national goals for prevention and treatment.
Key messages
The Spectrum software is used to calculate HIV indicators of interest on the basis of previously prepared prevalence estimates. In the last two years new calculations and assumptions have been added in order to incorporate the latest data and respond to the international commitment for expanded treatment for adults and children.
REFERENCES
Footnotes
Funding: The Spectrum software, manuals and training materials have been developed with funding from USAID. UNAIDS supported some modifications to add additional indicators of interest to national programmes.
Competing interests: None.
Contributors: All authors reviewed the final manuscript. JS was primarily responsible for the introduction and the sections on uncertainty, strengths and weaknesses. Each of the other authors contributed a section of the paper: PJ on non-AIDS mortality by single age, BZ on progression from infection to death without treatment, MZ on time to eligibility for treatment, FD on effects of ART on survival and RE on mother-to-child transmission.