Article Text

Abstract
Objective We previously developed a flexible specification of the UNAIDS Estimation and Projection Package (EPP) that relied on splines to generate time-varying values for the force of infection parameter. Here, we test the feasibility of this approach for concentrated HIV/AIDS epidemics with very sparse data and compare two methods for making short-term future projections with the spline-based model.
Methods Penalised B-splines are used to model the average infection risk over time within the EPP 2011 modelling framework, which includes antiretroviral treatment effects and CD4 cell count progression, and is fit to sentinel surveillance prevalence data with a Bayesian algorithm. We compare two approaches for future projections: (1) an informative prior related to equilibrium prevalence and (2) a random walk formulation.
Results The spline-based model produced plausible fits across a range of epidemics, which included 87 subpopulations from 14 countries with concentrated epidemics and 75 subpopulations from 33 countries with generalised epidemics. The equilibrium prior and random walk approaches to future projections yielded similar prevalence estimates, and both performed well in tests of out-of-sample predictive validity for prevalence. In contrast, in some cases the two approaches varied substantially in estimates of incidence, with the random walk formulation avoiding extreme changes in incidence.
Conclusions A spline-based approach to allowing the force of infection parameter to vary over time within EPP 2011 is robust across a diverse array of epidemics, including concentrated ones with limited surveillance data. Future work on the EPP model should consider the impact that different modelling approaches have on estimates of HIV incidence.
- HIV
- Surveillance
- Mathematical Model
This is an open-access article distributed under the terms of the Creative Commons Attribution Non-commercial License, which permits use, distribution, and reproduction in any medium, provided the original work is properly cited, the use is non commercial and is otherwise in compliance with the license. See: http://creativecommons.org/licenses/by-nc/3.0/ and http://creativecommons.org/licenses/by-nc/3.0/legalcode
Statistics from Altmetric.com
Introduction
UNAIDS, working with country analysts, currently uses the Estimation and Projection Package (EPP) to estimate and predict trends in HIV incidence, prevalence and mortality.1 ,2 EPP incorporates a simple transmission model to generate a range of different epidemic curves, fitted to sentinel surveillance and national population-based survey data on HIV prevalence.3 Previous versions of the EPP transmission model produced highly plausible fits for a diverse array of epidemics but have had difficulty reproducing patterns in countries such as Uganda where HIV prevalence appears to be increasing after a long period of declining prevalence. To address this, a more flexible model that allows the force of infection parameter (r) to change over time has been implemented in the most recent version of EPP (EPP 2011),1 ,4 drawing on past proposals.5 ,6 This increased flexibility can improve model fits, but could be problematic in settings with limited data and may require additional constraints to obtain plausible curves. Examination of the model has so far focused primarily on generalised epidemics, whereas its performance in settings with sparse data, such as concentrated epidemics, has not yet been established.
In this paper, we extend our previous work6 on a spline-based approach to modelling trends for r, implementing it within the framework of the EPP 2011 model, and applying the model to concentrated epidemics with limited surveillance data. We also compare two alternatives for projecting HIV epidemics beyond the last year with surveillance data using the spline-based model, with the aim of improving understanding of how different modelling approaches for extrapolating beyond the period of observation can produce divergent short-term predictions of prevalence and incidence derived from epidemic models such as EPP 2011.
Methods
Data
We fit models to sentinel surveillance time series data on prevalence, as is typically done by UNAIDS when estimating epidemic trajectories.7 ,8 In generalised epidemics such as those in sub-Saharan Africa, these data come from antenatal clinics, typically stratified on urban versus rural populations. In settings with concentrated epidemics, data are specific to subpopulations, such as intravenous drug users, commercial sex workers, and men-who-have-sex-with-men. We tested the model with data from 75 subpopulations from 33 countries with generalised epidemics and 87 subpopulations from 14 countries with concentrated epidemics. Antiretroviral therapy coverage was included, defined either in terms of absolute numbers on treatment or a percentage of those in need. We note that these surveillance data, which were obtained from UNAIDS, are intended in this study to enable illustrative model projections, but these results will not necessarily be directly comparable to official estimates regularly published by countries and UNAIDS due to their final decisions about data inclusion criteria.
Epidemiological model
As described elsewhere in this supplement, EPP 2011 contains a flexible modelling option that allows the force of infection parameter r to change over time, which is currently achieved with a random walk formulation that draws new values for r annually.1 ,4 We used the same general modelling framework here but employed splines to generate smooth curves for r.6 ,9 More specifically, we used a Bayesian analogue to B-splines in which we penalised changes in the slope of r with a second degree difference penalty, formulated as prior distributions around changes in adjacent spline coefficients (βi), expressed as: βi=βi−1+(βi−1−βi−2)+ui 6 ,10 By letting ui ∼ normal(0,τ2), the amount of smoothness is determined by the variance parameter τ2, which must also be estimated, and we assumed τ2∼ inverse-gamma (0.001,0.001).6 ,10 As in our previous proposal, the spline was comprised of seven evenly spaced basis functions, which resulted in nine unknown parameters to estimate, namely seven spline coefficients, τ2, and the initial pulse of infection to seed the epidemic.6 Models were fit via incremental mixture importance sampling (IMIS).11 Results were not calibrated to national population-based surveys to facilitate visual inspection of model fits to prevalence trends implied by sentinel surveillance data. However, calibration to national population-based surveys can be conducted in the same manner as it currently is for the models implemented in EPP, without loss of generality of the present conclusions.7
Future projections
Short-term projections beyond the last year with surveillance data are important outputs from EPP. To facilitate these projections, the spline-based model presented previously,6 as well as the current flexible model implemented in EPP,4 incorporate a prior distribution for values of r beyond the last year of data that directs the model towards an equilibrium value for prevalence, referred to here as the ‘equilibrium prior’. This prior is derived from the mathematical theory of infectious disease dynamics.12 Briefly, if I is the proportion of the population infected with HIV and S is the proportion uninfected, with infection rate r and death rate μ, the change in the infected population is given by dI/dt=rIS−μI. At later stages in an epidemic, we expect prevalence to approach equilibrium, all else being equal. Under this formulation, dI/dt=0 when r=μ/S, which we approximate as r≈1/(1−prevalence)×1/mean survivorship. The equilibrium prior uses this value for r as the mean of a normally distributed prior distribution for r when making future projections.6
In a limited number of cases, the spline-based model that employs this prior yields rapidly changing patterns of incidence when predicting epidemic behaviour beyond the data. To better understand the impact that assumptions about future behaviour of r has on epidemic projections, we explored an alternative approach to making future predictions within the spline-based modelling framework that used a random walk formulation, which imposes very little prior information on future trajectories for the epidemic.4 ,5 We implemented this approach by first fitting the spline-based model, including the informative equilibrium prior for r, to the full projection period (eg, to 2015). We then truncate this set of posterior projections at the last year of data, and then for each posterior draw, re-project beyond the last year of data by modelling changes in r with a random walk. For the random walk, we modelled future changes in log(r) at 1/10 year time increments (instead of 1 year increments as in5) by drawing from normal distributions to determine new values for r at each time step (ie, log(rt+1)∼N(log(rt), σ2)), using an empirical variance term (σ2) calculated as the mean of the squared differences in adjacent values for r during the in-sample projection period. We allowed the variance of the random walk to increase proportionally with time since the last year with observed data, modelled as σ2t=σ2t1(t−tl) where t1 is the last year with observed data, so that variability increases with the duration of the prediction.
We assessed the performance of the equilibrium prior and the random walk approaches to future projections by fitting the model to a subset of the data truncated at 5 years before the last year with surveillance data, and computing model predictions for the 5 truncated years. Based on these out-of-sample predictions, we calculated the coverage and width of clinic-specific prediction intervals, and the mean absolute error (MAE) of observed clinic prevalence versus the posterior median of predicted prevalence.4 These prediction intervals were simulated from a random effects probit model for prevalence using rejection sampling.13 Coverage of the prediction intervals for an epidemic was calculated as the proportion of all clinic-level prevalence data that fell within the 95% prediction intervals. Thus, ideally a model would have 95% coverage, with narrow prediction intervals and a low MAE. We only conducted these tests for generalised epidemics, as concentrated epidemics typically lacked enough data to allow for model fitting after data truncation. Equatorial Guinea, Liberia and Sierra Leone were also excluded due to lack of data.
Results
In-sample projections
Within the EPP 2011 modelling framework, we fit the original spline-based model that uses an equilibrium prior for future projections6 and the alternative spline-based model that employs a random walk for r when making future predictions to antenatal clinic time series for prevalence for the following countries with generalised epidemics: Angola, Benin, Botswana, Burkina Faso, Burundi, Cameroun, Central African Republic, Chad, Congo, Cote d'Ivoire, Democratic Republic of Congo, Eritrea, Ethiopia, Gabon, Gambia, Ghana, Equatorial Guinea, Kenya, Lesotho, Liberia, Malawi, Mali, Namibia, Nigeria, Rwanda, Sierra Leone, South Africa, Swaziland, Tanzania, Togo, Uganda, Zambia and Zimbabwe. We modelled separate epidemics for urban and rural regions in these countries, with the exception of South Africa, which was divided into nine geographic regions, and Swaziland, which was divided into four geographic regions. The spline-based model produced plausible prevalence projections across these generalised epidemics (online appendix figure A).
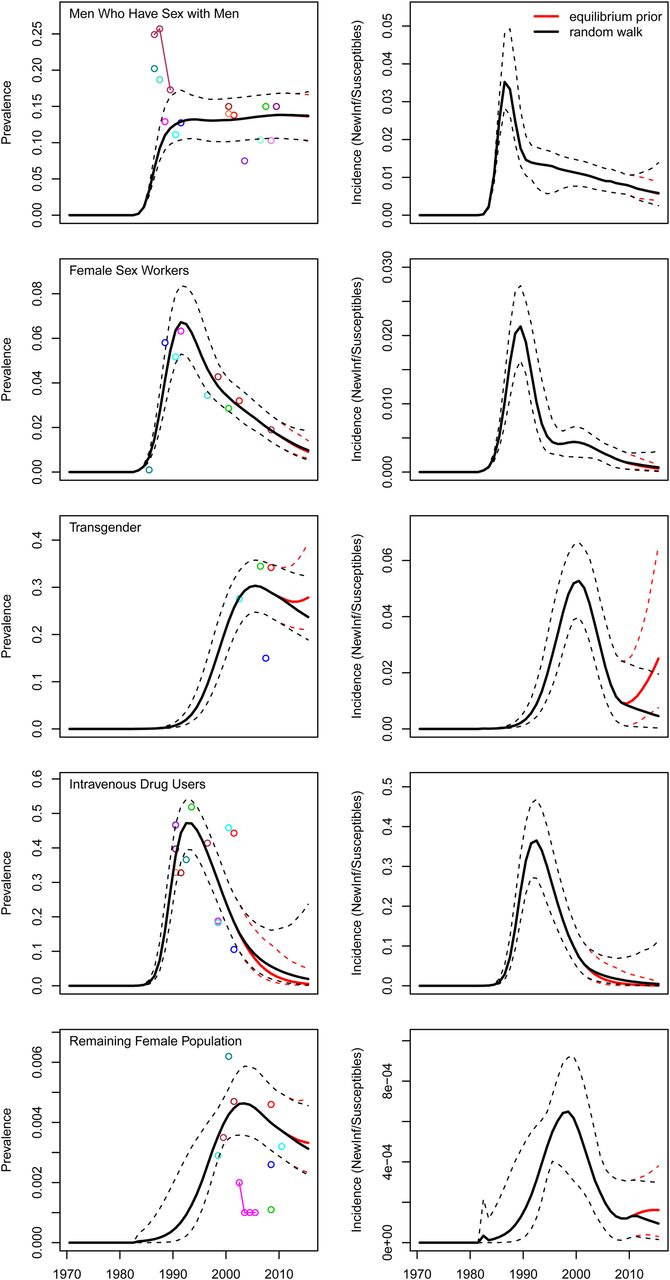
We also fit the spline-based model to specific risk groups in concentrated epidemics from the following countries: Argentina, Armenia, Brazil, Iran, Jamaica, Kazakhstan, Mexico, Moldova, Myanmar, Nepal, Nicaragua, Pakistan, Ukraine and Uruguay, for a total of 87 subepidemics. Despite very sparse surveillance data in many of these settings, the spline-based model generated plausible projections across this diverse set of epidemics, with the exception of the general population of Pakistan, which has extremely low prevalence (online appendix figure B). Illustrative examples of projections for prevalence are presented in figure 1 for Argentina.

Prevalence and incidence projections for specific risk groups in Argentina, as generated from spline-based force of infection models. ‘Equilibrium prior’ projections use an informative prior for r to make out-of-sample projections, whereas ‘Random walk’ projections impose minimal structure on future values for r. The data used in this analysis are meant to allow for illustrative model projections, and therefore our results should not be interpreted as being directly comparable to official estimates regularly published by countries and UNAIDS.
Future projections
In formal out-of-sample prediction tests for generalised epidemics, which involved simulating the posterior predicted distribution of site-level prevalence data, the equilibrium prior (coverage=83%, prediction interval width=0.090, MAE=0.020) and random walk (coverage=82%, prediction interval width=0.086, MAE=0.021) approaches had similar performance. These same statistics as calculated for the urban epidemics of Botswana, Ethiopia, Gabon, Ghana, Kenya, Namibia, Rwanda, Tanzania, Uganda and Zambia (equilibrium prior: coverage=83%, prediction interval width=0.07, MAE=0.019 and random walk: equilibrium prior: coverage=82%, prediction interval width=0.07, MAE=0.019) compare favourably to those for current EPP models as described elsewhere in this supplement.4 Despite the similarities in summary statistics, the two approaches did differ at the country level, for example with different levels of coverage in several countries such as Lesotho, Mali and Zimbabwe (figure 2).

Average coverage of site-level 95% prediction intervals for final year of out-of-sample projections in 69 generalised epidemics, comparing two approaches to making future projections from a spline-based force of infection model: (1) an informative prior related to equilibrium prevalence and (2) a random walk formulation. When the two methods have different coverage for a given subepidemic, they are connected with a vertical line.
The equilibrium prior and random walk approaches to making future projections yielded similar estimates for prevalence but were more variable in terms of their predictions for incidence. In particular, the equilibrium prior could predict rapid changes in incidence in some settings, unlike the random walk approach (figure 3). At the end of the 5-year period used for out-of-sample projection tests for generalised epidemics, the ratios of projected prevalence from the random walk as compared to the equilibrium prior ranged from 0.81 to 1.21, whereas the ratios of projected incidence ranged from 0.12 to 2.23 (figure 4). Overall, neither approach projected higher values of prevalence and incidence as compared to the other (median ratios of prevalence and incidence both=1).

Prevalence, incidence and force of infection parameter (r) projections for two generalised epidemics in sub-Saharan Africa, as generated from spline-based force of infection models. ‘Equilibrium prior’ projections use an informative prior for r to make out-of-sample projections, whereas ‘Random walk’ projections impose minimal structure on future values for r. The data used in this analysis are meant to allow for illustrative model projections, and therefore our results should not be interpreted as being directly comparable to official estimates regularly published by countries and UNAIDS.

Ratios of projected incidence and prevalence for final year of out-of-sample projections in 69 generalised epidemics, comparing the random walk (numerator of ratio) to equilibrium prior (denominator of ratio) approaches to making future projections with a spline-based force of infection model.
Computational performance
We measured computational efficiency of the spline-based EPP model by counting the number of likelihood calculations that were required to obtain convergence of the IMIS algorithm, as likelihood calculation is the rate-limiting step in the fitting procedure. We focused on the 75 generalised subepidemics, as concentrated epidemics typically require less computing time due to their sparse data. The median number of likelihoods was approximately 33 000, although a few epidemics required over 100 000 likelihoods to be calculated, namely urban regions of Kenya, Namibia, Nigeria and Uganda.
The length of the projection period beyond the last year of observed data could affect in-sample fit as, for example, the spacing of the basis splines within the function used to generate curves for r is dependent on the length of projection period. We explored this possibility by re-estimating models for all 75 generalised epidemics using a projection period of 1975 to 2012 instead of 1975 to 2015. The mean absolute difference in estimated prevalence for the last year with data in each epidemic was 0.001 when comparing prevalence estimated from models fit to 2012 versus 2015, suggesting that this is not an important issue in practice.
Discussion
A spline-based force of infection model implemented within the EPP 2011 framework generated robust in-sample prevalence and incidence projections across 162 epidemics. Of particular note, approximately half of these were concentrated epidemics, which have sparse data and have been difficult to fit with other flexible modelling specifications. Two approaches to making future projections beyond the last year with surveillance data were more likely to differ in their projections of incidence than their projections of prevalence, and both of these approaches performed well in formal out-of-sample prediction tests for prevalence. From a computational standpoint, these spline-based models should perform at least as efficiently as the current flexible model implemented in EPP 2011, as they have fewer parameters to estimate. This is an important consideration for end-users of the software who desire reasonable computing times when making projections.
An important observation from this study is that future projections of incidence, which are increasingly being used in reports on the global HIV/AIDS epidemic,2 are likely to have greater model uncertainty than future projections of prevalence. Uncertainty intervals around estimates and projections typically reflect parameter estimation uncertainty but not uncertainty about aspects of model structure and process, and the approach to extrapolating beyond the last observed data point is an example of the latter. The two approaches we compared for making short-term projections may be regarded as two extreme cases in terms of the amount of prior information that is incorporated into future projections. The approach using equilibrium prior makes strong assumptions about future patterns for r (and therefore incidence), whereas the random walk implies that we have virtually zero information about future epidemic behaviour. The rapid changes in incidence seen in a subset of countries when using the equilibrium prior occurs when the value for r at the end of the in-sample projection period differs substantially from the value for r implied by the equilibrium prior. Given the increasing importance of obtaining incidence projections from EPP, the random walk approach to future projections may in some cases provide more plausible predictions than the use of a strong equilibrium prior. On the other hand, if the random walk underestimates the degree to which future trends relate to recent past trends or incidence is not stabilising, the best prediction may fall between those yielded by the two alternative approaches. On average, neither approach consistently predicted higher values for incidence or prevalence than the other.
Using a spline-based model for in-sample fit, combined with a random walk for out-of-sample projections, can be viewed as a hybrid implementation of previous proposals.5 ,6 The use of the spline for in-sample fit, as opposed to a random walk as implemented in EPP 2011,4 has the advantages of requiring fewer parameters to estimate, generating well-behaved curves for r, and producing smooth ‘best fit’ curves for r, incidence and prevalence. The use of the random walk for out-of-sample projections, as opposed to equilibrium prior or a spline with no prior, offers a more conservative approach to projecting short-term future incidence. In combining strengths of the spline-based and random walk models, the ‘hybrid’ approach appears to perform better than either EPP classic or flexible model implemented in EPP 2011 in formal out-of-sample projection tests.4
The models considered here are not without limitations. Modelling the force of infection parameter with splines only can lead to unstable projections at the data boundary, requiring either a prior for r beyond the data, or the use of something like a random walk for making future projections. We also had trouble fitting the epidemic curve for the general population of Pakistan, although it is unclear if a simple susceptible-infected transmission model is appropriate for subpopulations with prevalence below 1 in 1000, as infection may be entering from contact with other subpopulations with concentrated epidemics.
In conclusion, an approach that uses splines to generate in-sample curves for r and a random walk formulation for future projections beyond the last year with surveillance data may be a promising model for consideration within future versions of EPP. However, it should be recognised that while development of the EPP model has focused on improving model projections for HIV prevalence, HIV incidence is increasingly being used as a key indicator of epidemic behaviour and for assessing the successfulness of national responses to HIV/AIDS.2 ,8 Future work on the EPP model should therefore consider the impact that modelling assumptions have on projections of HIV incidence, and methods for validating these incidence projections and understanding the uncertainty that surrounds them could be important inputs to the future refinement of EPP.
Key messages
-
Splines can generate well-behaved, flexible curves that can be used to allow model parameters to change value over time.
-
Modelling the force of infection parameter with splines may help improve the efficiency and accuracy of EPP projections.
-
Future work on the EPP model should consider the impact that different modelling approaches have on estimates of HIV incidence.
Acknowledgments
We thank Tim Brown for sharing Java code and documentation for the transmission model implemented in the 2011 version of the Estimation and Projection Package, Karen Stanecki, Juliana Daher, and Paloma Cuchi for assistance with surveillance data, and Le Bao and Adrian Raftery for methodological discussions.
References
Supplementary materials
Supplementary Data
This web only file has been produced by the BMJ Publishing Group from an electronic file supplied by the author(s) and has not been edited for content.
Files in this Data Supplement:
- Data supplement 1 - Online appendix
- Data supplement 2 - Online appendix
Footnotes
-
Contributors DRH designed the study, acquired the data, programmed the model, conducted analyses and wrote the first draft of the manuscript. JAS contributed to development of the model, interpretation of results and revision of the manuscript.
-
Funding This work was supported in part by the Joint United Nations Programme on HIV/AIDS.
-
Competing interests None.
-
Provenance and peer review Commissioned; externally peer reviewed.
-
Data sharing statement Readers interested in HIV surveillance data should contact UNAIDS.
Open Access This is an Open Access article distributed in accordance with the Creative Commons Attribution Non Commercial (CC BY-NC 3.0) license, which permits others to distribute, remix, adapt, build upon this work non-commercially, and license their derivative works on different terms, provided the original work is properly cited and the use is non-commercial. See: http://creativecommons.org/licenses/by-nc/3.0/