Article Text

Abstract
Objectives: Pre-exposure prophylaxis (PrEP) use may influence sexual behaviour and transmission of STIs among men who have sex with men (MSM). We aimed to quantify the distribution of STI diagnoses among MSM in the Netherlands based on their sexual behaviour before and after the introduction of PrEP.
Methods: HIV-negative MSM participating in a prospective cohort study (Amsterdam Cohort Studies) completed questionnaires about sexual behaviour and were tested for STI/HIV during biannual visits (2009–2019). We developed a sexual behaviour risk score predictive of STI diagnosis and used it to calculate Gini coefficients for gonorrhoea, chlamydia and syphilis diagnoses in the period before (2009 to mid-2015) and after PrEP (mid-2015 to 2019). Gini coefficients close to zero indicate that STI diagnoses are homogeneously distributed over the population, and close to one indicate that STI diagnoses are concentrated in individuals with a higher risk score.
Results: The sexual behaviour risk score (n=630, n visits=10 677) ranged between 0.00 (low risk) and 3.61 (high risk), and the mean risk score increased from 0.70 (SD=0.66) before to 0.93 (SD=0.80) after PrEP. Positivity rates for chlamydia (4%) and syphilis (1%) remained relatively stable, but the positivity rate for gonorrhoea increased from 4% before to 6% after PrEP. Gini coefficients increased from 0.37 (95% CI 0.30 to 0.43) to 0.43 (95% CI 0.36 to 0.49) for chlamydia, and from 0.37 (95% CI 0.19 to 0.52) to 0.50 (95% CI 0.32 to 0.66) for syphilis comparing before to after PrEP. The Gini coefficient for gonorrhoea remained stable at 0.46 (95% CI 0.40 to 0.52) before and after PrEP.
Conclusions: MSM engaged in more high-risk sexual behaviour and gonorrhoea diagnoses increased after PrEP was introduced. Chlamydia and syphilis diagnoses have become more concentrated in a high-risk subgroup. Monitoring the impact of increasing PrEP coverage on sexual behaviour and STI incidence is important. Improved STI prevention is needed, especially for high-risk MSM.
- sexual behaviour
- pre-exposure prophylaxis
- chlamydia infections
- gonorrhoea
- syphilis
Data availability statement
All data relevant to the study are included in the article or uploaded as supplemental information. Not applicable.
Statistics from Altmetric.com
Introduction
Despite widespread implementation of interventions aimed at reducing HIV transmission, such as condom use, regular testing and treatment with antiretroviral therapy (ART) as prevention (eg, undetectable=untransmittable (U=U)),1 2 HIV transmission continues. Globally, around 1.7 million people were newly diagnosed with HIV in 2019, and risk of acquiring HIV is higher in men who have sex with men (MSM).3 4 Recently, pre-exposure prophylaxis (PrEP) has become available, which is a highly effective intervention to prevent HIV infection.5 6 In the Netherlands, PrEP use and intention to use PrEP have increased over the past years and are expected to keep increasing in the future.7 8
HIV incidence in the population may decrease significantly due to PrEP,5 6 but the impact of PrEP on the transmission of other STIs, such as chlamydia, gonorrhoea and syphilis, is unclear. Previous studies showed that condomless anal intercourse increased among MSM after PrEP initiation,9 10 which may increase STI risk. Furthermore, sexual behaviour trends before PrEP were already moving towards higher risk.11 12 Since PrEP is available for MSM at high risk of acquiring HIV based on their behaviour, it is likely that PrEP users are disproportionally affected by STI as well (ie, STI positivity rates are usually higher in this high risk group compared with lower risk groups).
Here, we aimed to quantify how STI diagnoses are distributed among MSM in the Netherlands based on their sexual behaviour, using longitudinal data from the Amsterdam Cohort Studies (ACS).13 In economics, measuring disparity in distributions (ie, inequalities in income distribution) is often done using the Gini coefficient computed from a Lorenz curve.14 Since these inequalities have been shown to exist in the distribution of STI/HIV diagnoses,15–17 we used these disparity measures to examine the distribution of chlamydia, gonorrhoea and syphilis diagnoses across sexual behaviour risk strata in the MSM population. Furthermore, as risk behaviour and STI diagnoses may increase as a result of PrEP, these measures could be useful to quantify the impact of PrEP on changes in sexual behaviour and STI distribution in the MSM population. Therefore, we examined possible changes in sexual behaviour and Gini coefficients over time under the influence of PrEP and PrEP-related STI screening.
Methods
Data
The ACS is an open and ongoing prospective cohort study on sexual behaviour, psychosocial characteristics, course of infection and pathogenesis of HIV among MSM in Amsterdam.13 Men are eligible to participate if they live in or around Amsterdam and had sex with other men in the past 6 months. MSM were included in the present study if they visited the ACS at least once between January 2009 and December 2019, and if they were HIV negative at their first visit during this period. Follow-up ended after the last ACS visit in the study period, HIV seroconversion or death.
ACS participants completed questionnaires about their sexual behaviour in the preceding 6 months and were tested for STI/HIV, including urogenital, anal and pharyngeal testing for gonorrhoea and chlamydia, and syphilis testing, at the Public Health Service of Amsterdam every 6 months. We calculated positivity rates, defined as the percentage of all visits with an STI diagnosis for gonorrhoea, chlamydia and syphilis infections separately and for combinations of these diagnoses (STI).
Sexual behaviour risk score
Since sexual behaviour is more likely to change over time compared with other more stable predictors of STI diagnosis, such as demographic characteristics (eg, migration background and education level), only behavioural variables were included in the risk score. Data on sexual behaviour collected in the biannual questionnaires included number of casual partners, type of partnership (steady/casual), condomless insertive and/or receptive sex (yes/no), anal intercourse during group sex (yes/no) and chemsex (yes/no). Definitions of behavioural variables are provided in online supplemental text S1. With these variables, we developed a sexual behaviour risk score predictive of STI acquisition. We created a combined STI diagnosis variable, where STI diagnosis was defined as gonorrhoea, chlamydia and/or syphilis diagnoses at one or more anatomical locations (ie, any STI). Continuous behavioural variables that were not normally distributed were log-transformed. Missing data were, when possible, extrapolated from the next ACS visit of this unique individual (see online supplemental material, text S2, for a detailed description of dealing with missing data).
Supplemental material
We used univariable and multivariable logistic regression analyses to identify behavioural predictors of STI diagnosis. If behavioural variables were statistically significant in the univariable analyses (p<0.05), they were included in multivariable analysis. All variables that remained in the multivariable model were used to calculate the sexual behaviour risk score. The calculation of this risk score was based on previous work, which explored longitudinal trajectories of sexual behaviour.18 The risk score was calculated for each individual at each visit using the regression coefficients from the multivariable model. To assess the performance of the sexual behaviour risk score in predicting STI diagnosis, we calculated the area under the curve (AUC), with values >0.7 considered acceptable.19
Gini coefficients and Lorenz curves
We used the sexual behaviour risk score to study how STI are distributed in the MSM population using Lorenz curves. Gini coefficients and Lorenz curves were calculated and plotted similar to methods used in a previous study.15 A Lorenz curve is the cumulative proportion of visits with STI diagnosis plotted as a function of the proportion of all visits from lower to higher risk score. Gini coefficients are defined as the area between the line of equality (ie, the diagonal line), and the Lorenz curve is divided by the total area below the line of equality. Gini coefficients close to zero indicate homogeneous distribution of STI diagnoses over the population regardless of the sexual behaviour risk score, which is equal to the line of equality in the Lorenz curve. Gini coefficients close to one indicate that STI diagnoses are concentrated in parts of the population with higher sexual behaviour risk scores. We computed Lorenz curves and estimated Gini coefficients and 95% CIs for gonorrhoea, chlamydia and syphilis infections and for any STI (ie, chlamydia and/or gonorrhoea and/or syphilis diagnoses at the current visit), including all visits from 2009 to 2019. Furthermore, a Gini coefficient was computed for anal gonorrhoea and for any anal STI.
Introduction of PrEP
In the Netherlands, PrEP was made available by the government for eligible MSM in 2019, which includes HIV-negative MSM who either report to have had condomless anal intercourse with a male partner with unknown HIV status or with a known HIV-positive partner with detectable viral load, or at least one syphilis or anal STI diagnosis, or to have used postexposure prophylaxis in the past 6 months. However, some healthcare institutions had already been providing PrEP to MSM before 2019. For example, the Amsterdam Pre-Exposure Prophylaxis (AMPrEP) project is a prospective demonstration study that started in June 2015 and aimed to assess STI/HIV incidence and sexual behaviour among PrEP users in Amsterdam.9 As ACS participants were able to participate in this project, we used 31 May 2015 as a cut-off to compare Gini coefficients in a time period before PrEP (2009 to mid-2015) and after PrEP (mid-2015 to 2019).
MSM who had no ACS visit before PrEP or no visit after PrEP were excluded from this analysis. We also computed Gini coefficients and sexual behaviour risk scores per year (ie, for 2009–2019) to examine pre-existing trends in the distribution of STI diagnoses and sexual behaviour over time, irrespective of PrEP. Furthermore, sensitivity analyses were done excluding visits in the year 2019, because after 2019, no data were available to extrapolate for visits with missing data, which could possibly introduce bias. All statistical analyses were done using R V.3.6.1.20
Results
Study population
In total, data from 14 787 visits were available in the ACS dataset in the period between 2009 and 2019. For 2350 of these visits, behavioural variable values were missing, and values were extrapolated from the next ACS visit of the same person within the dataset (online supplemental figure S1), and 1269 visits were excluded because extrapolation was not possible (ie, no next ACS visit available). As expected, STI positivity rates and risk scores were higher in extrapolated and excluded visits (online supplemental material, text S2). Furthermore, 45 visits were excluded after HIV seroconversion (n=39, 4% of all MSM). Thus, 971 MSM with 13 473 ACS visits (91%) in the period between 2009 and 2019 were included in the final statistical analyses (online supplemental table S1 and figure S1). The majority of MSM was Dutch (69%) and highly educated (77%). The mean age at first visit was 35 years (SD 10 years), and the mean age at sexual debut with a man was 18 years (SD 4 years). PrEP use was reported by 232 MSM (24% of all participants) at 758 visits (5% of all visits), all after June 2015.
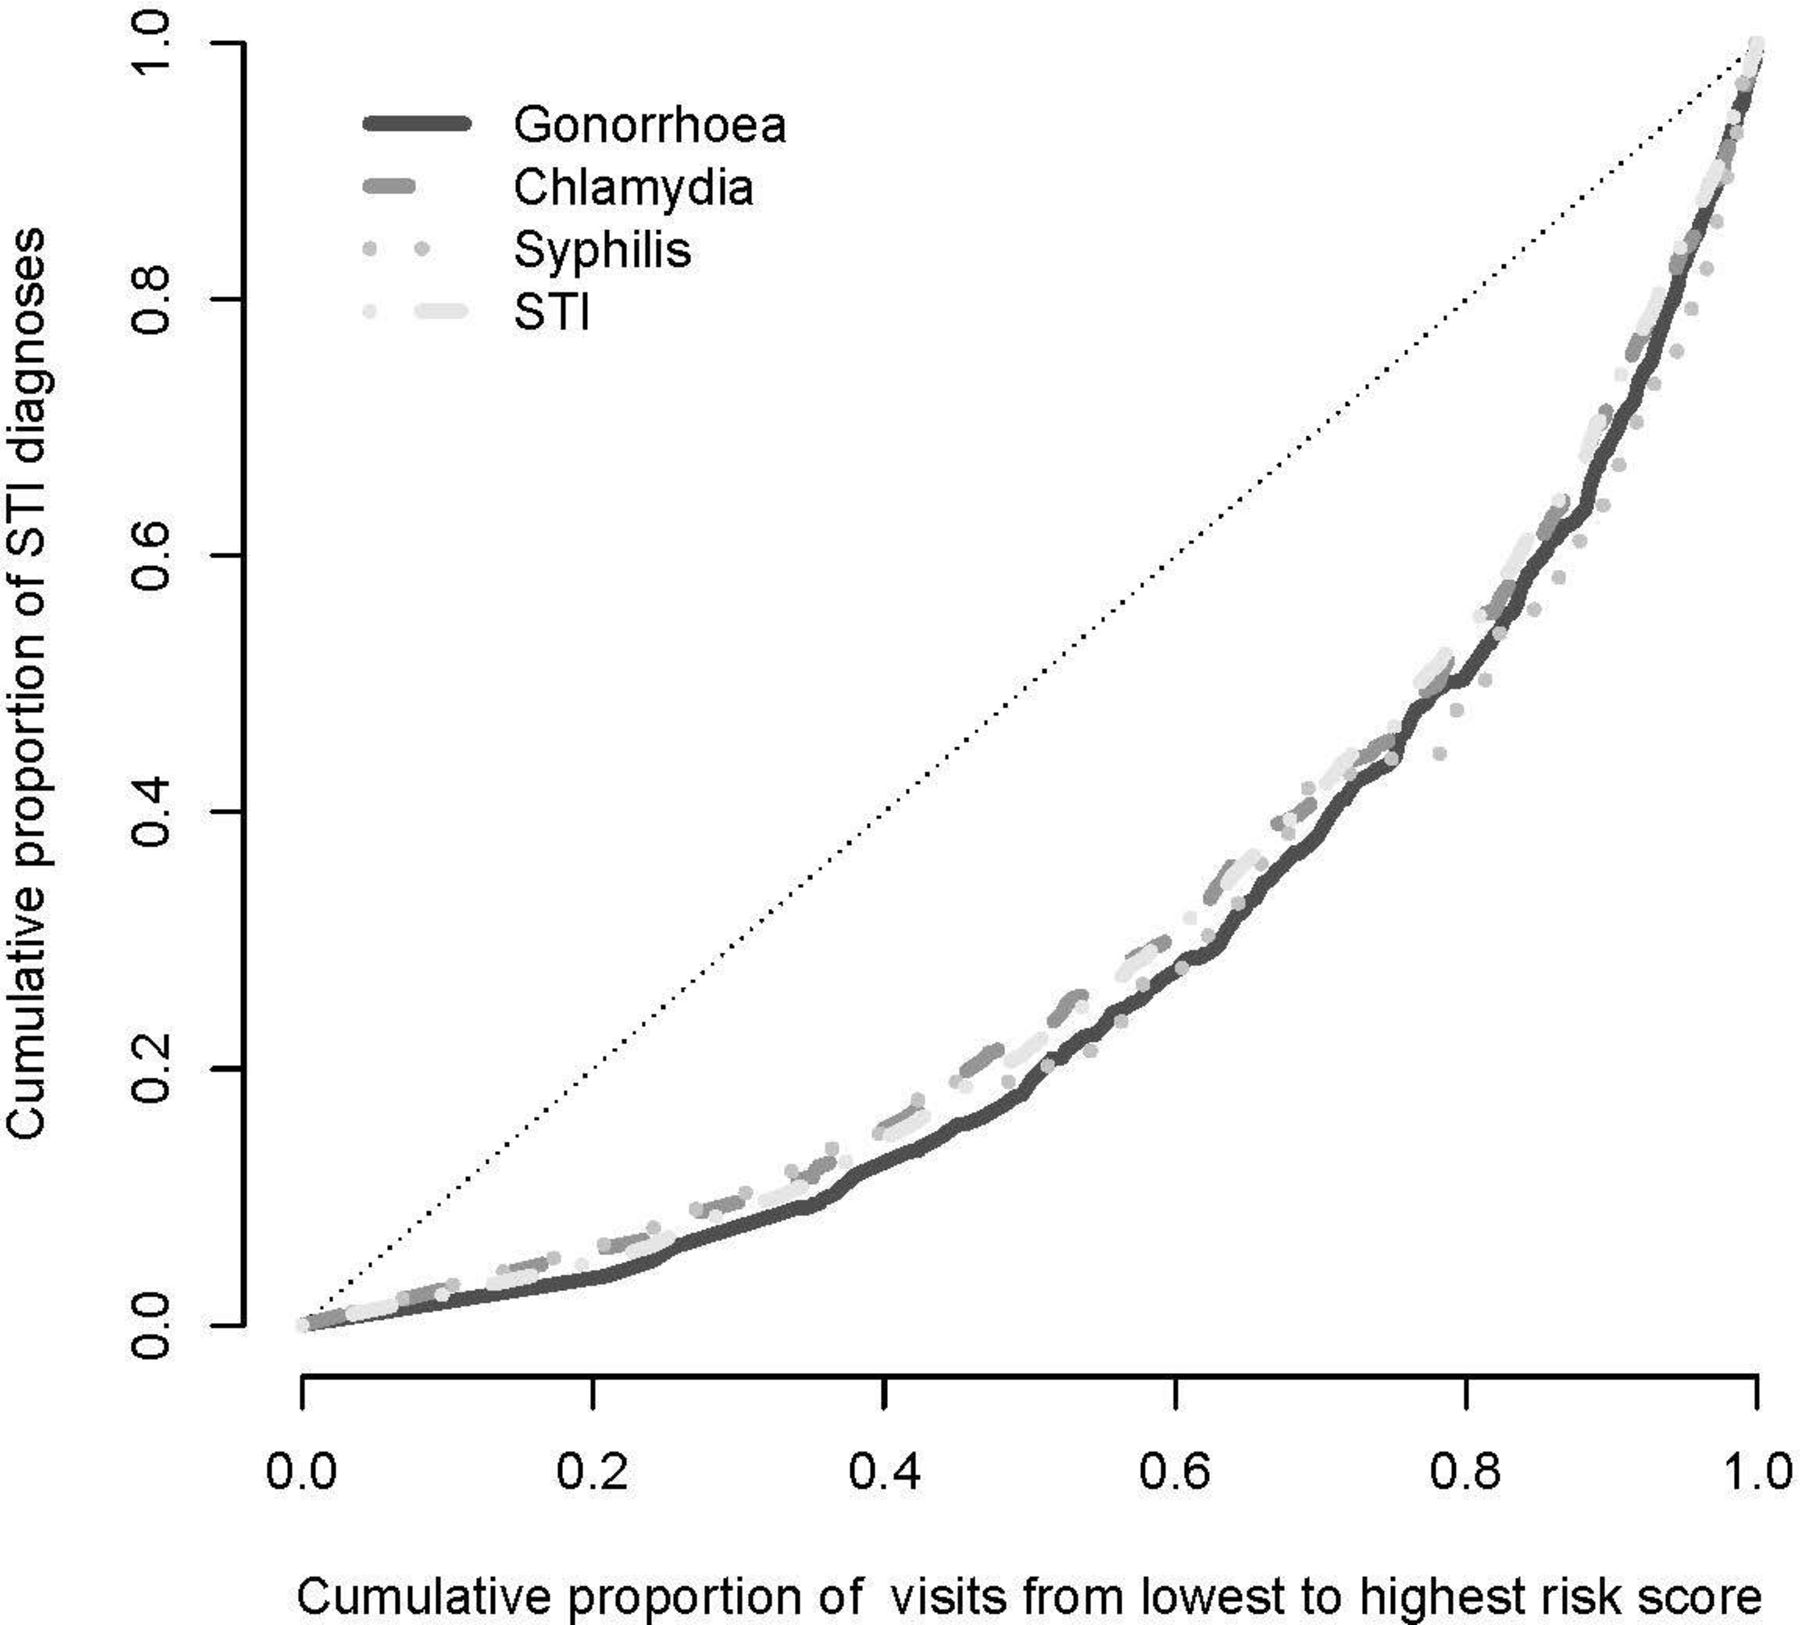
Lorenz curves representing the cumulative proportion of STI diagnoses among MSM participating in the ACS between 2009 and 2019 (n=959, n visits=12 274) as a function of the cumulative proportion of all visits from lowest to highest risk score. Curves are shown for any STI infection, and for gonorrhoea, chlamydia and syphilis separately. ACS, Amsterdam Cohort Studies. Created by the authors.
Sexual behaviour risk score
All behavioural variables were significant in the univariable logistic regression analyses (table 1) and were, thus, all included in the multivariable model. In the multivariable analysis, 959 MSM with 12 274 visits (83%) were included, after excluding 1199 visits with one or more missing values. Regression coefficients from the multivariable model were used to calculate the sexual behaviour risk score. The sexual behaviour risk score varied between 0.00 (lowest risk score) and 3.61 (highest risk score), and the mean risk score was 0.82 (SD=0.74). The risk score performed reasonably well for gonorrhoea (AUC=0.73), chlamydia (AUC=0.71) and syphilis (AUC=0.72) infections separately and for any STI (AUC=0.72). The mean risk score gradually increased over time, with a lowest mean risk score of 0.63 (SD=0.62) in 2009 and highest mean risk score of 1.01 (SD=0.81) in 2018 (online supplemental table S3). The mean risk score was higher at visits when PrEP use in the past 6 months was reported (mean=1.27, SD=0.70) compared with visits without recent PrEP use (mean=0.73, SD=0.57).
Logistic univariable and multivariable regression analysis of factors associated with STI acquisition among MSM participating in the Amsterdam Cohort Studies between 2009 and 2019
Lorenz curves and Gini coefficients for STI
Positivity rates (% positive of all 12 274 visits) for gonorrhoea (5.1%) and chlamydia (4.6%) were higher compared with the positivity rate for syphilis (0.7%) (online supplemental table S2). The Lorenz curves for gonorrhoea, chlamydia and syphilis infections separately and any STI were relatively similar (figure 1). The gonorrhoea curve is slightly further away from the diagonal line (ie, from the homogeneous distribution of STI diagnoses over the population regardless of the sexual behaviour risk score) compared with the curves for chlamydia, syphilis and the any STI variable, which indicates that the association between gonorrhoea and the sexual behaviour risk score may be stronger than for the other STI.
To increase interpretability of the Lorenz curve, we added a figure plotting STI positivity over different segments of the continuous risk score (figure 2, online supplemental figure S2), which showed that positivity rates increased along with the risk score. Gini coefficients for gonorrhoea at any location, anal gonorrhoea and anal STI were slightly higher than Gini coefficients for chlamydia, syphilis and any STI (table 2). These results indicate that (anal) gonorrhoea and anal STI were more concentrated in MSM with a higher sexual behaviour risk score.
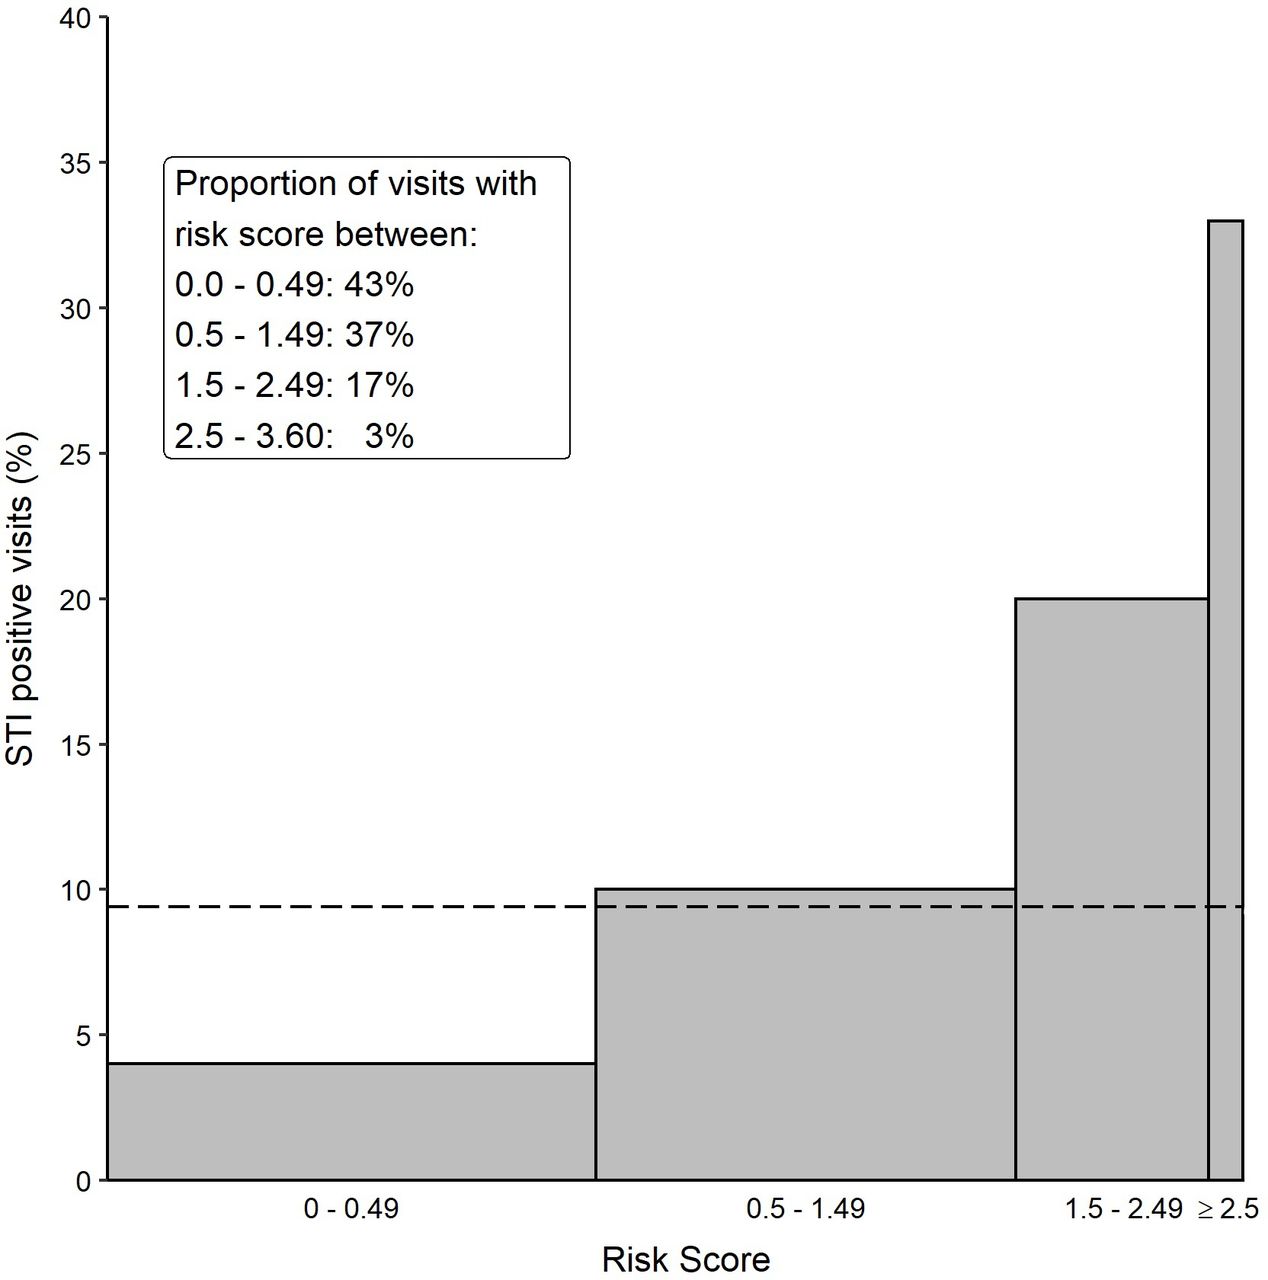
Distribution of STI diagnoses among MSM with different risk scores based on sexual behaviour among MSM participating in the ACS between 2009 and 2019 (n=959, n visits=12 274). The width of the bars represents the proportion of visits with a specific risk score (the legend shows the distribution of the risk score over the population), and the height of the bars indicates the percentage of STI diagnoses in each risk score segment. Overall, STI positivity is given by the dashed line. ACS, Amsterdam Cohort Studies; MSM, men who have sex with men. Created by the authors.
Mean risk scores, positivity rates, estimated Gini coefficients and corresponding 95% CIs for gonorrhoea, chlamydia and syphilis in MSM participating in the Amsterdam Cohort Studies between 2009 and 2019 (n=959, n visits=12 274)
Before and after PreP
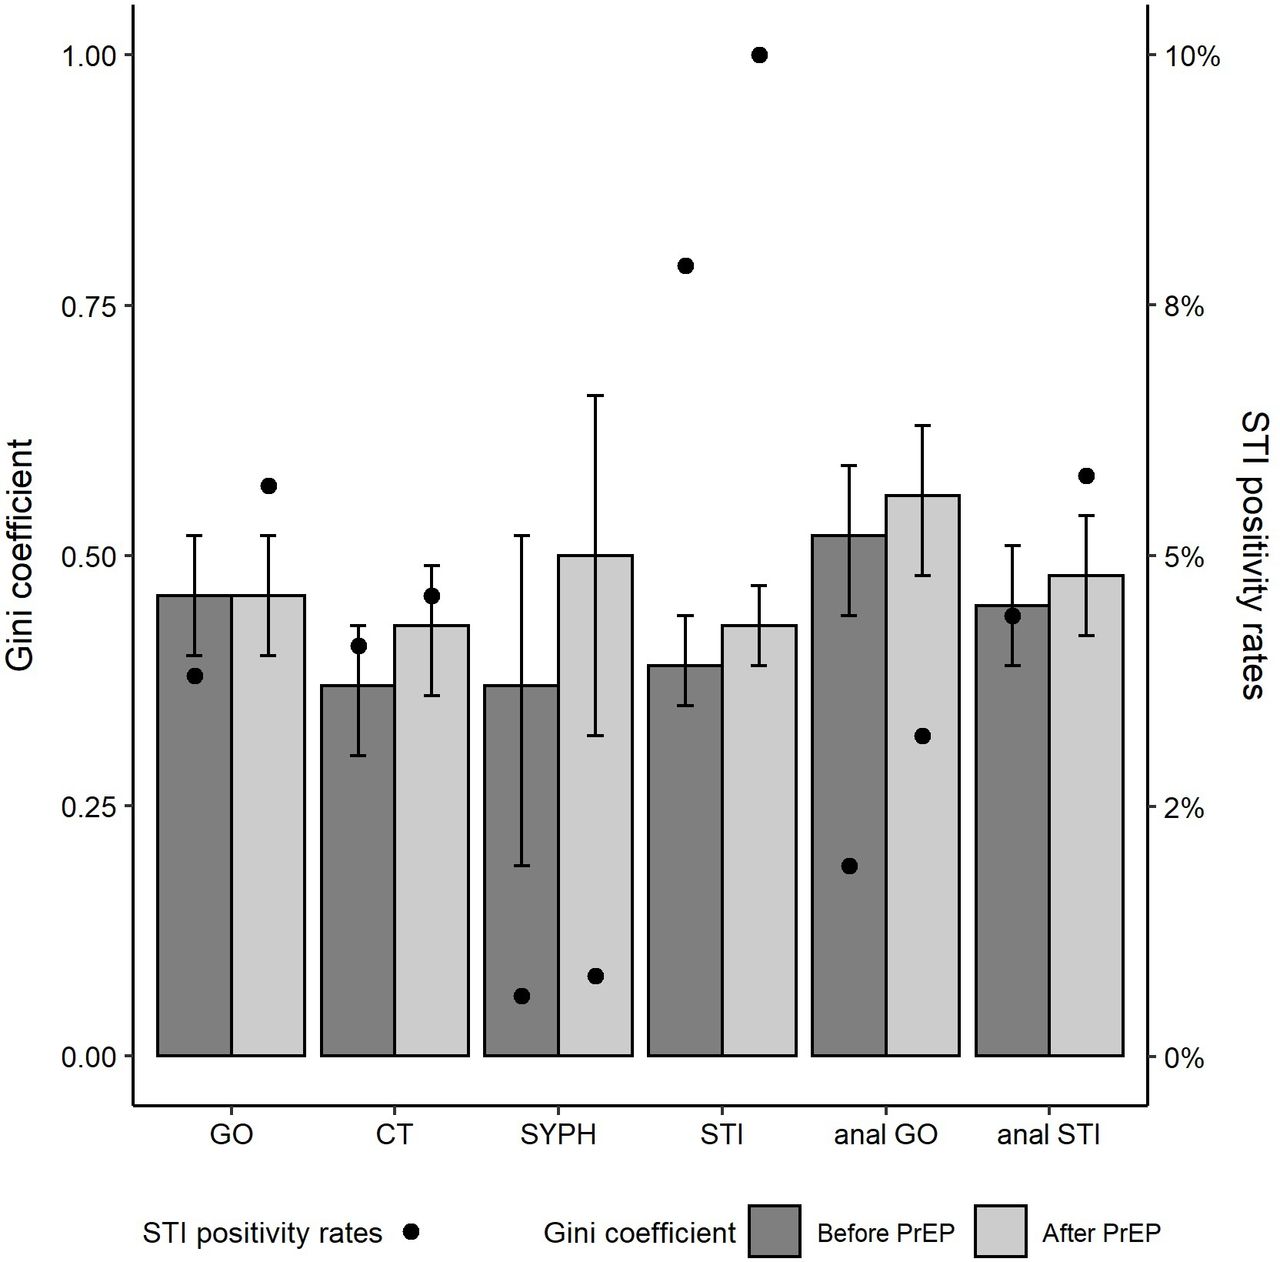
Gini coefficients were computed again for 630 MSM with 10 677 ACS visits (online supplemental figure S1, figure 3), who had ≥1 visit before and ≥1 visit after PrEP. Positivity rates for chlamydia and syphilis remained relatively stable before and after PrEP, but the positivity rate for (anal) gonorrhoea and (anal) STI was significantly increased after PrEP (figure 3, online supplemental table S2). Gini coefficients for chlamydia, syphilis, anal gonorrhoea and (anal) STI increased from before to after PrEP and were thus more concentrated in the population with a higher risk score (figure 3, online supplemental table S2). However, the Gini coefficient for gonorrhoea at all anatomical locations remained stable. When looking at the Gini coefficients for gonorrhoea and chlamydia at all anatomical locations per year (number of diagnoses for syphilis were too small to stratify per year), no clear increasing or decreasing trends were observed (online supplemental table S3). Sensitivity analyses excluding visits in 2019 showed that the Gini coefficients remained the same as in the computations with 2019 (data not shown).

Gini coefficients and STI positivity rates in MSM participating in the ACS before PrEP (n visits=5997, 56%) and after PrEP (n visits=4680, 44%) between 2009 and 2019 (n=630, n visits=10 677). Estimated Gini coefficients for gonorrhoea, chlamydia and syphilis, and STI, and the corresponding 95% CIs for these coefficients are shown on the left y-axis (bars). STI positivity rates before and after PrEP are shown on the right y-axis (black dots). ACS, Amsterdam Cohort Studies; CT, chlamydia; GO, gonorrhoea; MSM, men who have sex with men; PrEP, pre-exposure prophylaxis; SYPH, syphilis. Created by the authors.
Discussion
We found that the distribution of gonorrhoea diagnoses over the population according to a sexual behaviour risk score was more concentrated in a higher risk subpopulation, compared with chlamydia and syphilis diagnoses in 2009–2019. Furthermore, although the gonorrhoea positivity rate increased after the introduction of PrEP, the distribution of diagnoses over the population remained the same. In contrast, the positivity rates for chlamydia and syphilis were similar before and after the introduction of PrEP, but the distribution of diagnoses over the population became more concentrated in a higher risk subpopulation after 2015.
The increase in STI positivity rates observed after the introduction of PrEP may be explained by increased STI testing frequency among PrEP users (ie, the more you test, the more you find). However, whereas gonorrhoea positivity rates increased after PrEP, the distribution of gonorrhoea diagnoses over the population did not change, in contrast to chlamydia and syphilis. This might be explained by pre-existing inequalities in STI distribution before PrEP. Possibly, gonorrhoea was already more common among MSM with higher risk sexual behaviour before the introduction of PrEP, compared with chlamydia and syphilis, which has been found in the national STI surveillance data as well.7 However, Gini coefficients for all STIs and differences in coefficients between different STIs found in this study were small (ie, more homogeneous STI distribution in this study population irrespective of risk score). This may be explained by participant characteristics, because the ACS already includes a more high risk MSM subpopulation.
To our knowledge, this is the first study to examine how heterogeneity in sexual behaviour and STI distribution changed in the MSM population after the introduction of PrEP using Lorenz curves and Gini coefficients. A strength of this study is the large sample size and the availability of longitudinal data on sexual behaviour, PrEP use and STI/HIV diagnoses.
There were also a few limitations. First, ACS data might not be representative for the entire MSM population in the Netherlands, as participants are predominantly Dutch and highly educated. Nevertheless, these characteristics are similar to the MSM population visiting STI clinics in the Netherlands,7 which is a key population for PrEP use. Second, the number of syphilis diagnoses was low, which resulted in wide CIs for the estimated Gini coefficients. Last, for 17% of all visits behavioural data was extrapolated, which may have introduced bias. For example, STI positivity rates were higher at visits with extrapolated behavioural data. Nonetheless, as behavioural data at the next ACS visit is reported retrospectively (eg, number of partners in the past 6 months), the extrapolated data may still be a good reflection of the actual behaviour, which was supported by the higher risk scores in the extrapolated visits.
Our results suggested that gonorrhoea infections were more concentrated in a specific high-risk subpopulation of MSM compared with chlamydia distribution, which was found in previous studies among heterosexuals as well.17 21 Also, Gini coefficients for syphilis among MSM are likely to be lower (ie, more homogeneous distribution of infections) compared with the heterosexual population17 21 22 and may be more susceptible to changes over time compared with gonorrhoea.22 This was also found in our study, as the Gini coefficient for syphilis increased after the introduction of PrEP, whereas the Gini coefficient for gonorrhoea remained stable before and after PrEP.
We found that the sexual behaviour risk score and STI positivity rates increased over time. This was consistent with other studies exploring sexual behaviour and STI incidence in a similar time period.23–26 In addition, even when STI positivity rates did not increase after PrEP introduction in the total MSM population,11 27 there might be a specific group of high risk MSM (ie, PrEP users) in which STI positivity rates do increase. This was shown by the increased Gini coefficients for chlamydia and syphilis after PrEP in our study. Thus, a specific high-risk subgroup may view PrEP as the ultimate prevention measure and increase risk behaviour, whereas others may use PrEP as a prevention measure in addition to other measures (eg, condom use). It should be kept in mind that an increasing trend in risk behaviour and STI incidence was already observed before the introduction of PrEP in 2015.12 Therefore, it is not possible to conclude that changes after 2015 were a result of PrEP. Other developments in HIV prevention and treatment (ie, U=U) may have influenced sexual behaviour in the time period between 2009 and 2019 as well.28 Nonetheless, the results of this study underline the importance of closely monitoring sexual behaviour and STI diagnoses in both PrEP users and non-PrEP users during the national roll-out of the PrEP programme, which started in 2019.
The methods used in this study may be valuable for the monitoring of sexual behaviour and STI diagnoses in the national PrEP programme. We showed that even though STI positivity rates remained stable, STI diagnoses may become more concentrated in a high-risk subpopulation. The methodology of this study could also be applied to characterise populations in other settings/countries, including demographic and sexual health-related characteristics and subsequent STI distribution as well. Targeting interventions, such as increased frequency of STI testing, to a high-risk subpopulation may reduce STI transmission. However, more frequent STI testing and subsequent antibiotic treatment could also increase antimicrobial resistance,29 30 which has been rising for STI in the past years, especially for gonorrhoea.7 Therefore, interventions aimed at reducing sexual risk behaviour may be an important strategy as well. As Gini coefficients and Lorenz curves can be used as a quantitative indicator for the impact of interventions on population level,15 future research could use these measures to investigate the impact of varying PrEP coverage, testing and behavioural interventions on STI/HIV distribution in the population.
To conclude, high-risk sexual behaviour and gonorrhoea diagnoses increased after PrEP was introduced, and the distribution of chlamydia and syphilis diagnoses has become more concentrated in a high-risk subgroup. Monitoring the impact of increasing PrEP coverage on sexual behaviour and STI incidence is of great importance, and improved STI prevention is needed, especially for high-risk MSM.
Key messages
This study quantified the distribution of STI diagnoses among men who have sex with men (MSM) in the Netherlands based on their sexual behaviour before and after the introduction of pre-exposure prophylaxis (PrEP).
MSM engaged in more high-risk sexual behaviour and gonorrhoea diagnoses increased after PrEP was introduced.
Gonorrhoea diagnoses were concentrated in high risk MSM, and chlamydia and syphilis diagnoses have become more concentrated in a high-risk subgroup after PrEP .
Monitoring the impact of increasing PrEP coverage on behaviour and STI incidence is important, and improved STI prevention is needed, especially for high-risk MSM.
Abstract translation
This web only file has been produced by the BMJ Publishing Group from an electronic file supplied by the author(s) and has not been edited for content.Data availability statement
All data relevant to the study are included in the article or uploaded as supplemental information. Not applicable.
Ethics statements
Patient consent for publication
Ethics approval
The Amsterdam Cohort Studies was approved by the Medical Ethics Committee of the Academic Medical Centre, University of Amsterdam, Amsterdam, the Netherlands (MEC 07/182), and written informed consent is obtained from every participant at first visit.
Acknowledgments
The Amsterdam Cohort Studies on HIV infection, a collaboration between the Public Health Service of Amsterdam, the Amsterdam University Medical Centres location AMC, Sanquin Blood Supply Foundation, MC Jan van Goyen and DC Clinics Lairesse, are part of the Netherlands HIV Monitoring Foundation and financially supported by the Netherlands National Institute for Public Health and the Environment. The ACS gratefully acknowledge all the study participants for their cooperation and participation and research nurses for collecting the data (Samantha de Graaf and Leeann Storey). The authors would also like to thank Dominique Loomans, Ertan Ersan, Maartje Dijkstra, Liza Coyer and Ward van Bilsen for data management, and Maartje Basten for acquiring funding for the current project.
References
Supplementary materials
Supplementary Data
This web only file has been produced by the BMJ Publishing Group from an electronic file supplied by the author(s) and has not been edited for content.
Supplementary Data
This web only file has been produced by the BMJ Publishing Group from an electronic file supplied by the author(s) and has not been edited for content.
Footnotes
Handling editor Jane S Hocking
Contributors All authors contributed to the study concept. DAvW and SD analysed and interpreted the data. GR, AM, CdD, JH and MK supervised the overall study and provided substantial contributions to the interpretation of the data. DAvW wrote the first draft of the manuscript, and acted as guarantor for the work. All authors contributed to subsequent drafts and approved the final version of the article for submission.
Funding This project was funded by the Netherlands Organisation for Health Research and Development ZonMw grant 522 008 010.
Competing interests None declared.
Provenance and peer review Not commissioned; externally peer reviewed.
Supplemental material This content has been supplied by the author(s). It has not been vetted by BMJ Publishing Group Limited (BMJ) and may not have been peer-reviewed. Any opinions or recommendations discussed are solely those of the author(s) and are not endorsed by BMJ. BMJ disclaims all liability and responsibility arising from any reliance placed on the content. Where the content includes any translated material, BMJ does not warrant the accuracy and reliability of the translations (including but not limited to local regulations, clinical guidelines, terminology, drug names and drug dosages), and is not responsible for any error and/or omissions arising from translation and adaptation or otherwise.