Article Text

Abstract
Objectives General practitioners (GPs) and sexual health centres (SHCs) are the main providers of HIV testing and diagnose two-thirds of HIV infections in the Netherlands. We compared regional HIV testing and positivity by GPs versus SHCs to gain insight into strategies to improve HIV testing, to enable timely detection of HIV infections.
Methods Laboratory data (2011–2018) on HIV testing by GPs and SHCs in five Dutch regions with varying levels of urbanisation were evaluated. Regional HIV testing rates per 10 000 residents ≥15 years (mean over period and annual) were compared between providers using negative binomial generalised additive models and additionally stratified by sex and age (15–29 years, 30–44 years, 45–59 years, ≥60 years). χ2 tests were used to compare positivity percentage between the two groups of providers.
Results In the study period, 505 167 HIV tests (GP 36%, SHC 64%) were performed. The highest HIV testing rates were observed in highly urbanised regions, with large regional variations. The HIV testing rates ranged from 28 to 178 per 10 000 residents by GPs and from 30 to 378 per 10 000 by SHCs. Testing rates by GPs were lower than by SHCs in three regions and comparable in two. In all regions, men were tested less by GPs than by SHCs; for women, this varied by region. Among those aged 15–29 years old, GPs’ testing rates were lower than SHCs’, while this was reversed in older age categories in four out of five regions. The overall mean HIV positivity was 0.4%. In contrast to other regions, positivity in Amsterdam was significantly higher among individuals tested by GPs than by SHCs.
Conclusions This retrospective observational study shows that besides SHCs, who perform opt-out testing for key groups, GPs play a prominent role in HIV testing, especially in non-key populations, such as women and older individuals. Large regional variation exists, requiring region-specific interventions to improve GPs’ HIV testing practices.
- HIV
- primary health care
- general practice
- sexual health
- epidemiology
Data availability statement
All data relevant to the study are included in the article or uploaded as supplementary information.
This is an open access article distributed in accordance with the Creative Commons Attribution Non Commercial (CC BY-NC 4.0) license, which permits others to distribute, remix, adapt, build upon this work non-commercially, and license their derivative works on different terms, provided the original work is properly cited, appropriate credit is given, any changes made indicated, and the use is non-commercial. See: http://creativecommons.org/licenses/by-nc/4.0/.
Statistics from Altmetric.com
Introduction
In the Netherlands, a declining trend in annual number of newly diagnosed HIV infections has been observed since 2008.1 By the end of 2018, an estimated 23 300 people were living with HIV, of whom a substantial proportion (n=1900, 8%) were estimated to be unaware of their infection.1 In that same year, about half of newly diagnosed HIV infections were late-stage infections.1 An important step towards zero new HIV infections is ensuring timely diagnosis and treatment through optimal HIV testing strategies. As the Dutch HIV epidemic is not affecting all regions equally, with clustering in very highly urbanised regions such as the cities of Amsterdam and Rotterdam,2 region-specific tailored approaches for optimised HIV testing and care are warranted.
Nearly 70% of STI consultations are performed by general practitioners (GPs) in the Netherlands.3 In addition, sexual health centres (SHCs) provide client-initiated STI testing and care for key groups, such as people being notified for an STI, people having STI symptoms, men who have sex with men (MSM), people with a non-Western migratory background and people aged <25 years. GPs and SHCs are therefore the main access points for STI testing and care, but there are important differences in accessibility between GPs and SHCs. The GP is readily accessible for all, while the SHC is only accessible for key groups. GPs usually test for HIV at the request of the patient, and guidelines recommend testing for HIV based on risk assessment and symptoms and in the presence of HIV indicator conditions.4 The cost of HIV testing by a GP is not covered by health insurance if the obligatory annual deductible (currently €385) has not been reached. In contrast, at the SHC, testing and care are free of charge. Since 2015, SHCs have been offering HIV testing for key groups on an opt-out basis, with the exception of heterosexual attendees <25 years who are tested for HIV on indication only.5 The number of SHC attendees is limited by financial restrictions imposed by national policy.5
GPs and SHCs diagnose 36% and 27% of new HIV infections in the Netherlands, respectively, with the remainder being diagnosed in hospitals or other settings such as antenatal care services.1 6 However, the number of HIV tests performed by GPs and their contribution to HIV testing compared with SHCs in the Netherlands are unknown. Insight into this contribution is needed to identify opportunities for improved HIV testing strategies. Therefore, this study aimed to compare HIV testing and positivity by GPs versus SHCs in five Dutch regions with different levels of urbanisation. We expect that opportunities for improved HIV testing predominantly lie with GPs due to their accessibility in all geographical areas and because HIV testing by SHCs is already done on an opt-out basis in key populations.
Methods
Design and setting
In this retrospective observational study, we used laboratory data (2011–2018) on HIV testing and HIV positivity by healthcare provider (GP or SHC) from five regions in the Netherlands (Amsterdam, Rotterdam, Maastricht, Twente, North Netherlands). The five participating regions accounted for 24% of the total Dutch population of 17.2 million in 2018.7 These regions were selected because a collaboration was already established,8 and to provide an overview of HIV testing in settings with varying levels of urbanisation in the Netherlands. As shown in figure 1, each region consists of one or more municipalities, varying in level of urbanisation (number of residents per square kilometre, based on 2018 data). The regions ranged from rural (North Netherlands, N-NL: 208 residents/km2) to very highly urbanised (Amsterdam: 5160 residents/km2; Rotterdam: 2936 residents/km2).

Urbanisation map of the Netherlands and study region descriptives1. 1Based on 2018. 2Number of residents per square kilometre. 3Level of urbanisation by region; each region consists of one or more municipalities. 4Estimated GP test data coverage to adjust for incomplete HIV test data, as we were not able to collect data from all laboratories that perform diagnostics for GPs. GP, general practitioner; NA, not applicable.
Data collection
All laboratories performing diagnostics for GPs and SHCs in participating regions were approached for data collection. The annual number of HIV tests performed by GPs and SHCs and the number of positive HIV tests were collected, stratified by sex and age category (15–29, 30–44, 45–59 and ≥60 years). HIV tests as part of antenatal screening were excluded. The aggregated laboratory data were combined with the number of residents and level of urbanisation per region, as publicly available from Statistics Netherlands.9
Data were included if both the patient’s and the healthcare provider’s postal code were within the region. For GPs in Amsterdam, the patient’s postal code was not available; thus, inclusion was based only on the postal code of the GP. For the N-NL region, all GP laboratory data were included irrespective of postal code. SHC data for N-NL in 2015 were missing as diagnostics for SHCs were performed by a foreign laboratory in that year and could not be retrieved.
Case definition
An HIV test was defined as a serum HIV antibody test, antigen test or a combination test (HIV antibody and p24 antigen). Multiple HIV tests performed within 21 days were counted as one to exclude repeat or confirmation tests. The HIV test result was defined as the result of the last test performed within a 21-day window to exclude possible false positive and false negative test results.
Data coverage
The SHC data coverage was 100%, since laboratory services for SHCs are performed by a single laboratory per region. GPs may contract various diagnostic laboratories. As we were not able to collect data from all laboratories that perform diagnostics for GPs, GP data coverage was estimated by each region to adjust for incomplete data. The estimated GP data coverage ranged from 72% to 92% (figure 1).
Statistical analysis
Overall mean and annual HIV testing rates (number of tests per 10 000 residents) were calculated for each region and stratified by provider group, sex and age category. We compared HIV testing rates between provider groups with SHC as reference, calculating rate ratios (RR) and their 95% CI. Rates were modelled using generalised additive models (GAM), with the log of total number of residents as offset. Since outcomes were overdispersed, they were modelled assuming a negative binomial distribution. To correct for missing data, HIV testing rates and GAM analyses including GP data were adjusted for regional GP data coverage by multiplying the number of tests with 1/coverage for each region. Overall mean positivity percentages (number of positive tests out of tests performed) were calculated for each region, and compared between providers using χ2 tests, or Fisher’s exact tests when more than 20% of the cells had an expected frequency below five. For all calculations in the region of N-NL, GP and SHC data for 2015 were excluded as SHC data were missing. All analyses were performed using R V.3.6.3. A p value <0.05 was considered statistically significant.
Results
Laboratory data
We analysed 505 167 HIV tests performed by GPs and SHCs from the five included regions from 2011 to 2018 (online supplemental table 1). GPs and SHCs from the very highly urbanised regions of Amsterdam and Rotterdam performed the largest proportion of tests of the included study regions (59% from Amsterdam and 19% from Rotterdam, respectively). SHCs conducted more tests compared with GPs (323 370 (64%) vs 181 797 (36%)), with the vast majority of SHC tests done in Amsterdam (65%, 209 610 of 323 370). In total, 2128 HIV tests were positive, 1156 (54%) from SHCs and 972 (46%) from GPs. The largest number of positive HIV tests was reported in Amsterdam (1268, 60%), followed by Rotterdam (508, 24%), N-NL (200, 9%), Twente (117, 6%) and Maastricht (35, 2%).
Supplemental material
Mean HIV testing rates
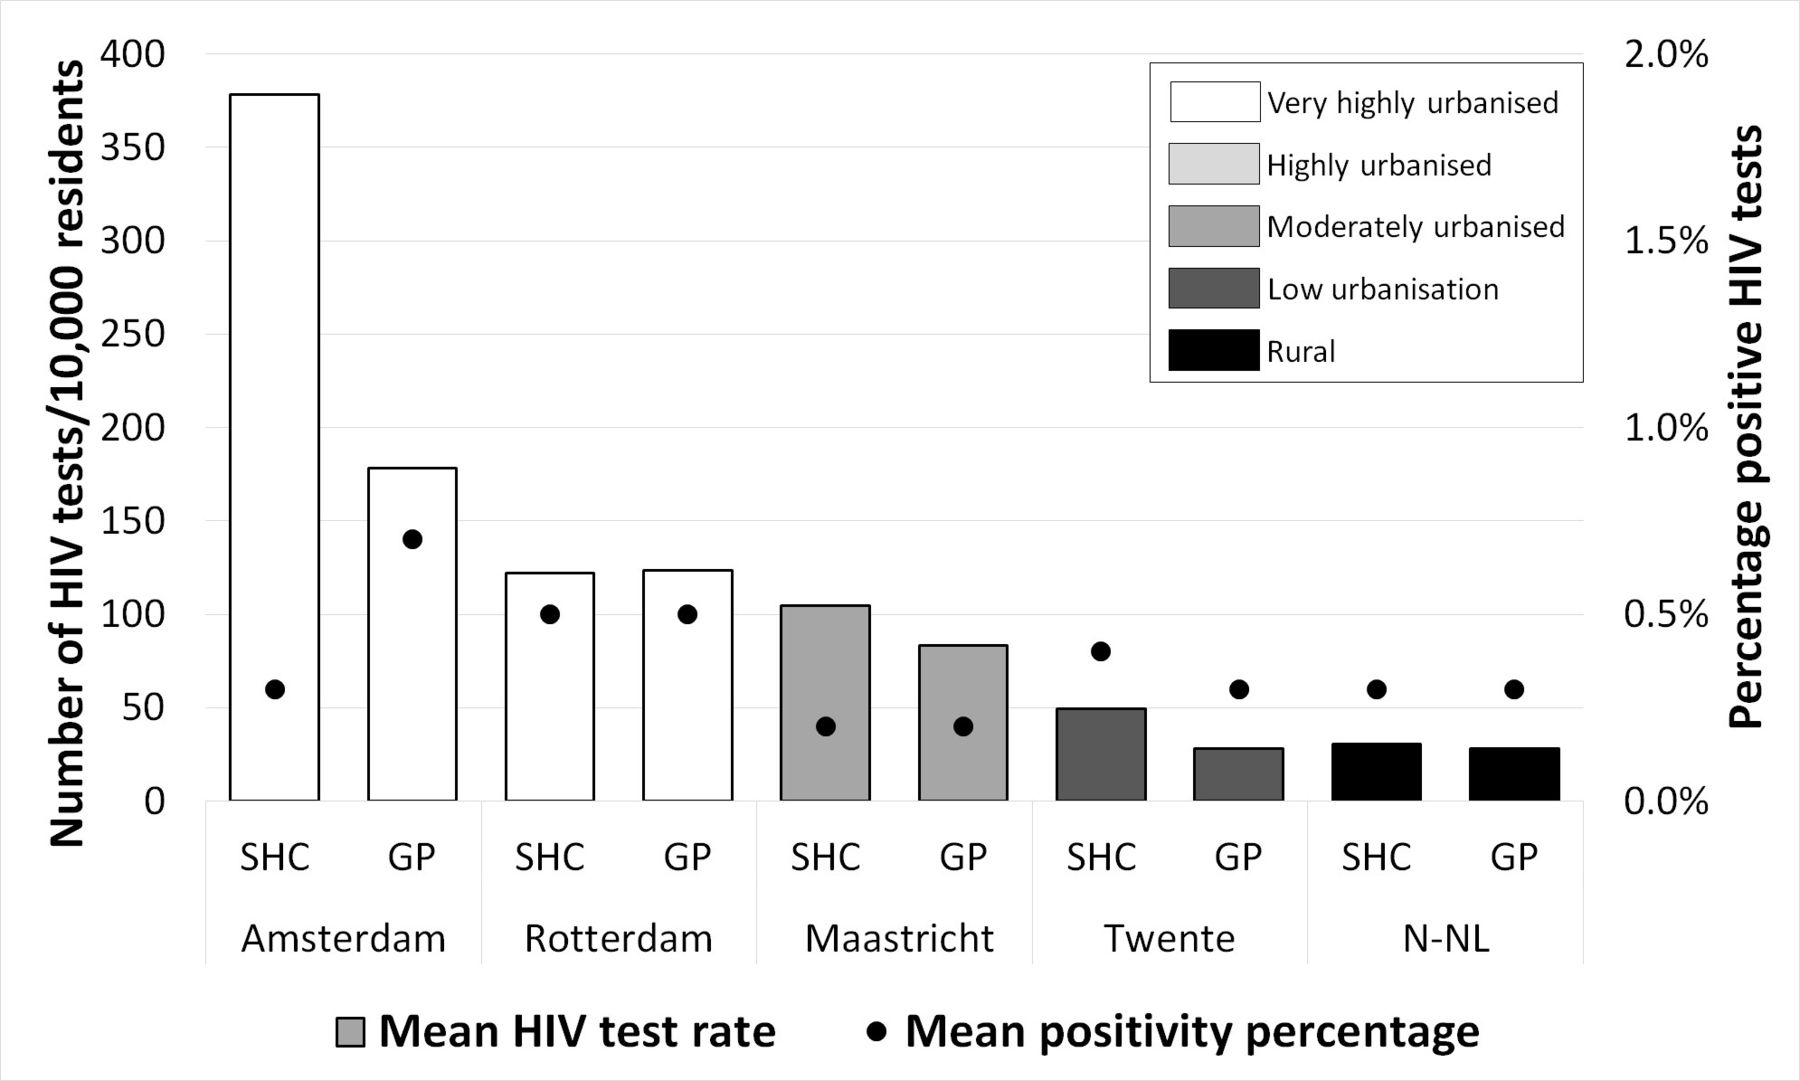
Figure 2 and table 1 show the overall mean HIV testing rates per 10 000 residents by provider per region. The mean HIV testing rates decreased with decreasing level of urbanisation. In three regions with varying levels of urbanisation—Amsterdam, Maastricht and Twente—GPs’ testing rates were lower than SHCs’, with the biggest difference between providers observed in Amsterdam (RR 0.47, 95% CI 0.44 to 0.50). In the very highly urbanised region of Rotterdam and in the rural region of N-NL, mean testing rates were comparable between GPs and SHCs (RR 1.01, 95% CI 0.97 to 1.05 and RR 0.93, 95% CI 0.88 to 0.97, respectively).

Mean number of HIV tests per 10 000 residents ≥15 years and mean HIV positivity percentage, by provider, in five regions in the Netherlands, 2011–2018. GP test data were corrected for estimated HIV test data coverage per region. Data in 2015 for N-NL are missing and not included in the calculations. GP, general practitioner; N-NL, North Netherlands; SHC, sexual health centre.
Mean HIV testing rate per 10 000 residents ≥15 years and comparison between GPs and SHCs in five regions in the Netherlands, total and by sex and age category, 2011–2018
In all regions, men were tested less by GPs than by SHCs. This pattern was also observed for women in Amsterdam, Twente and Maastricht, but not in Rotterdam and N-NL. In general, RR increased with increasing patient age categories. In the youngest age category (15–29 years), testing rates by GPs were lower than those by SHCs (RR ranging from 0.24, 95% CI 0.20 to 0.28, to 0.70, 95% CI 0.65 to 0.75), while in the older age categories this was reversed for all regions except Twente.
Annual HIV testing rates
Comparing annual HIV testing rates by GPs and SHCs revealed that GPs’ rate relative to that of SHCs decreased over time in the very highly urbanised region of Amsterdam and the low urbanised region of Twente (table 2). In Amsterdam the RR comparing GP versus SHC decreased most: from 0.72 (95% CI 0.70 to 0.75) in 2011 to 0.40 (95% CI 0.38 to 0.43) in 2018. This decrease was caused by a strong increase in testing by SHCs (HIV testing rate of 314.7 in 2011 to 430.1 per 10 000 residents in 2018). The decrease in RR was observed in all subgroups in Amsterdam and most subgroups in Twente, with the strongest decrease among men and those aged 15–29 years old. In other regions, the RR remained more stable (Rotterdam and Maastricht) or increased over time (N-NL).
Annual rate ratios comparing HIV testing rates per 10 000 residents ≥15 years between GPs* and SHCs in five regions in the Netherlands, total and by sex and age categories, 2011–2018
Mean HIV positivity percentage
The overall mean HIV positivity percentage for all provider groups and regions was 0.4%. As shown in figure 2, the highest mean positivity percentages were reported in the very highly urbanised regions of Amsterdam (GP 0.7%, SHC 0.3%) and Rotterdam (GP 0.5%, SHC 0.5%), while the lowest positivity percentages were reported in the urbanised area of Maastricht (GP 0.2%, SHC 0.2%). In Amsterdam, the positivity percentages were statistically significantly higher among people tested by GPs compared with those tested by SHCs (p<0.001). No statistically significant difference in positivity was found in the other regions.
Discussion
This laboratory-based observational study comparing HIV testing and positivity by GPs and SHCs in five Dutch regions showed considerable regional differences in testing by these providers, while the positivity percentages between GPs and SHCs within regions were generally comparable. The difference between GPs’ and SHCs’ HIV testing rates largely depended on subgroups by sex and age, with GPs’ testing rates being especially lower than SHCs’ testing rates in men and those aged 15–29 years old.
Our data show that GPs are an important provider of HIV testing and that they contribute a substantial proportion of positive tests while having lower or comparable testing rates compared with SHCs in all regions. This suggests that, although SHC services are in place as an additional service for key groups for HIV testing, there are valuable opportunities for HIV testing in primary care. This is especially the case among populations that are not typically considered key HIV risk groups in the Netherlands, such as women and older people. However, the GP remains an important HIV test provider among key populations as well. In countries such as the UK, Spain, France, Belgium and the USA, the important role of GPs in optimal HIV testing and earlier diagnosis is increasingly recognised. As GPs are the primary service for (early) detection of disease in general and typically have a wide reach among residents, various interventions to improve HIV testing in this setting have been implemented in these countries.10–13
The notable regional variation in HIV testing observed in our study is likely due to differences in the level of urbanisation, populations’ cultural composition and local policy, as well as patients’ and providers’ attitudes. Not surprisingly, we observed higher HIV testing rates with higher levels of urbanisation, with the highest testing rates observed in the very highly urbanised regions of Amsterdam and Rotterdam. One explanation for this observation is the fact that key populations for HIV predominantly reside in highly urbanised regions. For example, in the Netherlands, 45% of MSM live in very highly urbanised regions, and over 30% of the residents of these highly urbanised regions are people with a non-Western migratory background.14 15 Additionally, more HIV testing campaigns are implemented among these communities, likely affecting their HIV awareness and testing behaviour. Healthcare providers in highly urbanised regions might also have higher awareness of HIV testing due to higher HIV prevalence and more focus on sexual healthcare compared with less urbanised regions, where healthcare providers are only incidentally faced with HIV-related concerns. However, although both Amsterdam and Rotterdam have similar levels of urbanisation and population composition, testing rates among both GPs and SHCs are much higher in Amsterdam than in Rotterdam. For SHCs, this discrepancy is largely explained by difference in consultation capacity. In 2018, SHCs in Amsterdam performed over 50 000 STI consultations, while SHCs in Rotterdam performed over 12 000.16 17 This difference in capacity is partially historically explained; the SHC in Amsterdam is better known among residents due to its longer existence and there are large regional differences in governmental funding, with the highest proportion allocated to Amsterdam. For GPs, the difference might be explained by higher awareness regarding HIV testing among GPs in Amsterdam: several HIV testing and care campaigns aimed at GPs have been implemented by the HIV Transmission Elimination in Amsterdam (H-TEAM) consortium, which has been working towards zero new HIV infections in the Amsterdam region since 2014, among others. This is reflected in Amsterdam GPs’ HIV testing time trends; after an initial decline in testing from 2011 to 2014, testing partially recovered from 2014 onwards.18 Meanwhile, trends in Rotterdam GPs’ HIV testing remained stable from 2011 to 2018.
The results from this study highlight opportunities for improved HIV testing strategies. Since SHCs already offer HIV testing to attendees from key groups on an opt-out basis, GPs’ HIV testing strategies have the most room for improvement. Moreover, as GPs perform over twice as many STI consultations compared with SHCs and make 79% of annual STI diagnoses, they are the primary access to sexual healthcare.6 8 In contrast, the contribution of GPs and SHCs to the annual number of HIV diagnoses is much more equal. This is partly explained by a difference in client population between GPs and SHCs, with only key populations for STI and HIV attending SHCs and because many STI consultations by GPs do not include the performance of an HIV test. Nevertheless, this discrepancy also indicates missed opportunities for HIV testing in the primary care setting. These missed opportunities are the results of previously identified barriers such as time constraints, stigma, financial barriers and low perceived risk, as well as poor adherence to the current guidelines for STI consultations.10 19 20 In addition, as the Dutch HIV epidemic is shrinking over time, positive test results will become sparser, making a sustained proactive HIV testing strategy by GPs increasingly challenging. The observed regional differences in this study, as well as the underlying differences in policy, barriers and population, should be considered when designing strategies for improved HIV testing. In these strategies, locally targeted approaches to engage GPs are warranted, not only focusing on highly urbanised regions but also engaging lower urbanised regions, where GPs are only incidentally faced with new HIV diagnoses, and the distance to SHCs makes their accessibility more cumbersome.21 Lessons taken from successful region-specific interventions to improve HIV testing strategies in primary care, such as an educational intervention implemented in Amsterdam by the H-TEAM, could serve as an example.18
Strengths
This is the first laboratory-based observational study on HIV testing by GPs versus SHCs in the Netherlands, allowing for a novel, objective assessment of the number of HIV tests performed per provider. Previous surveillance on HIV testing in primary care used data from sentinel networks, patient records, questionnaires or interviews.19 22–24 We compared our laboratory-based GP testing rates with data collected in the Dutch Sentinel General Practice Network from 1988 to 2009 and found large discrepancies in HIV testing between their results from 2009 and our results from 2011.22 This discrepancy may be due to registration bias in the sentinel network study, as they used patient records and additional questionnaires completed by GPs. With laboratory data, there is no risk of recall or registration bias, ensuring a more accurate assessment of the contribution of GPs to HIV testing.
Limitations
A limitation of this study is that we used the annual number of tests per healthcare provider, not the annual number of unique patients tested per healthcare provider. As some key groups such as MSM are advised to test for HIV biannually,5 and the SHCs only accommodate key groups while the GPs are widely accessible, it is possible that GPs’ testing rates include more unique patients than SHCs’. Second, as we used anonymised aggregated laboratory data, no data on patients’ HIV risk factors such as sexual behaviour and migratory background or reason for testing were available. Data on patients’ risk factors are available for SHCs and extensively described elsewhere,6 but not for primary care, as they are not routinely registered by GPs. We could therefore not explain differences in GPs’ and SHCs’ HIV testing based on patient risk factors other than age and sex. Combining risk factors and reasons for consultation with laboratory data could give more insight into indications for HIV testing that are being missed in both settings and pinpoint additional opportunities for improvement. Finally, the results of this study might not be generalisable to all other Western countries due to differences in the organisation of sexual health services and primary care.
Conclusions
Our results show that GPs, in addition to SHCs, play a significant role in HIV testing and HIV diagnoses, but there is large variation between regions. Lessons drawn from regions with the most proactive testing strategies could serve as a basis for broader implementation of optimal testing strategies. However, the observed heterogeneity highlights the need for regionally tailored interventions to improve HIV testing, considering all regional challenges, on our way to zero new HIV infections.
Key messages
General practitioners (GPs) and sexual health centres (SHCs) are the main providers of STI consultations and diagnostics in the Netherlands.
We found considerable variation in HIV testing by GPs and SHCs between the regions studied.
HIV testing rates were highest in very highly urbanised regions.
In this study, GPs’ HIV testing rates were lower or comparable with SHCs’, while positivity was higher or comparable among the tests performed by GPs.
Due to the wide accessibility of GPs, opportunities for improved HIV testing strategies predominantly lie with GPs, but regionally tailored interventions are needed.
Data availability statement
All data relevant to the study are included in the article or uploaded as supplementary information.
Ethics statements
Patient consent for publication
Ethics approval
No ethical approval was needed under prevailing laws in the Netherlands as this study is a retrospective observational study using aggregated anonymous data only as stated in the Code of Conduct for Medical Research.
Acknowledgments
The authors thank all contact persons and laboratories providing data for this project: Amsterdam: AMC LAKC, Comicro, OLVG Laboratory, Reinier Haga MDC, Streeklaboratorium GGD Amsterdam, ATAL Huisarts and SHO; Rotterdam: Star-SHL; Maastricht: Maastricht UMC Medical Microbiology Laboratory; Y Evers and J Wijers of Public Health Service South Limburg, Twente; F Koedijk and LabMicTA; Laboratory for Medical Microbiology and Public Health, Hengelo, the Netherlands; Noord-Nederland: J Weel, Centre for Infectious Diseases Friesland, Izore, Leeuwarden, and W Niessen, Municipal Public Health Service Groningen, Groningen. The authors also thank Anders Boyd of the Public Health Service of Amsterdam, Department of Infectious Diseases, for his advice on statistical analysis. Lastly, the authors thank the H-TEAM members: P Reiss, M Heidenrijk, GJ de Bree, M van der Valk, SE Geerlings, M Prins, U Davidovich, E Hoornenborg, Tom van Benthem, JEAM van Bergen, F Deug, A Oomen, W Zuilhof, A van Sighem, P Brokx and D Bons.
Supplementary materials
Supplementary Data
This web only file has been produced by the BMJ Publishing Group from an electronic file supplied by the author(s) and has not been edited for content.
Footnotes
Handling editor Sevgi O Aral
Twitter @saskiabogers, @GotzHannelore, @karlijnkampman
SJB and DET contributed equally.
Contributors SJB and JVB designed the project. SJB and DET collected the aggregated data. DET, MK, AO, MNL-K, NHTMD-M, CJPAH, CJGK and FB contributed to data collection. SJB and DET collaborated in designing the analyses and writing the manuscript. DET performed all statistical analyses. LMB, HMG, BM, MK, EH, AO, MNL-K, NHTMD-M, CJPAH, FB, CJGK, MSVDL, SG and JVB revised the manuscript before submission. All authors read and approved the final manuscript.
Funding This project is funded by Aids Fonds (grant number: P- 42702) and the H-TEAM. The H-TEAM initiative is supported by Aids Fonds (grant number: 2013169), Stichting Amsterdam Dinner Foundation, Bristol-Myers Squibb International (study number: AI424-541), Gilead Sciences Europe (grant number: PA-HIV-PREP-16–0024), Gilead Sciences (protocol numbers: CO-NL-276-4222, CO-US-276–1712), Janssen Pharmaceutica (reference number: PHNL/JAN/0714/0005b/1912fde), MAC AIDS Fund, ViiV Healthcare (PO numbers: 3000268822 and 3000747780) and ZonMw (grant number: 522002003).
Map disclaimer The depiction of boundaries on the map(s) in this article does not imply the expression of any opinion whatsoever on the part of BMJ (or any member of its group) concerning the legal status of any country, territory, jurisdiction or area or of its authorities. The map(s) are provided without any warranty of any kind, either express or implied.
Competing interests None declared.
Provenance and peer review Not commissioned; externally peer reviewed.
Supplemental material This content has been supplied by the author(s). It has not been vetted by BMJ Publishing Group Limited (BMJ) and may not have been peer-reviewed. Any opinions or recommendations discussed are solely those of the author(s) and are not endorsed by BMJ. BMJ disclaims all liability and responsibility arising from any reliance placed on the content. Where the content includes any translated material, BMJ does not warrant the accuracy and reliability of the translations (including but not limited to local regulations, clinical guidelines, terminology, drug names and drug dosages), and is not responsible for any error and/or omissions arising from translation and adaptation or otherwise.