Article Text

Abstract
Background The India AIDS Initiative (Avahan) project is involved in rapid scale-up of HIV-prevention interventions in high-risk populations. This study examines the cost variation of 107 non-governmental organisations (NGOs) implementing targeted interventions, over the start up (defined as period from project inception until services to the key population commenced) and first 2 years of intervention.
Methods The Avahan interventions for female and male sex workers and their clients, in 62 districts of four southern states were costed for the financial years 2004/2005 and 2005/2006 using standard costing techniques. Data sources include financial and economic costs from the lead implementing partners (LPs) and subcontracted local implementing NGOs retrospectively and prospectively collected from a provider perspective. Ingredients and step-down allocation processes were used. Outcomes were measured using routinely collected project data. The average costs were estimated and a regression analysis carried out to explore causes of cost variation. Costs were calculated in US$ 2006.
Results The total number of registered people was 134 391 at the end of 2 years, and 124 669 had used STI services during that period. The median average cost of Avahan programme for this period was $76 per person registered with the project. Sixty-one per cent of the cost variation could be explained by scale (positive association), number of NGOs per district (negative), number of LPs in the state (negative) and project maturity (positive) (p<0.0001).
Conclusions During rapid scale-up in the initial phase of the Avahan programme, a significant reduction in average costs was observed. As full scale-up had not yet been achieved, the average cost at scale is yet to be realised and the extent of the impact of scale on costs yet to be captured. Scale effects are important to quantify for planning resource requirements of large-scale interventions. The average cost after 2 years is within the range of global scale-up costs estimates and other studies in India.
- HIV prevention
- cost analysis
- India
- economies of scale
- economic analysis
- HIV
- policy
- prevention
- Program Evaluation
Statistics from Altmetric.com
- HIV prevention
- cost analysis
- India
- economies of scale
- economic analysis
- HIV
- policy
- prevention
- Program Evaluation
Introduction
The Avahan programme is a unique large-scale HIV prevention programme supported by the Bill and Melinda Gates Foundation. It works with local implementing non-governmental organisations (NGOs) supported through lead implementing partners (LPs) at the state level to deliver prevention activities for high-risk and bridge populations in India.1 The programme is focused on four Southern States (Andhra Pradesh, Karnataka, Tamil Nadu, Maharashtra) and the two north-eastern states of Manipur and Nagaland. An integral part of the programme is its evaluation, designed to provide lessons on the roll-out of large-scale national programmes.2 The multilevel analysis includes a cost-effectiveness analysis of the programme. This will provide new insight into the overall costs of large-scale national programme roll out, their cost structures, factors that influence costs and the cost-effectiveness of reaching high-risk and bridge populations.
Costs of HIV-prevention efforts are poorly understood, thus limiting the ability to plan and forecast costs for implementation.3–8 Previous cost studies of India National AIDS Control Programme (NACP) NGO projects focus on the NGO level and have a 1-year time frame, excluding costs of funding partners9–15 (and National AIDS Control Organisation's Revised Costing Guidelines for Targeted Interventions working with HRGs under NACPIII. 2009. http://www.nacoonline.org/Divisions/Finance_Division/Revised_costing_guidelines_for_Targeted_Interventions_working_with_HRGs_under_NACP-III/). Only two studies examine the causes of cost variation.14 16 Factors that might influence costs include scale, the typology of the target population, the difference in LP, the age of the intervention, geographical location and other contextual factors.13 17 18 A review of empirical and econometric evidence of costs found that targeted prevention activities among sex workers demonstrated scale effects, with 38–88% of cost variation attributed to scale.5
There are a limited number of peer-reviewed studies on the costs of HIV prevention services in Asia. The Avahan programme provides a unique opportunity to fill this gap in the evidence by prospectively measuring the costs of a large-scale programme and incorporating all levels of the delivery system and the start up activities. This paper explores the cost of Avahan activities during the first 2 years of its activity (financial years 2004/2005 and 2005/2006) as it moves from start-up to rapid scale-up. It documents the costs of implementation of HIV prevention for female sex workers (FSWs), men who have sex with men (MSM) and transgenders (TGs) in 62 districts of the four Southern states where Avahan was operational, calculates the cost per person registered and the cost per STI (sexually transmitted infection) clinic visit and analyses the causes of cost variation across the NGO projects.
Methods
Programme description
Avahan started in late 2003/early 2004 and is a focused prevention program, reaching the high-risk groups and bridge populations, in geographical locations most affected. The Avahan programme is delivered by grassroots NGOs supported by state-level LPs who are large Indian or international NGOs. The LPs subcontracted local implementing NGOs and provided technical and management support to the NGOs. The package of prevention interventions address proximate determinants of risk through outreach, behaviour-change communication on safe sex (BCC), free or socially marketed condom distribution, needle and syringe exchange (for injecting-drug use) and treatment of STIs as well as distal determinants (stigma, violence, the legal environment, medical infrastructure, mobility and migration, and gender) through structural interventions and community mobilisation.1 Within 4 years, the programme had scaled up to reach 226 855 high-risk group individuals monthly.19
Sample
Over the 2-year period of analysis (2004/2005 and 2005/2006), 107 NGO projects were functioning in the 62 districts operational at the time (see table 1), providing intervention services for FSWs (38), MSM/TG (9) and mixed populations (60). Cost data were collected from each district and from six LPs in four states. Fifteen districts in the first year and 11 in the second, covering 38 NGO projects, were selected for detailed costing (see table 1). In the remaining districts, a more general costing based on routine data was carried out.2 The detailed costing enabled a better understanding of economic costs, how costs and cost structures change with scaling up and an activitywise costing. The sites were selected in consultation with the LPs to best represent the different level of activities across the NGOs. Costs of the external programme evaluation and research studies are not included.
Summary of districts included in the cost analysis of Avahan for first 2 years of activity
Methodological approach
An ingredients approach was used to consider full financial and economic costs from the provider perspective based on the UNAIDS ‘Costing Guidelines for HIV Prevention Strategies’ and as recommended by the Asian Development Bank.20 21 Financial costs represent actual expenditure on goods and services purchased. Economic costs include the estimated value of all inputs including donated or subsidised goods and services. Costs were classified as recurrent or capital. Additionally, classifications by activity at the level of the local implementing NGO (ie, capacity building, BCC, STI services, condom promotion, community mobilisation, monitoring, planning and coordination, start-up activities, enabling environment and others) and organisational level (eg, NGO, district, state) were carried out.
Data collection
Cost data were obtained from the financial records used for routine financial and management reporting of the NGOs, LPs and foundation office in Delhi, as well as staff records and interviews with staff. For the detailed costing sites, details of donated goods and services were collected from the project. The economic costs of these items were valued at market prices obtained from local shops and interviews with project staff. Process output and outcome data were extracted from the management information system (MIS) of the project and project reports. All data were entered into a specifically designed MS Excel workbook.
Recurrent costs
Personnel costs included salaries and expenses of all staff including peer educators, volunteers and shared resource personnel. The peer educator time was valued at the honorarium paid, except where peers were not paid. In the latter case and for other volunteers, their cost was valued based on time spent on the project and the value of their time, estimated as per their average earnings or, if unemployed, the corresponding payment to peers in NACP targeted interventions.
All expenses related to project building and operating expenses, travel and monitoring were obtained from project accounts. In three of the states, the cost of STI supplies was taken from expenditure records obtained from the LP or NGO where they were held. In one state, STI provision was contracted out to an agency, and so supply costs were obtained directly from the agency. Condom costs were calculated using the number of free condoms distributed (supplied by the primary health centre or government hospitals) and the price of the lowest cost alternative in the market, that is, subsidised socially marketed condoms. Indirect costs included project-management administration and overhead costs at the NGO and LP level, and were obtained from expenditure statements.
Capital costs
In the financial costing, capital costs (including training and start up inputs) were annualised using straight-line economic depreciation, in which the total cost of the good is divided by the working life of that item. Economic costs were annualised using a discount rate of 10%, reflecting the long-term interest rates in India. A standard discount rate of 3% was then used in a sensitivity analysis.22 23 Capital equipment was assumed to have a life of between 5 and 10 years, depending on the item. Start-up and training costs were annualised over the lifetime of the project (assumed to be 5 years). The start-up period was defined as from project inception until the start of services to the key population and project output reporting commenced. Recurrent costs in the start-up period were treated as capital costs and annualised. Start-up period capital costs were allocated to the start-up period based on percentage months of start-up. Rent for project offices was included as a capital item.
Calculation of total and average costs
Both economic and financial costs were obtained from detailed costing sites. Where only financial cost data were available at the general cost sites, these were inflated by the average percentage difference between financial and economic costs at the detailed sites to obtain estimates of economic costs. Unless directly allocable, the LP level costs were allocated to each NGO according to the percentage of the total LP target population the NGO covered. Only financial costs were available for the Bill & Melinda Gates Foundation India office and the capacity development partners. These costs were allocated equally to each of the LPs. Given this and to ensure comparability with other studies that do not include central costs, these costs are reported separately.
The total costs of the Avahan programme were calculated by summing up the total capital and recurrent costs at all levels of the intervention (NGO, LP). Average costs were obtained by dividing total costs by the relevant output indicators to obtain estimates of the cost per person registered and cost per person accessing STI services. Scale, in the economic sense, reflects the extent or level of activity at which an intervention is operating.13 In the Avahan programme, this is defined as utilisation coverage.19 As the MIS was not functioning in all NGOs until 2006, the LPs were consulted to select measures of utilisation. People were registered with a project only once they had developed a rapport with the project sufficient to obtain personal details, including client volume and sex-work history. This enables peer educators to actively pursue the provision of services to these individuals. As a result, this was used alongside people receiving STI services. However, due to the early stage of development of the MIS, average costs were therefore not available for all NGOs.
Costs were adjusted for inflation using the average consumer price index for the year.24 All costs are presented in constant INR (2006) and converted to US dollars using (1 US $=44.3) (http://www.oanda.com).
Activity costing
In order to allocate the time between activities, the time that each individual spent on the project was assessed using timesheets provided to the relevant staff at the detailed costing sites and completed over 1 week. The project specific personnel costs were allocated using the percentage of time spent on various activities. General staff time was allocated equally across all the activities. From these allocations, a total activitywise recurrent personnel cost was calculated. Directly allocable recurrent and capital costs such as training costs, STI services, BCC costs were allocated to the specific activity. Non-allocable costs such as rent, building operating and maintenance, and travel costs were allocated among activities using the personnel cost percentage. The average activitywise allocations obtained at the detailed costing sites were used to allocate costs at the general costing sites.
Analysis of variation in average costs
Multivariate linear regression analysis was used to give an initial insight into the causes of the variation in average cost between local implementing NGOs. The analysis explored the relationship of cost per person registered with scale, high-risk group (MSM/TG or FSW), age of intervention, number of Avahan NGOs in the district, whether the NGO was in a metropolitan area, number of LPs in the state and by LPs by adding each variable progressively into the model. The regression was carried out using SPSS (SPSS, Chicago).
Results
At the end of the 2-year period, the Avahan interventions in the four Southern states were being implemented in 62 districts by 107 NGOs. The median start up time for the programme was 3 months (range 0–6 months). The programme had 134 391 people registered, and utilisation at the NGO level varied from 37 to 6315 people registered (n=93). The total cost of the programme was US$16 759 189 (see table 2). Table 2 shows that personnel costs were 40.4%, and STI supply costs were 8.0% of total costs. Travel costs and training costs constituted 7.7% each and indirect expenses 3.4% of the total, respectively. The economic costs were 6% higher than the financial costs. When using a 3% discount rate, the total costs fall to US$16.6 million. The analysis found that US$8.7 million were incurred at the LP level and US$12.9 million (financial costs) by the foundation office in Delhi and capacity development partners.
Total costs by input, outputs and average costs of the Avahan programme for the first 2 years of activity (2004/2005 and 2005/2006), US$ 2006 prices
Table 3 shows the composition of the overall costs by activity. The major activities were STI service costs (27% of total costs), BCC costs (15%) and condom promotion costs (11%). These were followed by capacity building costs (9.3%) and enabling environment costs, constituting 8.9%. Start-up costs were 4.7% of the overall costs.
Total cost by activity at the state level (non-governmental organisation and lead implementing partner costs), 2004/2005 and 2005/2006, US$ 2006 prices
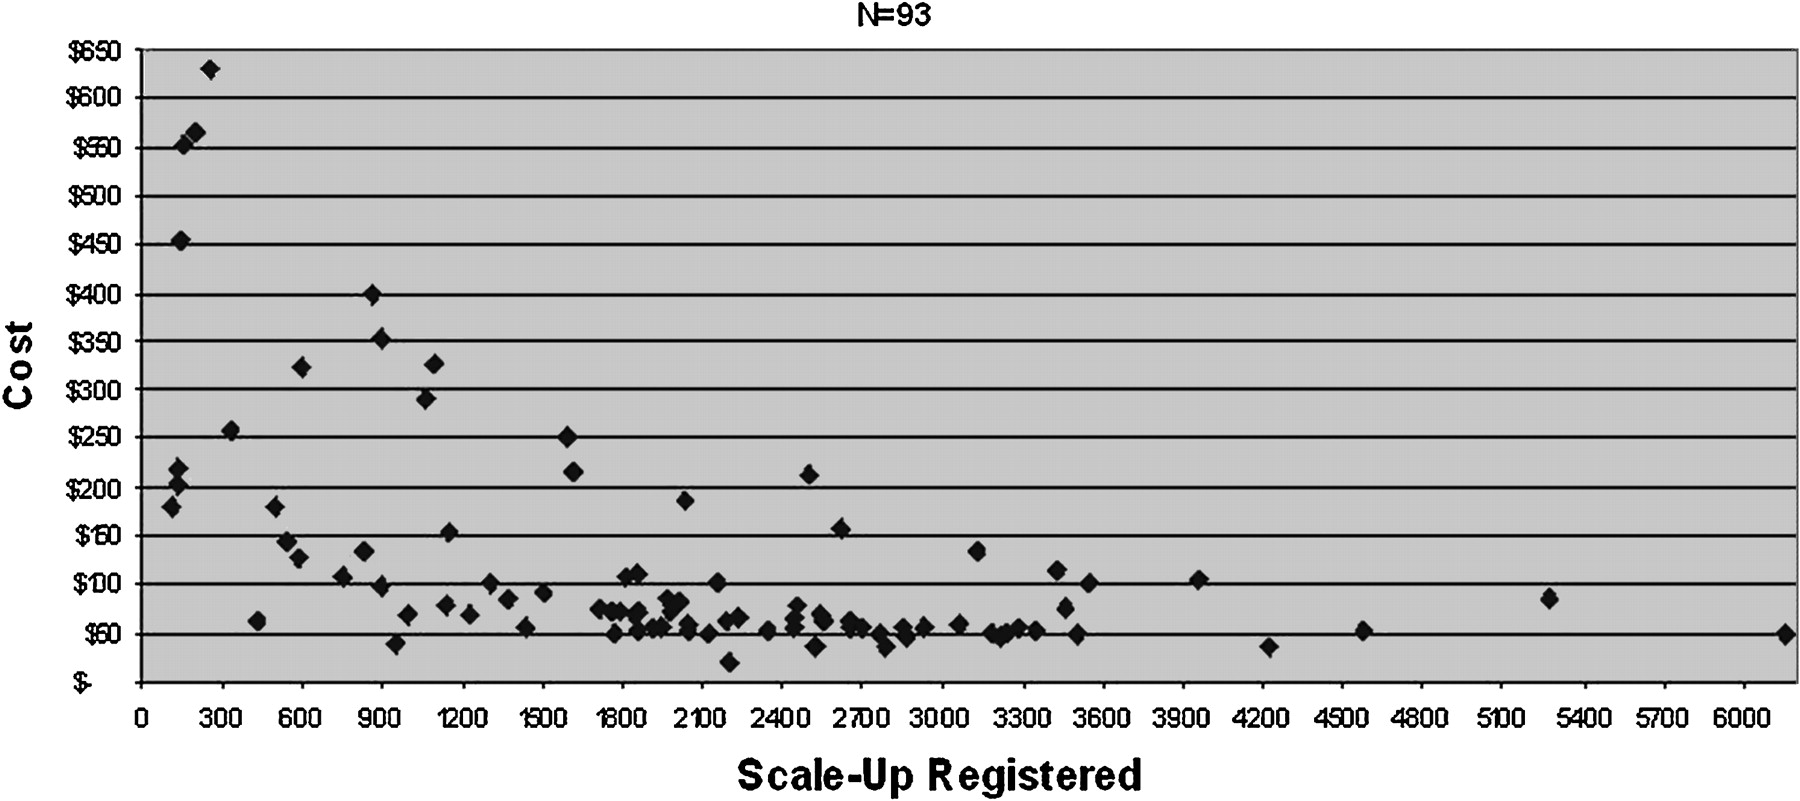
The median cost per person registered was US$76 (see table 2). The cost per person registered ranged from US$18 to US$616 across the NGOs (see table 2, figure 1). The median cost per STI clinic visit was US$117 with a mean cost of US$134 (range US$37–411). With a 3% discount rate, the median costs per person registered and per STI clinic visit were US$75 and US$112, respectively.

Average costs by scale (cost per person registered), 2004–2006 (US$ 2006 prices).
The regression of cost per person registered with scale showed that scale was significantly associated with decreasing average costs (adjusted R2=−0.248, p=0.0001). When all variables were included in the model (adjusted R2=0.605, p<0.001), the factors found to be significantly associated with average costs were scale (β=−0.604, p<0.001), age of the intervention (0.376, p<0.001), number of Avahan NGOs in the district (−0.425, p<0.001) and number of LPs in the state (either one or two) (−0.227, p=0.012). The other variables did not have a significant effect, but their inclusion increased the explained variation.
Discussion
This paper presents the results of the cost analysis of the first 2 years of Avahan's implementation and examines causes of average cost variation over the sampled sites for this period. The total cost of the programme was US$16.8 million, with personnel comprising nearly 40% of the total. Costs rose from US$4.5 million to US$12.2 million in year 2, an increase of US$7.7 million, as NGOs started up and moved from start-up to focus on increasing the intensity and quality of coverage. The activities addressing proximate determinants of risk comprised 53% of total costs, whereas those addressing distal determinants of risk made up 14.6% of costs. The 8.6% of costs attributable to enabling environment activities is in the range recommended by the AIDS commission report 2008.25 Capacity building and monitoring were also shown to be an important component of costs (9.3% and 8.1%, respectively). This activitywise analysis is unique in the costing of HIV prevention for high-risk groups in India and provides new insight into cost structures.10 12 13
A number of earlier studies have examined the costs of targeted interventions in India.10 12 13 26 The district-level-only average costs of Avahan range from US$11 to US$95 (US$10–124 with a 3% discount rate), and are closer in value to these studies (see table 4). They also coincide with the range of US$16–50 used for global scale-up estimates for different regions.27 LP level costs were found to be approximately half the total costs. These costs include both the technical and management support activities required in the early stages of the scale-up and supplies such as condoms, STI drugs and supply of educational materials. These project supplies distributed directly to the NGO level amount to 7% of total LP costs.
Comparison of costs of HIV prevention for female sex workers in India
Further costs were incurred beyond the NGOs and LP organisational levels at the foundation office. These amounted to US$12.9 million, 70% of which was spent on capacity development through pan-Avahan capacity development partners. Approximately 14% of total financial costs are foundation staff costs. These transaction costs inherent in the contracting out and subsequent management are rarely reported. One study of a large-scale nutrition programmes in Madagascar and Senegal found contracting costs to be between 13% and 17% of total costs.28 Similarly, Guinness (2006) estimated that the costs incurred by the State AIDS Control Societies and other state-level agencies responsible for management of NGO contracts in the delivery of HIV prevention services in India were between 11% and 17% of total costs.29 In the case of the Avahan costs presented here, the relatively high portion of costs at the central and LP level need to be seen in the context of a large-scale programme in its first 2 years. These early years require a high level of technical and management inputs to ensure quality and consistency of services and supplies and to develop management systems while scaling up.
The cost per person registered varies across the NGOs. Economic theory on costs and empirical literature on costs of HIV prevention strategies show that scale is a major cause of this variation so that average cost falls as scale increases, at least in the short run.5 10 13 30 Figure 1 supports this hypothesis, and the regression found scale to be responsible for 24% of the cost variation. The figure indicates that as each NGO intervention is scaled up, the average cost for that intervention will fall until about 2000 people are registered, above which there is less variation in the average cost. This implies that in moving to scale, total costs will initially increase rapidly, but as scale is reached the rate of increase in total costs will begin to fall. The regression also found that age, number of Avahan NGOs in the district and number of LPs in the state have an impact on costs. Age is positively associated with average cost, and the number of NGOs and number or LPs in the state are negatively associated with average cost. As all implementation NGOs were local, it was not possible to test for the impact of an international NGO on average costs. However, without a random sample and the skewed nature of the data, econometric estimation of a cost function will be required to further explore the impact of these factors.
As with other studies of unit cost, the average cost per person registered cannot capture the quality of the intervention. In addition, although the person registered does capture only those target group members that have had repeated contact with the projects, this may be subject to some variation across the NGOs. However, the standardised MIS used and the uniform capacity development that staff undergo across the NGOs should minimise this variation. The use of registration data may also have underestimated utilisation. In the early years, there was reluctance by some outreach teams to collect registration data due to the concern of scaring the target group. In contrast, in a minority of cases, registration data were not available for the first year of analysis, and people contacted was used as a proxy, so that utilisation numbers have been inflated. A final limitation lies in the standard issues of bias in self-reporting for the timesheets. The extent of the bias is unknown but is believed to be limited.
Kumaranayake, in her review, observed that there are very few empirical cost data collected alongside programming as it expands.5 In the Avahan evaluation, prospective data are being collected to monitor costs and document service delivery. This prospective data collection provides for greater reliability in the cost estimates than any of the previous studies in which costs have been collected retrospectively. At the end of this period of analysis, the Avahan programme had reached less than 50% of the estimated population through monthly outreach.19 By December 2008, 75% of the estimated target population was being reached monthly.19 Estimating the resource requirements for this further scaling up, and the implications for scaling up in the government programme, requires further modelling of the costs.
Conclusion
In this paper, we have presented the early results of the cost analysis of the first 2 years of the Avahan project. Once the full 4 years of data have been collected, it will be possible to explore further how costs change as the programme scales up coverage, intensity, quality and scope of services. These first results from the programme show that during rapid scale-up of targeted HIV preventions, a significant reduction in average costs is apparent. These scale effects are therefore important to quantify for planning future resource requirements of large-scale interventions.
Key messages
Unique costing of a large-scale HIV prevention programme for vulnerable groups with multiple national and international implementing partners in South Asia.
After 2 years, the total economic cost was 16.9 million; the cost per person registered was $76, ranging from $18 to $650 across the NGO service delivery partners.
The average cost variation was largely explained by scale, number of NGOs per district, number of LPs in the state and project age.
Acknowledgments
Our sincere gratitude to all the project staff, peer educators, volunteers and community members who participated in the study.
References
Footnotes
Linked articles 038323, 038356, 038364, 038398, 038497, 038513, 038653, 038760, 038802, 038950, 039115, 039255, 039263, 039289, 039297, 040170, 040428.
Funding This research was funded by the Bill & Melinda Gates Foundation.
Conflict of interests None.
Ethics approval Ethics approval was provided by the Health Monitoring and Steering Committee in India and the Centre Hospital Affiliare ethics board in Canada.
Provenance and peer review Not commissioned; externally peer reviewed.
This is an open-access article distributed under the terms of the Creative Commons Attribution Non-commercial License, which permits use, distribution, and reproduction in any medium, provided the original work is properly cited, the use is non commercial and is otherwise in compliance with the license. See: http://creativecommons.org/licenses/by-nc/2.0/ and http://creativecommons.org/licenses/by-nc/2.0/legalcode.
Linked Articles
- Editorial
- Editorial
- Editorial
- Editorial
- Editorial
- Editorial
- Supplement
- Supplement
- Supplement
- Supplement
- Supplement
- Supplement
- Supplement
- Supplement
- Supplement
- Supplement
- Supplement