Article Text

Abstract
Background The Spectrum and Estimation and Projection Package (EPP) programs are used to estimate key HIV indicators based on HIV surveillance and surveys, programme statistics and epidemic patterns. These indicators include the number of people living with HIV, new infections, AIDS deaths, AIDS orphans, the number of adults and children needing treatment, the need for preventing mother to child transmission (PMTCT) and the impact of antiretroviral treatment on survival.
Methods The Joint United Nations Programme on HIV and AIDS (UNAIDS) Reference Group on Estimates, Models and Projections regularly reviews new data and information needs and recommends updates to the methodology and assumptions used in Spectrum. The latest updates described here were used in the 2011 round of global estimates.
Results Spectrum and EPP have now been combined into one software package to enhance ease of use and ensure consistent data and assumptions for the curve fitting and indicator estimations. Major enhancements to the methods include a new adult model that tracks the HIV+ population by CD4 count; new patterns describing child survival by time of infection (perinatally, <6 months, 7–12 months and 12+ months after birth); a more detailed estimate of mother-to-child transmission that includes differential transmission rates by CD4 count of the mother, the effects of incident infections and new prophylaxis options; and new procedures to estimate uncertainty ranges around regional estimates.
Conclusions The revised model and software facilitate the preparation of new HIV estimates and use new data to address emerging needs for better information on need for treatment among adults and children.
- AIDS
- HIV
- Modeling
This is an open-access article distributed under the terms of the Creative Commons Attribution Non-commercial License, which permits use, distribution, and reproduction in any medium, provided the original work is properly cited, the use is non commercial and is otherwise in compliance with the license. See: http://creativecommons.org/licenses/by-nc/3.0/ and http://creativecommons.org/licenses/by-nc/3.0/legalcode
Statistics from Altmetric.com
Introduction
The Joint United Nations Programme on HIV and AIDS (UNAIDS) projections of adult HIV prevalence and incidence are prepared using the Spectrum/Estimation and Projection Package (EPP) software to estimate prevalence and incidence trends from surveillance and survey data and to determine the consequences of these projections, including the number of people living with HIV by age and sex, new infections, AIDS deaths, AIDS orphans, the need for treatment and prophylaxis, and the impact of treatment. Earlier updates to Spectrum and EPP have been published previously.1 ,2 The purpose of this paper is to describe the updates to Spectrum made in the last 2 years, used in the 2011 global estimates of HIV/AIDS.
The Spectrum/EPP program and manuals are updated regularly and available in multiple languages free of charge at http://www.FuturesInstitute.org. Model development has been funded primarily by The United States Agency for International Development (USAID), UNAIDS and the Bill and Melinda Gates Foundation with technical collaboration from UNAIDS, WHO, The United Nations Children's Fund (UNICEF), UN Population Division, US Census Bureau, The United Nations Population Fund (UNFPA) and other organisations.
The major inputs and outputs of the AIDS module of Spectrum are shown in figure 1. Demographic projections are based on user inputs or projections prepared by the United National Population Division.3 The projections start with an estimate and projection of adult incidence, which is combined with information on the age and sex distribution of incidence and progression to death to estimate the number of new adult infections by age and sex. New infant infections are estimated from prevalence among pregnant women and the rate of mother-to-child transmission, which is dependent on infant feeding practices and the coverage of prophylaxis with antiretrovirals (ARVs). New infections progress over time to lower CD4 counts and are subject to AIDS-related mortality. Those who receive first-line and/or second-line antiretroviral treatment (ART) experience extended survival. People at any stage are also subject to non-AIDS mortality at the same rates as those who are not infected. Adult deaths result in orphans.
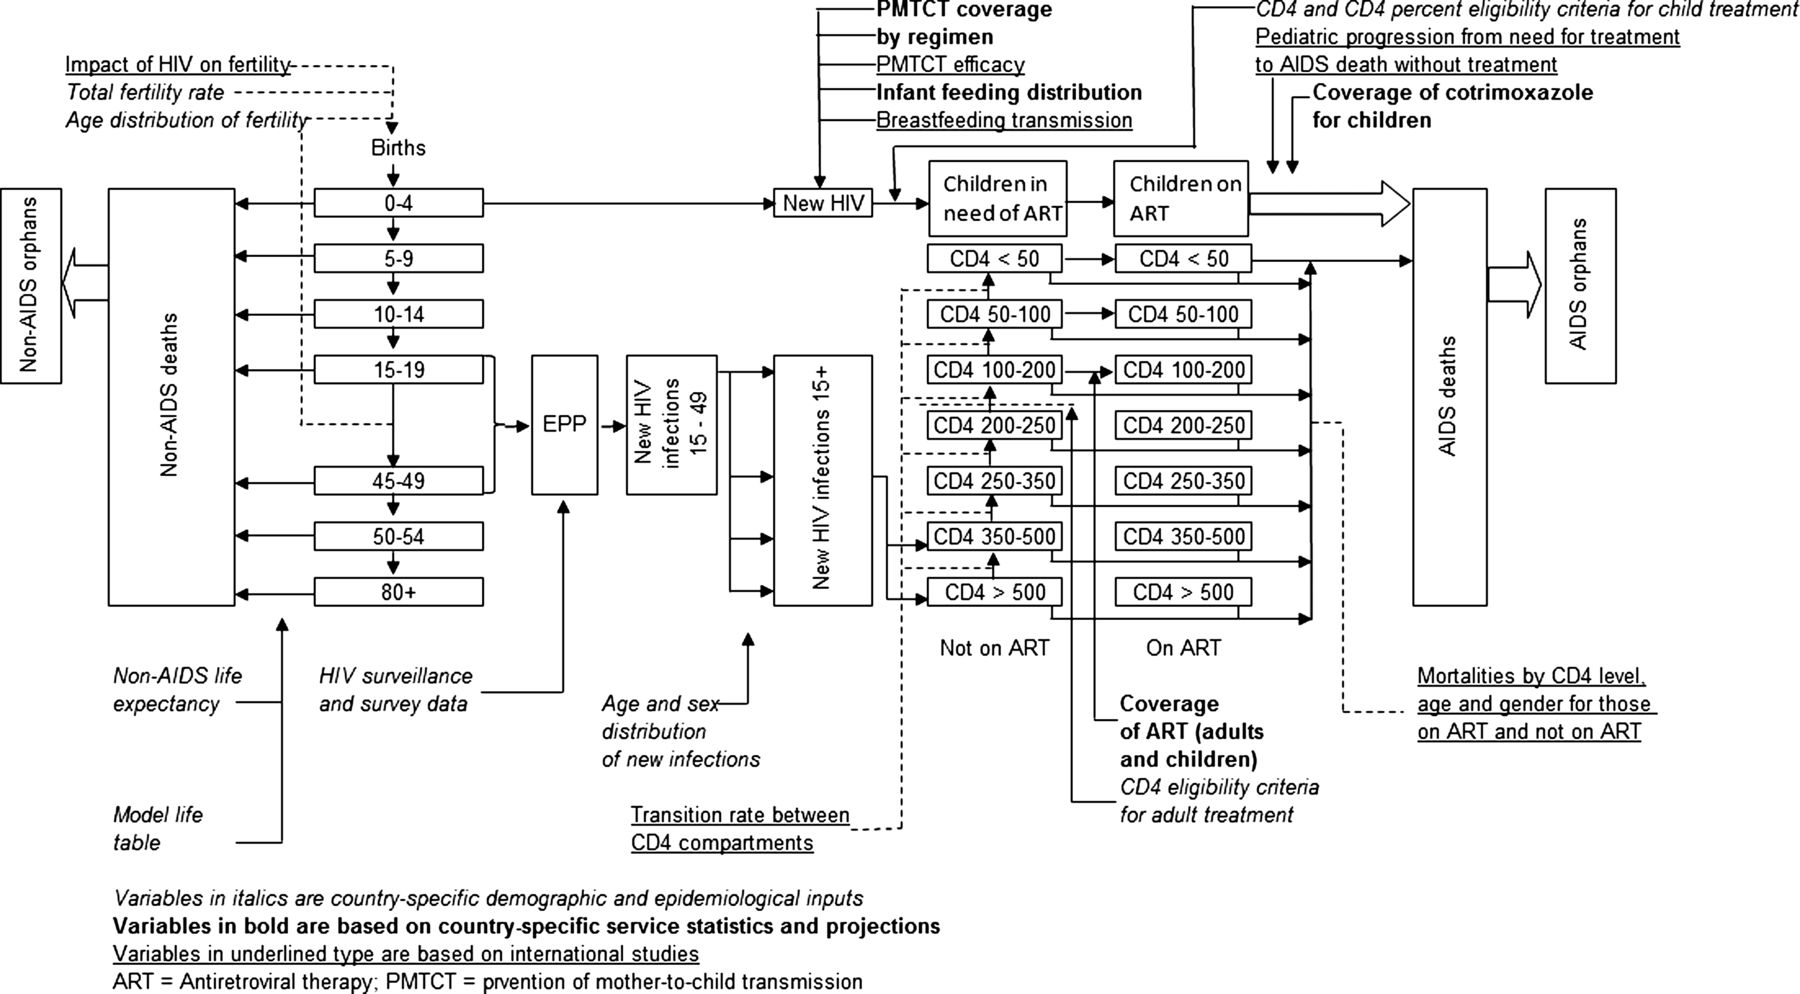
Diagram of Spectrum/Estimation and Projection Package (EPP) model.
Several new features have been added to Spectrum for the 2011 round of estimates in response to new data, new treatment guidelines and new needs by national programmes for planning. These include: integration of EPP and Spectrum into one software package to enhance ease of use, tracking of the HIV+ population by CD4 count, new procedures for estimating mother-to-child transmission of HIV, new estimates of the survival of children infected with HIV, estimates of HIV-related maternal mortality and new procedures for estimating region uncertainty around key indicators.
Integration of EPP and spectrum
Motivation for integration
Spectrum and the UNAIDS EPP have formed the core of national HIV estimation and projection exercises for over a decade. EPP fits user-supplied prevalence data from HIV surveillance systems to generate a prevalence projection and then calculates the associated incidence. Spectrum then takes the resulting fits, applies a demographic model and age and gender specific data on HIV incidence and progression patterns, and generates important programme-related outputs as outlined above.
Versions of these two programs have been released every 2 years; and, through the 2009 release, they existed as distinct standalone programs. Based on feedback from national users of the two programs, the UNAIDS Reference Group on Modelling, Estimation and Projection made a decision in 2010 to integrate the two programs for the 2011 round. The goal was to provide a more holistic experience for users, to improve the consistency between the results of the two programs, and to make the process easier and clearer for their users. At the Reference Group meeting where this decision was made, Futures Institute presented the findings of a human factors review of the Spectrum interface, undertaken with the goal of making it more user-friendly by structuring it more logically for the way that users apply it.
Integration of spectrum and EPP in a single interface
The human factors review suggested that the various components of the Spectrum system, for example, DemProj (the demographic projections module), AIM (the AIDS Impact Module), or the Family Planning component be made more apparent to the user. To achieve this, the largely menu-driven system of previous versions of Spectrum was replaced by a ribbon of modules at the top of the interface, similar to the system used in Microsoft Office. Each of the modules was then organised into a set of left to right menus for invoking each of the essential steps taken in that module. Figure 2 illustrates this for the AIM, which countries use to generate their national estimates and projections.

Spectrum interface showing the ribbon with different modules and the Incidence menu used to invoke Estimation and Projection Package (EPP) for curve-fitting national projections.
The user starts on the left with ‘Programme statistics’, entering information on programmes for adult ART, preventing mother to child transmission, and treatment of children with ART and cotrimoxazole. The user then sets CD4 eligibility criteria for ART under ‘Eligibility for treatment’. The next step is to generate incidence trends for the country under the ‘Incidence’ menu, which invokes the EPP component now built into Spectrum. The user completes three essential steps here: setting up the sub epidemics that make up the national epidemic (‘Configuration’), entering surveillance and national survey data on HIV prevalence (‘Surveillance data’), and fitting the epidemic (‘Curve fitting’). Upon completing the fits, the user sets the gender and age patterns of incidence (‘Sex/age pattern’), and finally views the results of his or her work (‘Results’). The ‘Advanced option’ entry is used to change the details regarding the CD4 model described later in this paper, but few users need to make changes to the defaults provided.
Changes to foster closer integration and improve ease of use
In addition to the integration in the interface, a number of changes have been made to EPP to minimise the differences between the outputs of EPP and Spectrum. Instead of the relatively simple 15 and older population model specified in the original Reference Group model,4 EPP now obtains populations for those between ages 15 and 49 directly from Spectrum. In addition, Spectrum provides annual migration, age-in and age-out information. This gives EPP the same population dynamics in the 15–49 age range as Spectrum. The shift from looking at the population 15 and older to only including those between 15 and 49 was made because most of the data being fit, for example, HIV surveillance data and national survey data, are taken from prevalence samples in this more restricted age range.
Another important change in the population model for concentrated epidemics in 2011 is to allow the size of key subpopulations, for example, people who inject drugs or female sex workers, to vary from year to year according to user specified values. Earlier versions of EPP required that these populations grow at the same rates as the population as a whole.
EPP now obtains its ART information directly and automatically from Spectrum. Furthermore, EPP has adopted the same CD4 model used in Spectrum, described later in this paper, and automatically obtains the parameters for this model from Spectrum. These changes guarantee that EPP and Spectrum are calculating the impacts of ART in the same way.
In addition to the original Reference Group model, now labelled ‘EPP Classic’ in the interface, EPP incorporates a new more flexible model known as ‘Variable-R’. The Variable-R model, described in more detail in Bao et al elsewhere in this issue, allows EPP to handle epidemics where prevalence and incidence may have begun to rise again as new generations of susceptible individuals initiate risk behaviours. EPP also includes a ‘Workbook model’ intended for fitting a limited series of annual point estimates of HIV prevalence taken from the UNAIDS workbook.5
In integrating the two programs, efforts were also made to simplify the interface on the EPP side. For example, figure 3 below shows the fitting interface in Spectrum 2011. The user need only select the model to be used in the upper left-hand corner and hit the large green ‘Fit’ button; and after extensive calculation the results shown in the graph will be displayed. These results automatically include calibration to national survey data and uncertainty analysis.

The curve-fitting screen in Estimation and Projection Package (EPP).
While the population, ART and CD4 model changes have helped to reduce the difference between the Spectrum and EPP calculations, the two results still do not agree exactly because Spectrum uses a set of full gender and age specific parameters in all of its calculations, while EPP uses averages of the gender-specific and age-specific values. Given the large number of calculations that must be performed in fitting the data using Bayesian uncertainty approaches, moving EPP to a full age and gender specific model would slow calculations unacceptably. As a result, Spectrum automatically applies an incidence adjustment when required to match the prevalence in 15–49-year-olds produced by the EPP curve fits.
Model of adult HIV infection
Early versions of Spectrum modelled the progression from new HIV infection to AIDS death in the absence of treatment as a single Weibull function that described the proportion dying by time since infection. The need for treatment was estimated as those within 3 years of death. This approach worked well as long as the criterion for eligibility for treatment did not change. However, a new approach was needed in order to accommodate changes in eligibility criteria over time and different criteria in different countries.
In response to these issues Spectrum now uses a CD4 compartment model. The major advantage of this approach is that the number of people eligible for treatment can easily be determined at any point in time based on the CD4 level for eligibility.
The model structure has seven CD4 compartments as shown in figure 1. The compartments were selected on the basis of eligibility criteria and mortality patterns. To match eligibility criteria in use today categories for <200, <250 and <350 are needed. Since mortality patterns for untreated patients are very different for those <50 and <100, it is appropriate to add categories for <50, 50–99 and 100–199.
Most adults newly infected with HIV enter the model with CD4 counts of >500 but some portion start at 350–500. In each time step those in a CD4 category may (1) stay in that category, (2) die from a non-AIDS cause, (3) die from AIDS, (4) progress to the next lower CD4 category, (5) initiate ART, or (6) migrate out of the population.
Those on ART are also subject to death and migration. Their CD4 status is not updated as mortality is determined by their CD4 count at initiation. Mortality is also affected by duration of treatment with different patterns for those in treatment for 0–6 months, 7–12 months and more than 12 months.
The model requires values for progression rates (λ) and death rates for those not on ART (μ) and those on ART (α). The International Epidemiologic Databases to Evaluate AIDS (IeDEA) Consortium has analysed patient data to determine patterns of HIV-related mortality while on ART by age, sex, duration on treatment, CD4 count at initiation and geographic region.6
Parameter values for progression to the next lower CD4 category (λ) and non-AIDS mortality (μ) were determined by fitting the model to the epidemic in Kenya subject to three constraints: the overall pattern of mortality for a cohort of newly infected adults should match the pattern described by the ALPHA network with a median survival time of 11.5 years,7 ,8 the annual rate of decline in CD4 counts should be constant across CD4 categories and in the range of 50–1109–12 and the distribution of HIV+ adults not on treatment in 2007 should match the distribution reported for Kenya in the 2007 AIDS Indicator Survey.13 Initial values of non-AIDS mortality were based on a review by Johansson et al.14
This new model of adult infection does not change the overall progression from HIV infection to death but does allow greater flexibility in implementing the different treatment eligibility criteria adopted by national programmes.
The final set of parameter values in Spectrum and used in most national estimates is shown in table 1.
Parameter values for Spectrum adult ART model
Mother-to-child transmission
The transmission of HIV from mother to child is divided into two components: perinatal transmission during gestation and delivery and postnatal transmission through breast feeding. The peripartum transmission rate depends on the CD4 count of the mother at the time of birth and the type of prophylaxis if any. The following prophylaxis regimens as defined by WHO are considered: single dose nevirapine (NVP), WHO dual ARV (two ARVs for the mother, such as azidothymidine (AZT) starting at 32–36 weeks plus single-dose NVP at birth), option A, option B and ART for the mother.
If the mother does not receive any prophylaxis then the peripartum transmission rate depends on the CD4 count of the mother and whether or not the mother became infected during the current pregnancy. We assume that HIV+ pregnant women are distributed by CD4 count according to the CD4 distribution of all HIV+ women aged 15–49. Data from the Kenya AIDS Indicator Survey13 indicate that the two distributions are similar. We similarly assume that the proportion of HIV+ pregnant women not receiving any prophylaxis who became HIV+ during the current pregnancy is equal to the proportion of new infections among all HIV+ women aged 15–49.
The perinatal mother-to-child transmission rate is the weighted average of the proportion in each prophylaxis group and the corresponding probability of transmission for that type of prophylaxis and the CD4 count of the mother. Transmission rates by type of prophylaxis are from the expert consensus described elsewhere in this supplement.15 These rates assume that Option A and Option B are used only by women with CD4 counts greater than or equal to 350, since those with CD4 counts under 350 should be on ART. If the number of women using Option A and Option B is larger than the number of pregnant women with CD4 counts greater than 350 then the transmission rates for Option A and B are adjusted for the proportion of users who have CD4 counts under 350. We assume that transmission rates are double for those with CD4 counts under 350.
HIV transmission from mother to child also may occur through breast feeding. The number of children infected through breast feeding is calculated as the product of the number of children born to HIV+ mothers who are not infected, the proportion of children exposed to transmission through breast feeding and the monthly probability of transmission through breast feeding. For most countries, the proportion of children that are breast fed by age in months in taken from the most recent Demographic and Health Survey and, therefore, refers to all women not just HIV+ women. Patterns for HIV+ women can be entered into the program if they are available.
The monthly probability of HIV transmission is a weighted average of the proportion of children still breast feeding, the distribution of breastfeeding children by prophylaxis regimen and the corresponding transmission rate. Some children may become infected during breast feeding. In this case, transmission is calculated as a single event in the year and added to the transmission rate from children who were infected before birth.
The distribution of women by prophylaxis regimen is an input based on programme data. We assume that the input values correspond to women starting a prophylaxis regimen when they start breast feeding. Some women may stop the prophylaxis before they stop breast feeding. This drop-out rate is used to calculate the proportion on prophylaxis regimen by the age of the child. The number of children newly infected at each age is the product of the number of exposed children and the probability of transmission.
These changes accommodate the new prophylaxis regimens recommended by WHO and update transmission parameters with data from the latest studies.
Child survival
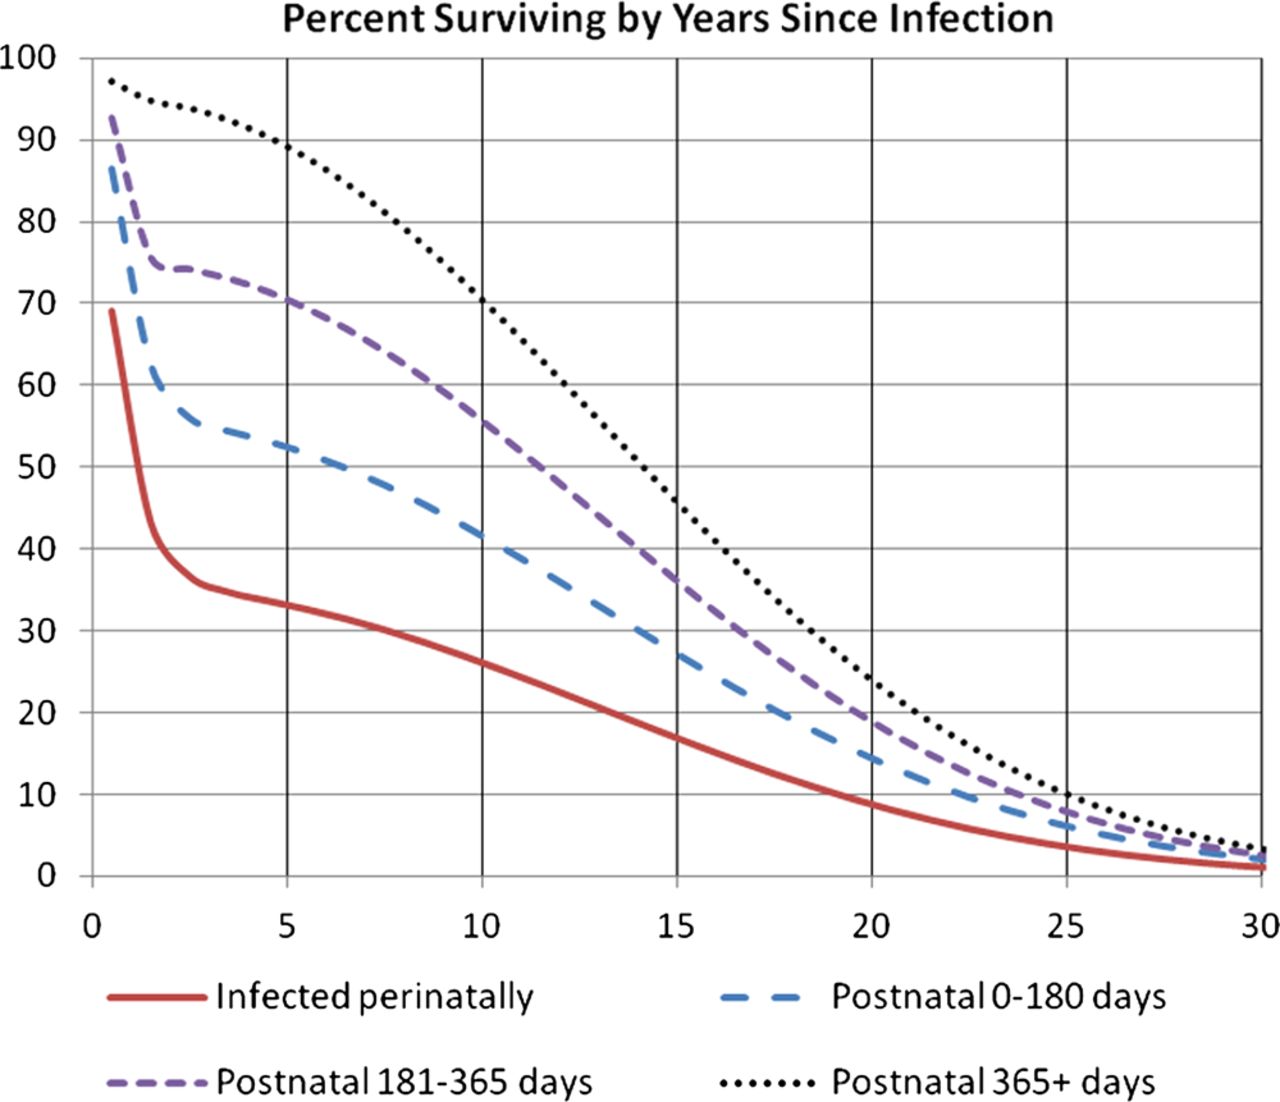
In the previous version of Spectrum two new survival curves for ‘AIDS only’ mortality of children were introduced, based on data from 12 sub-Saharan African clinical trials and studies: the first to represent children infected at birth, the second to represent those infected through breast feeding.1 ,16 Further analysis of these data gave strong evidence that survival of children infected through breast feeding improved the later they were infected. Double Weibull curves were fitted to the data allowing for time of infection to give a pattern of survival post infection for four groups: those infected at birth, at 28–179 days, 180–364 days and after 365. Similar curves representing the survival of HIV negative children from the equivalent time points were used to remove non-AIDS mortality. There is limited information about the survival of HIV infected children beyond 2.5 years, so as with the previous estimates it was assumed that beyond this point the survival for children would be equivalent to that of young adults infected at ages 15–24, with a median survival of 15 years.8 Survival is described as a double Weibull curve of the form:

where X=−1×(λ1×t)µ1 and Y=−1×(λ2 × t)µ2.
The parameter values are shown in table 2.
Parameter values for child survival patterns
The resulting curves give a median AIDS only survival of 1.1, 6.4, 11.5 and 14.1 years resulting in 9% survival at 20 years for those infected at birth and 14%, 19% and 24% for those infected through breast feeding at 28–179 days, 180–364 days and after 365 days (figure 4).
Percentage of HIV+ children surviving by number of years since infection.
These changes provide for greater accuracy in estimating child survival. They will usually result in higher estimates of the number of HIV+ children surviving to age 15.
Maternal aids deaths
In some countries AIDS may be a significant cause of death among pregnant women and those who have recently given birth. Maternal mortality is defined as maternity-related deaths during pregnancy and up to 42 days after birth. Spectrum estimates the number of AIDS deaths to women during this period so that they may be removed from calculations of the maternal death rate.
We assume that the rate of AIDS mortality is similar among all HIV+ women 15–49 and among those who are pregnant and 42 days postpartum. Therefore we first estimate the rate of AIDS mortality among pregnant women as AIDS deaths among women 15–49 (μf,15–49,t) divided by the number of HIV+ women 15–49 (If,15–49,t). We then multiply that rate by the number of HIV+ pregnant women (Pt). Finally we adjust the number of deaths for the period of pregnancy and 42 days postpartum, 0.865=(9 months of pregnancy×7 days per month+42 days postpartum)/365.

Regional uncertainty
Spectrum produces uncertainty estimates of key HIV indicators using Monte Carlo techniques to combine the uncertainty in adult incidence produced by EPP with uncertainty around other key assumptions, such as progression and death rates, which are based on global or regional values. No uncertainty is included for national programme statistics. The standard uncertainty analysis involves 1000 runs.17 Point estimates for individual countries are summed to produce regional and global estimates. The 2011 round of estimates includes a new approach to estimating the uncertainty bounds for these regional and global estimates. The 1000 Monte Carlo runs for each country use the same sequence of random numbers to select values for key assumptions. This ensures that the values for progression rates, for example, are the same across all countries for the first Monte Carlo run, the second run, the third run, etc. This approach assumes that the uncertainty in key epidemiological assumptions is perfectly correlated across countries. The incidence trends and the uncertainty associated with them are country specific. Thus there is no correlation across countries in the variation of incidence. Once the 1000 Monte Carlo runs are completed for each country, they can be summed across countries to produce 1000 estimates for each of the key indicators at the regional and global level. Medians and plausibility bounds are then calculated from these 1000 runs.
Conclusions
Spectrum has been developed to estimate the impact of the AIDS epidemic at the national level. It continues to be updated to incorporate the latest research findings and provide indicators needed for programme planning. Recent updates improve ease of use, accommodate a range of national guidelines on eligibility for treatment, incorporate the latest findings on mother-to-child transmission and child survival with HIV, and new procedures for estimating the uncertainty around regional and global estimates.
Key messages
-
EPP has now been integrated into Spectrum so that national HIV estimates can be prepared within a single program without the need to link between two separate programs.
-
A new adult model tracks the HIV population by CD4 count in order to allow changing definitions of antiretroviral treatment eligibility.
-
The child survival model has been updated to allow survival rates to depend on the timing of infection.
Acknowledgments
Updates to the Spectrum software have benefitted from feedback from national applications by country counterparts and collaborations with numerous individuals and organisations through the UNAIDS Reference Group on Estimates, Models and Projections.
References
Footnotes
-
Contributors JS, TB and MM all contributed to the writing and review of the paper. JS led the development of the Spectrum software. TB led the development of the EPP software. MM conducted the child survival analysis.
-
Funding Funding for this work was provided by UNAIDS and the Bill and Melinda Gates Foundation.
-
Competing interests None.
-
Provenance and peer review Commissioned; externally peer reviewed.
Open Access This is an Open Access article distributed in accordance with the Creative Commons Attribution Non Commercial (CC BY-NC 3.0) license, which permits others to distribute, remix, adapt, build upon this work non-commercially, and license their derivative works on different terms, provided the original work is properly cited and the use is non-commercial. See: http://creativecommons.org/licenses/by-nc/3.0/