Article Text

Abstract
This paper describes the software package Spectrum, which is a modular program that is used to examine the consequences of current trends and future program interventions in reproductive health. It is used to determine the consequences of the HIV/AIDS epidemic, including the number of people living with HIV/AIDS by age and sex, the number of AIDS deaths, and the number of orphans as a result of AIDS, as well as other demographic indicators of interest, such as life expectancy and <5 mortality. The core of Spectrum is a demographic projection model called DemProj, which projects the population by age and sex. Other modules interact with the demographic projection. The HIV/AIDS projections are added to the demographic projections using a module called AIDS Impact Model. This module uses the projection of adult HIV prevalence over time, which is prepared using the Estimation and Projection Package model or the projection workbook. It also requires assumptions about the epidemiology of HIV, including the ratio of female:male prevalence, the distribution of infection by age, the distribution of the time from infection until AIDS death, and the effect of HIV on fertility.
- AIM, AIDS Impact Model
- ART, antiretroviral therapy
- EPP, Estimation and Projection Package
- HIV
- Modelling
- AIDS
- Estimates
Statistics from Altmetric.com
Projections of adult HIV prevalence are prepared using the Estimation and Projection Package (EPP) for generalised epidemics and the estimation and projection workbooks for low level and concentrated epidemics, described in other papers in this supplement. The Spectrum Projection Package is used to determine the consequences of the prevalence projections, including the number of people living with HIV/AIDS by age and sex, the number of AIDS deaths, and the number of orphans as a result of AIDS, as well as other demographic indicators of interest, such as life expectancy and <5 mortality. The purpose of this paper is to describe the methodology and epidemic patterns used to project these consequences.
DESCRIPTION OF THE SOFTWARE
Spectrum is a modular program that is used to examine the consequences of current trends and future program interventions in reproductive health. Some of the components were first developed in the early 1980s (demography and family planning), while others were developed later. They were brought together into the Spectrum program starting in 1995. The program and manuals are updated regularly and are available in multiple languages. Spectrum has been used by planners, advocates, and researchers in both developing and developed countries for planning, awareness raising, and resource mobilisation. The core of Spectrum is a demographic projection model, called DemProj, that projects the population by age and sex. Other modules interact with the demographic projection. They can be used as required. These modules address a variety of issues including impacts of HIV/AIDS (AIDS Impact Model; AIM), resource allocation for HIV/AIDS programs (Goals), the cost effectiveness of programs to prevent mother to child transmission of HIV (PMTCT), options in family planning programs (FamPlan), adolescent reproductive health (NewGen), and the consequences of high fertility and rapid population growth (RAPID). Spectrum is a Windows based program that is designed for ease of use. It contains a database of population information that provides instant access to the population estimates and projections of the United Nations Population Division for all countries and regions of the world. Spectrum runs in many languages including English, French, Spanish, Arabic, and Russian. Complete manuals are available for all modules. The program and manuals can be downloaded from the Futures Group website at http://www.FuturesGroup.com. The Futures Group has developed Spectrum in collaboration with other organisations, including UNAIDS, WHO, and UNICEF, under funding from USAID and UNAIDS. The program and manuals are available free of charge.
DEMOGRAPHIC PROJECTIONS
The demographic projection component of Spectrum, DemProj, is a full featured cohort component projection model. The inputs are the population by age and sex in the base year, the total fertility rate over time, the age distribution of fertility, life expectancy at birth in the absence of AIDS, the age pattern of mortality, and the number and distribution by age and sex of international migrants. Several features are included to make the program easy to use for the non-demographer. One feature, called EasyProj, automatically creates a demographic projection for any country or region in the world. The projection can start in any year from 1950 to 2005 and extend as far as 2050. These estimates and projections are drawn from those prepared by the United Nations Population Division.1 The distribution of fertility and mortality by age can be set by selecting from a list of model life tables.
HIV/AIDS PROJECTION METHODOLOGY
The HIV/AIDS projections are added to the demographic projections using a module called AIM. This module uses the projection of adult HIV prevalence prepared using the EPP model or the projection workbook. It also requires assumptions about the epidemiology of HIV including the ratio of female to male prevalence, the distribution of infection by age, the distribution of the time from infection until AIDS death, and the effect of HIV on fertility.
The HIV/AIDS calculations are implemented by age and sex and are described fully in the AIM manual.2 A simplified version of the methodology is described here: the number of adults of age (a) and sex (s) infected with HIV in any year is simply the number of adults multiplied by the HIV prevalence:

The number of new infections each year is calculated as the number required to achieve the specified prevalence. Thus, new infections are calculated as the total number of infections expected in year t minus the number of infections surviving from the previous year. Surviving infections are the number of infections in the previous year minus deaths from AIDS or other causes occurring during the previous year:

AIDS deaths are a function of the number of new infections in previous years and the rate of progression from infection to death:

We assume HIV infected people are subject to the same hazard of mortality from causes other than AIDS as are people who are not infected.
Child infections occur when an HIV positive mother passes the infection to her child during gestation or birth or after birth through breastfeeding:

where HIVWRA is the number of HIV positive women of reproductive age; TFR is total fertility rate; TFRreduction is the reduction in fertility caused by HIV infection; and PTR is the perinatal transmission rate.
Children progress from infection to AIDS and death in the same manner as described above for adults, although the progression rates are different.
Spectrum also calculates the number of orphans, including orphans as a result of AIDS in countries in sub-Saharan Africa and orphans due to all causes, and maternal, paternal, and dual orphans by age and sex. The methodology has been confirmed by comparing the results with the findings of national surveys.3
EPIDEMIOLOGICAL PATTERNS FOR HIV/AIDS
Progression from HIV infection to AIDS death
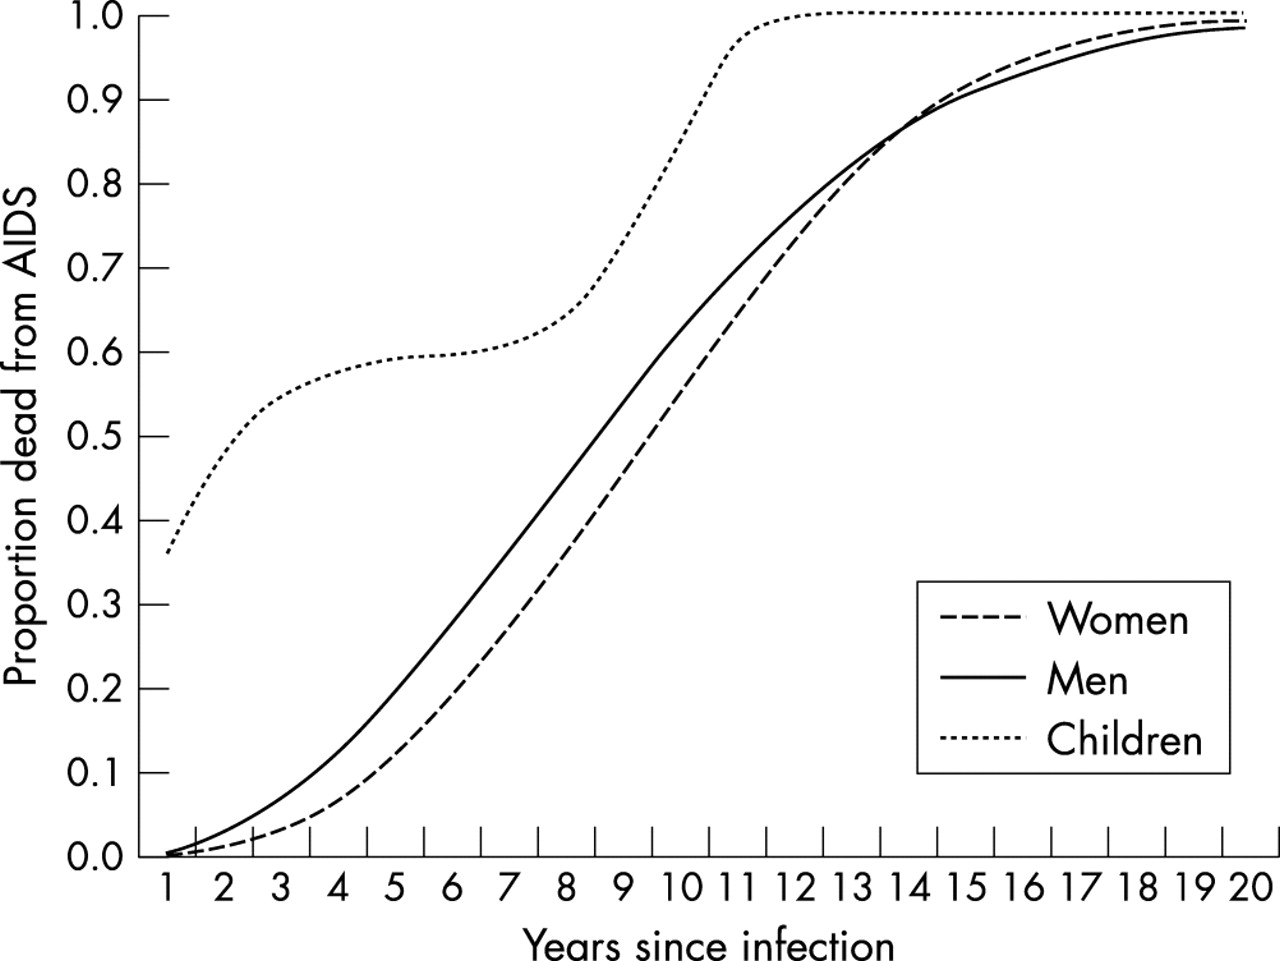
Recent reviews of the time from infection to death from AIDS in the absence of antiretroviral therapy (ART) are available for developing4 and developed countries.5 The progression period describes the amount of time that elapses from the time a person becomes infected with HIV until he or she dies from AIDS. AIM uses the cumulative distribution of the progression period. This distribution is defined as the cumulative proportion of people infected with HIV who will die from AIDS, by the number of years since infection. In line with these reviews, AIM has two default progression patterns available: fast (for developing countries) and slow (for industrialised countries). These patterns are based on the assumption that better health care leads to a somewhat longer survival period in industrialised countries. Thus, the median time from infection to death is assumed to be 9 years in developing countries (8.6 years for males and 9.4 years for females) and 11 years in industrialised countries. Survival times are assumed to follow a Weibull distribution in agreement with the available data. The pattern for developing countries is shown in fig 1.

Progression from infection to AIDS death for adults and children in the absence of competing causes of mortality.
Progression to AIDS death can be slowed by treatment with ART. In Spectrum, ART delays AIDS deaths for those who remain on it successfully. The survival of patients on ART depends on the quality of treatment and the patients’ status when starting ARTs. Average survival on ART has been estimated to range 3–7 years. The default assumption is that 80% of those on ART continue with it and survive into the following year. With an increasing number of people receiving ART, further research will provide more specific information in the future.
Children who are infected perinatally generally progress to AIDS faster than adults. A UNAIDS review of available evidence suggests that the survival is best described by a rapid progression from infection to death for some children and much slower progression for others.5 The default pattern used in AIM is shown in fig 1.
Sex ratio of HIV prevalence
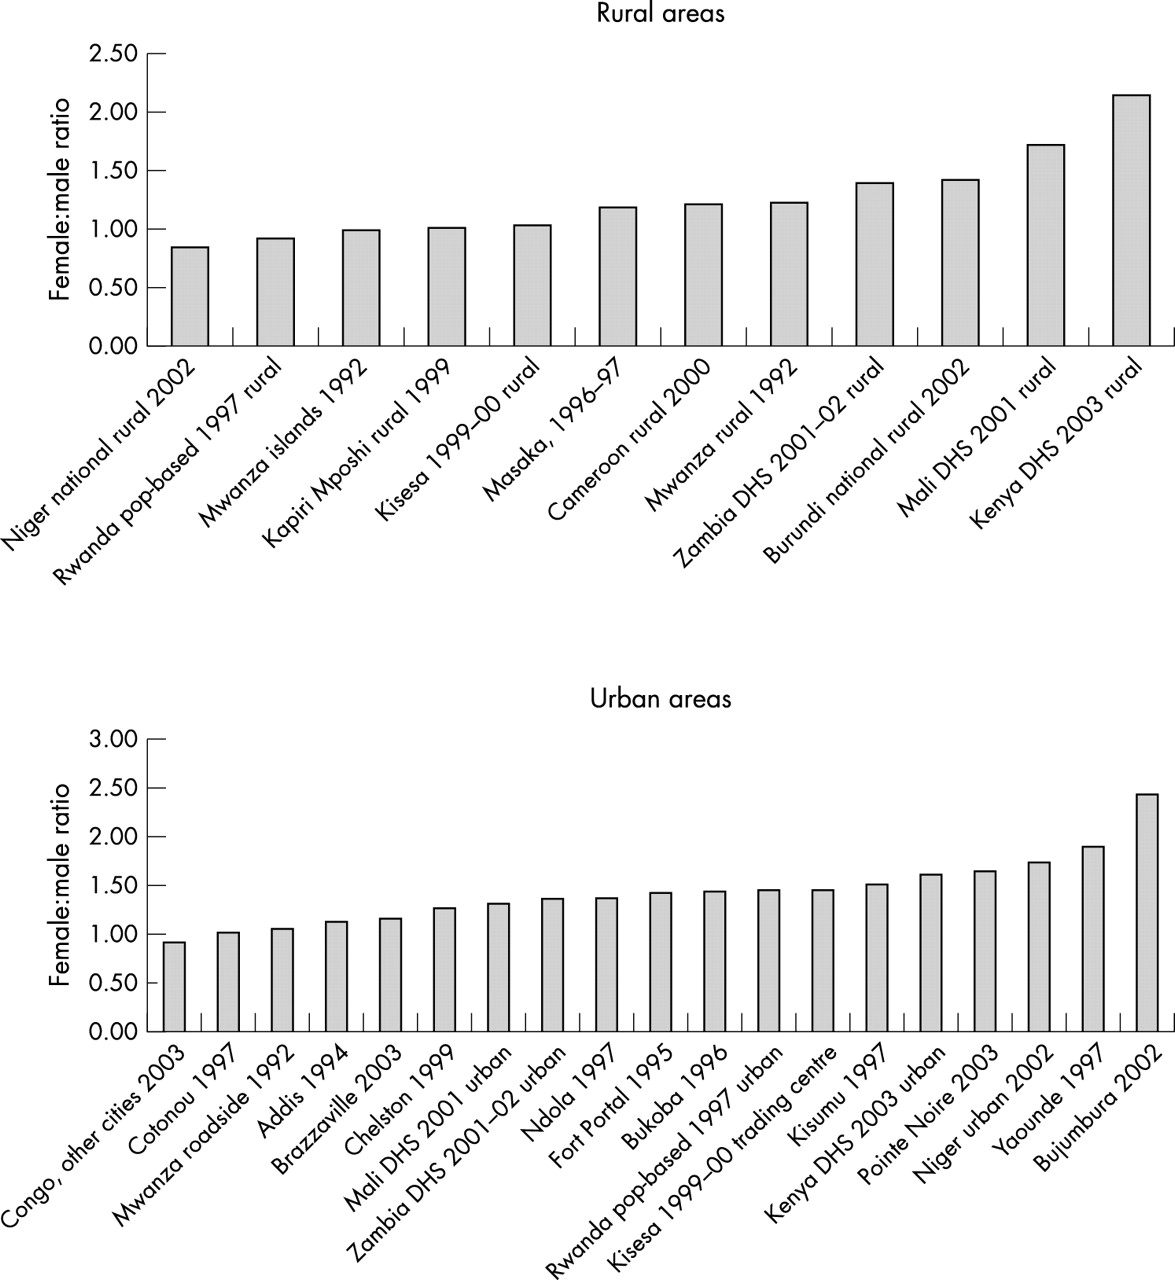
In generalised epidemics where most HIV transmission is through heterosexual contact there are usually many more male infections than female infections early in the epidemic but, over time, the number of female infections eventually exceeds the male infections. Spectrum uses a pattern based on data from population based surveys throughout Africa6–24 that indicate the ratio of female to male prevalence at different stages in the epidemic (see fig 2). The median female to male ratio is smaller in rural areas at 1.2 than in urban areas at 1.44, based on studies and national surveys in Benin, Burundi, Cameroon, Congo, Ethiopia, Kenya, Mali, Niger, Rwanda, Tanzania, Uganda, and Zambia. When weighted for rural (0.66) and urban (0.34) populations in sub-Saharan Africa, the weighted female to male ratio is 1.28. Together with studies in mixed urban and rural areas in Malawi,22 Zimbabwe,23 and South-Africa24 with female to male ratios of 1.22, 1.37, and 1.38, respectively, the overall female to male ratio in mature epidemics is set at 1.3. Data on the sex ratio of reported AIDS cases (from country reports to WHO) have been used to describe the early phases of the epidemic because no population based prevalence studies are available in the first 5 years of an epidemic. The pattern used in Spectrum starts with the ratio of female to male prevalence at 0.23 in the first year of the epidemic and rises to 1.3 by the 15th year of the epidemic (see fig 3).

Female to male prevalence ratios in rural and urban areas in studies conducted since 1990.

Model patterns of ratio of female to male prevalence over time.
For concentrated epidemics the estimates of the ratio of female to male prevalence are based on trends in reported AIDS cases for nine countries in Latin America and Asia. In this pattern the ratio of female to male prevalence starts at 0:12 at the beginning of the epidemic and increases gradually to 0:63 by the 30th year of the epidemic. These patterns are shown in fig 3.
Age distribution of HIV infection
A default pattern of the distribution of HIV infections by age has been developed from population based surveys6–24 and reported AIDS cases (fig 4). Where population prevalence data are available for a particular country the observed pattern can be substituted for the default pattern. In countries with several successive population prevalence surveys the age distribution of infection shifts to older ages as the epidemic progresses.25 This is a result of the aging of those infected and changing patterns of incidence due to changes in sexual behaviour, particularly among young people. Where such data are available, Spectrum allows the age pattern of infection to change over time.

Model pattern for age distribution of adult HIV prevalence.
Mother to child transmission of HIV
The perinatal transmission rate is the percentage of babies born to HIV infected mothers who are infected themselves. Studies have found that this percentage ranges about 13–32% in industrialised countries and 25–45% in developing countries.26,27 The higher rates have generally been found in studies in Africa, where a significant amount of transmission through breastfeeding may take place, and the lower figures have been found in western Europe. AIM uses a default value of 32%, typical of developing countries. If country specific studies are available, this figure can be changed. The rate of transmission can also be adjusted to reflect coverage and effectiveness of prevention of mother to child transmission (PMTCT) programs.
Fertility reduction due to HIV infection
Several studies have shown that HIV infection reduces fertility.28–31 The default pattern is that HIV reduces fertility by 30% for women age ⩾20. For women aged 15–19 the fact of HIV infection indicates that a woman is sexually active and thus more likely to become pregnant than uninfected women of the same age. For this age group we assume that fertility is 50% higher among HIV infected women.
STRENGTHS
Spectrum uses the prevalence projections made with other models to calculate the consequences of these projections. It produces key indicators of interest to program planners and policy makers, including the number of new infections, the number of people living with HIV/AIDS, AIDS deaths, and orphans. The program is easy to use, works in multiple languages, and has a full set of manuals and training materials. Default patterns have been developed for most input assumptions. These patterns are generally used in the UNAIDS estimates and projections, but can be changed by national teams as appropriate. These patterns are updated regularly after review by the UNAIDS Reference Group as new information becomes available.
Default values for assumptions (for example female to male ratio over time) can be selected for countries with generalised or concentrated epidemics or country specific patterns can be used if data are available. This ability to easily change assumptions also makes Spectrum very useful as a way to compare different assumptions on outcome measures in various scenarios. For example, it is easy to vary levels of coverage of prevention of mother to child transmission and compare the effects on <5 mortality. Furthermore, all the assumptions are visible and can be changed by the user if country specific data are available for some inputs, such as the age and sex distribution of HIV infection.
Because at its core Spectrum is a demographic projection model, it can display the key indicators by age and sex. The results are available not only in tabular format but also graphically. This makes it easy to investigate the effects of different prevalence trends and varying levels of coverage of antiretroviral programs for adults and children on such demographic variables as life expectancy, population structure, and orphans.
LIMITATIONS
Some of the model patterns used in Spectrum are based on a small number of studies. For example, the distribution of the progression from infection to death for adults is based primarily on the cohort study from Masaka, Uganda. The progression pattern for children is based on a few studies but none that has followed cohorts for the full 15 years. The model patterns used in Spectrum have been developed and reviewed by the UNAIDS Reference Group on Estimates, Models and Projections. They represent the best we can do with available data, but that database is not as complete as we would like.
Spectrum estimates incidence from the prevalence trends provided by EPP or the estimation and projection workbooks. Because the pattern of prevalence by age and sex is usually assumed to be constant over time, the age specific patterns of incidence may not be reliable. Work is continuing to develop a procedure to vary the patterns of age specific prevalence over time in order to better represent patterns of incidence by age.
The default age distribution of HIV infection among injecting drug users or men who have sex with men is based on limited data and is likely to vary from country to country. However, currently there are few data available to develop improved distributions.
CONCLUSIONS
Spectrum is an easy to use model that works in multiple languages and has been used widely by national programs. It works smoothly with the models that project HIV prevalence and incorporates the work of the UNAIDS Reference Group on Model Epidemiological Patterns. The ease of use features are important because the focus of UNAIDS efforts is on training national teams to prepare their own estimates and projections with these tools.
Acknowledgments
This paper was written by JS. It benefited from contributions and comments from Peter Ghys of UNAIDS and Neff Walker of UNICEF.
The Spectrum software, manuals, and training materials have been developed with funding from USAID. UNAIDS supported some modifications to add additional indicators of interest to national programs.