Article Text

Abstract
This paper describes an approach to making estimates and short term projections of future scenarios of HIV/AIDS in countries with low level and concentrated epidemics. This approach focuses on identifying populations which through their behaviour are at higher risk of infection with HIV or who are exposed through the risk behaviour of their sexual partners. Estimates of the size and HIV prevalence of these populations allow the total number of HIV infected people in a country or region to be estimated. Subsequently, assumptions about the possible level and timing of saturation of HIV prevalence among each population can be used to explore future scenarios of HIV prevalence. The basic structure of the software used to make estimates and projections is described. This software includes a set of consistency and audit checks to help exclude unrealistic projections. The paper also discusses the strengths and weakness to this approach to making estimates and projections of HIV/AIDS in countries with low level and concentrated epidemics.
- IDU, injecting drug user
- MSM, men who have sex with men
- HIV
- Modelling
- AIDS
- Estimates
Statistics from Altmetric.com
The workbook approach to making estimates and building future scenarios of HIV/AIDS prevalence was developed for use in countries with low level and concentrated epidemics. Unlike in countries where the epidemic has become generalised and data from pregnant women is used as a proxy for adult prevalence, there is no set of representative data that can be used to estimate adult prevalence in these countries. Instead the approach has been to develop estimates for populations who are most exposed to HIV/AIDS and then combined to produce an overall estimate of adult prevalence. The estimation and projection workbooks are a formalisation of a set of methods that Joint United Nations Programme on AIDS (UNAIDS)/World Health Organization (WHO) and many country programmes have used in making estimates1–4 and developing scenarios of HIV prevalence levels in countries with low level and concentrated epidemics.5 In concentrated epidemics HIV has spread rapidly in a defined sub-population, but is not well-established in the general population. This epidemic state suggests active networks of risk within the sub-population. The future course of the epidemic is determined by the frequency and nature of links between highly infected sub-populations and the general population (with a numerical proxy of HIV prevalence consistently over 5% in at least one defined sub-population, but below 1% in pregnant women in urban areas). In low level epidemics, levels of HIV prevalence are even lower with a numerical proxy of HIV prevalence not having consistently exceeded 5% in any defined sub-population. For countries with an epidemic level that is neither clearly generalised nor clearly concentrated, both methods can be applied. An early version of the projection workbook was used to produce regional projections made in 2001.6
DESCRIPTION OF THE SOFTWARE
The current software comes as a set of Excel workbooks and is currently available in English, French, Spanish, Russian, and Chinese. The first workbook is used to make point prevalence estimates; the second is used to develop an epidemic curve of adult HIV prevalence and to produce projection scenarios. The workbooks and supporting documentation, including manuals, are available from the websites of several organisations, including UNAIDS (http://www.unaids.org), WHO (http://www.who.int), and the Futures Group International (http://www.FuturesGroup.com).
POINT PREVALENCE WORKBOOK
Several critical decisions need to be made about how to structure the national estimate. These include defining the geographical structure of the epidemic that will be used in the estimates, identifying the groups most exposed to HIV/AIDS, and how to handle the spread of HIV to groups less exposed to HIV.
The first decision is how many geographically distinct epidemics and estimates will be made. This decision should be based on a mix of political, practical, and epidemiological considerations. In very large or geographically disparate countries, estimates should be made for each region. Even in smaller countries, politically, it may be helpful to have an estimate for a region or province. However, HIV prevalence and population size data must be available at the regional levels for these estimates to be meaningful. The workbooks are set up so that there can be up to 95 different regions.
Secondly, the groups or populations more exposed to HIV/AIDS must be defined for each region. While some populations at risk exist in almost all countries and regions (for example sex workers and their clients and men who have sex with men (MSM)), others will be specific to a country or region. For each of these populations, low and high estimates of the size and HIV prevalence of the population are required. The estimation workbook contains four default populations at risk: MSM, injecting drug users (IDUs), sex workers, and clients of sex workers. Additional populations can be added (for example prisoner, military, and migrant) and the default groups can be replaced if, for example, there are no IDUs in a country.
Thirdly, an approach must be selected to estimate prevalence in the population at lower exposure to HIV/AIDS. We assume zero risk of exposure to infection with HIV except due to sexual partnerships with individuals from high risk groups or through unsafe blood or serum transfusion practices or medical injections. For example, these could be spouses of clients of sex workers or IDUs. We ignore sexual transmission of HIV and transmission of HIV between individuals who are both from the lower risk populations.
Early on in concentrated epidemics, the number of people in the lower risk groups who have HIV will be very small, reflecting limited time for sexual transmission from their sexual partners. Over time, the number of people with HIV/AIDS in this group can be much larger, with the epidemic progressing to a generalised epidemic pattern in some cases. Early in the epidemic, estimates of the number of people with HIV/AIDS in this group may best be calculated by directly estimating sexual transmission. Later on in the epidemic, it may be better to use prevalence in low risk populations such as in pregnant women as the basis for the estimate. Both approaches can be tried, but only one will be included in the final estimate.
The total estimate of prevalence will be the sum of the number of people living with HIV/AIDS in populations at higher and lower levels of exposure to HIV from each region. An example of the workbook calculations is shown in fig 1.
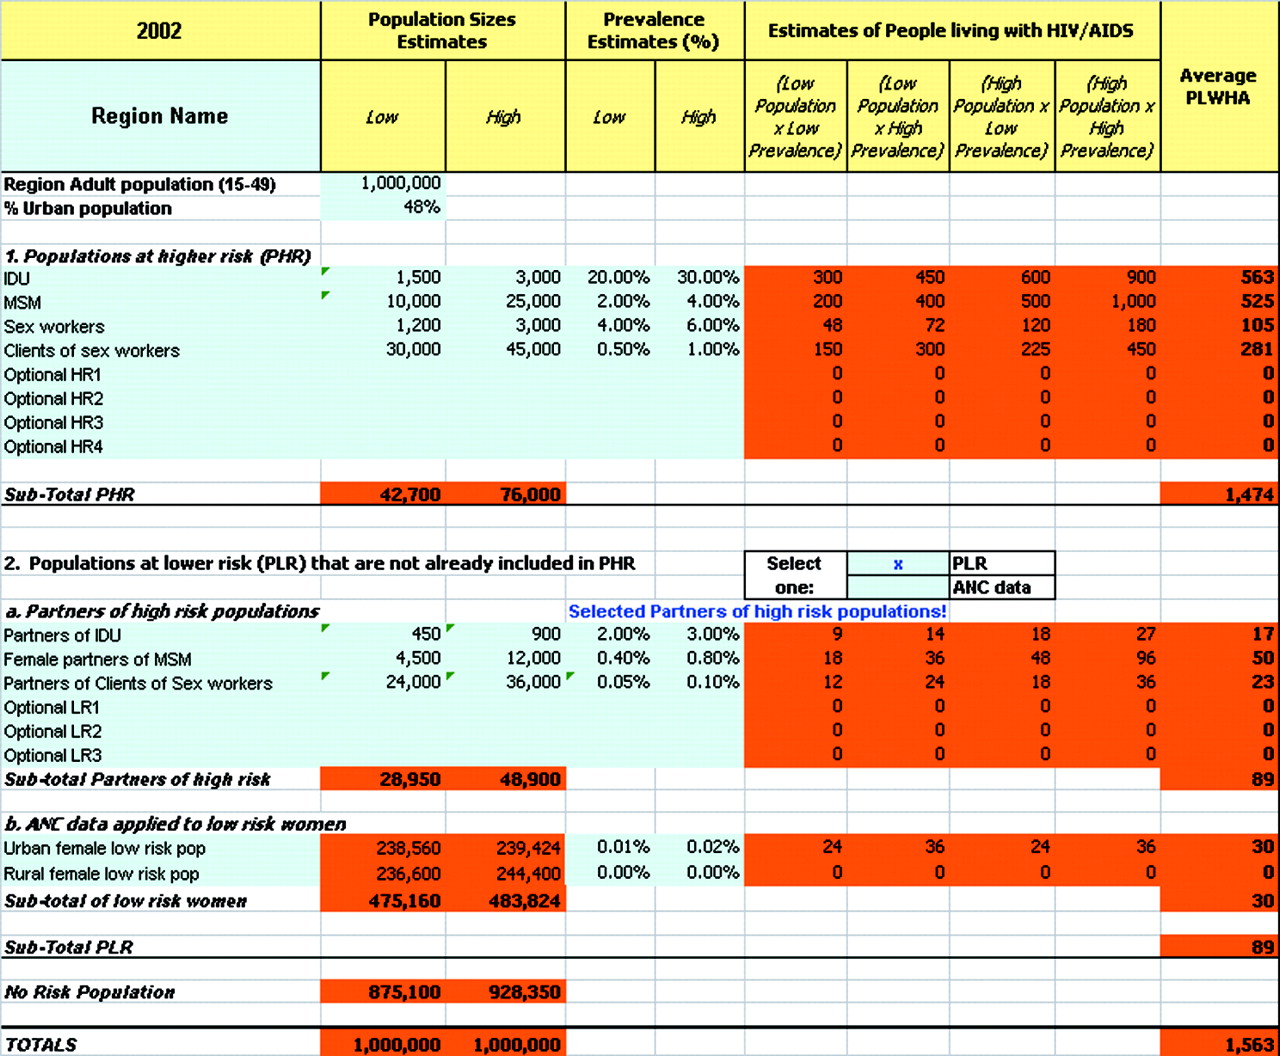
Structure of the estimation workbook.
PROJECTION SCENARIOS WORKBOOK
The projection workbook can be used to produce scenarios for the future course of the epidemic as well as an epidemic curve of adult HIV prevalence. The approach used to build the scenarios is to enter the basic information from the point prevalence workbook (exposed groups, estimates of population sizes, and prevalence) to establish prevalence in a base year. The impact of the timing and level at which HIV prevalence saturates among each of the exposed populations on future adult HIV prevalence can then be explored. Because no attempt is made to model heterosexual transmission within the lower risk populations, in countries where this occurs future prevalence scenarios will be conservative.
The projection workbook has the same basic structure as the point prevalence workbook, but with three additional pieces of information that are required. For both the total population and for each of the sub-populations used in the workbook the annual percentage change in population size must be estimated. These estimates may vary over time and are entered for five or ten year periods. In addition, for each population a peak prevalence level is required as well as the year that this prevalence level will be reached. This yields a scenario with adult prevalence and numbers of adults infected, plus numbers infected in each population over time.
The projection workbook fits a curve that asymptotically approaches saturation prevalence level in the specified year for each population. The number of adults living with HIV/AIDS over time can then be estimated.
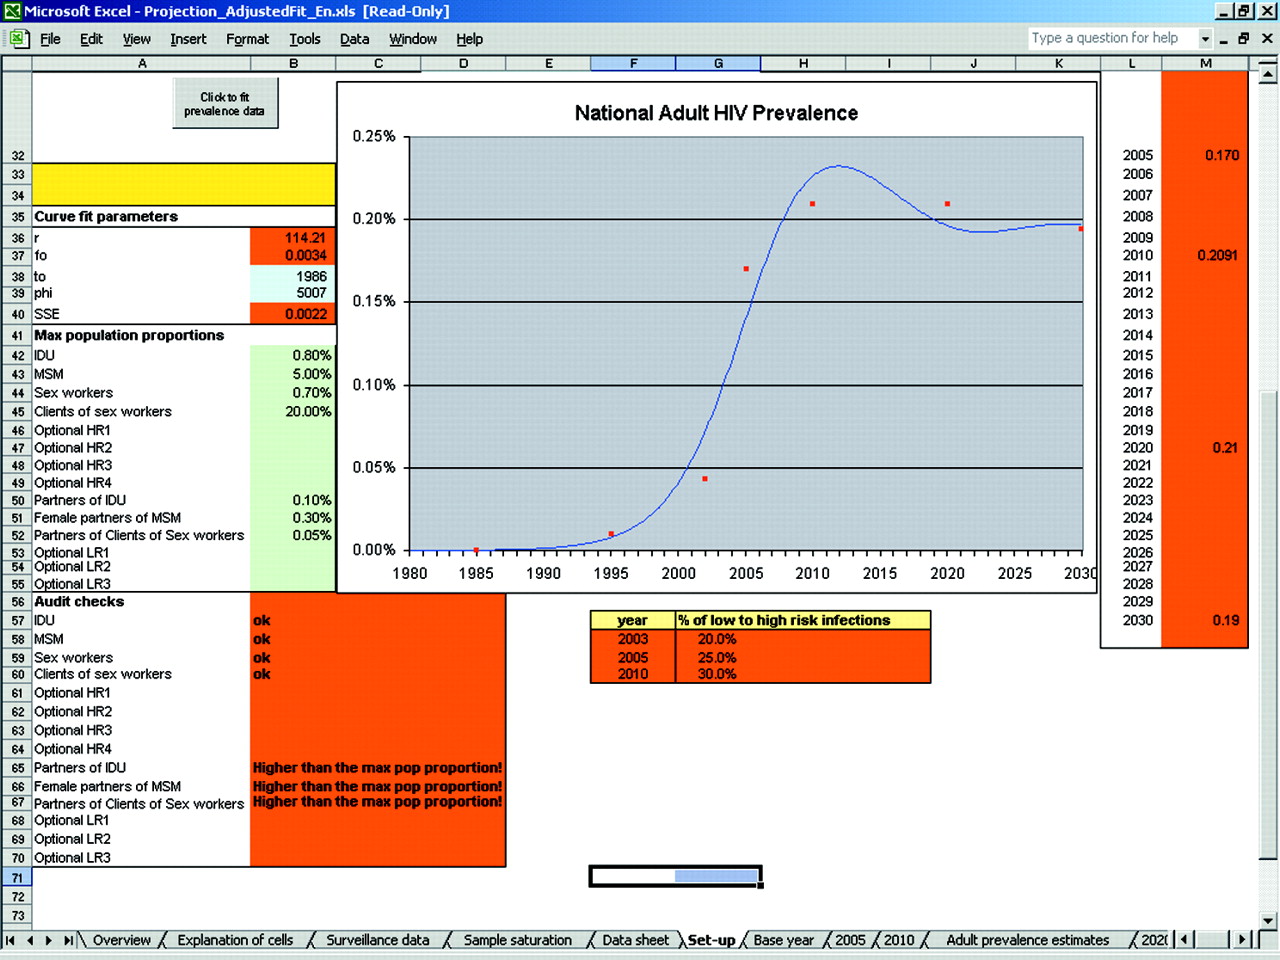
National estimates of HIV prevalence over time are smoothed by fitting an epidemic curve to all previous yearly estimates as well as projected prevalence points. The projection workbook also has a curve fitter for the national HIV prevalence (see fig 2). This curve fitter uses the same four parameter model that is used in the Estimation and Projection Package (EPP).7,8 The fitter uses as inputs both the projected national prevalence points (2005, 2010, 2020, 2030) and any point prevalence estimates made for previous years. This fitting process outputs a yearly national prevalence, using the national population for the base year and projected growth that can be used as an input for Spectrum. Although the fitting process goes out to 2030 (to allow for saturation in the various populations) we only recommend that programmes use five year projections, and even those with care. A key point to note about using this software to develop future scenarios is that it is not a model that captures the dynamics of the various sub-epidemics among groups at higher risk. Rather, it simply allows one to specify possible saturation levels and time to reach saturation to build possible future scenarios.
Projection sheet showing curve fitting and audit checking.
CONSISTENCY AND AUDIT CHECKS SYSTEM
The workbooks for both estimates and projection scenarios have a built in set of consistency and audit checks. These functions compare the estimates of population sizes (low and high) to regional averages and give warnings if values fall outside the range of values found in other countries. For example, the range of 2–5% of the male population aged 15–49 is used as the comparison value for the estimates of the size of population of the MSM.9 In addition to checking population sizes, the audit system also generates the ratio of the number of people infected in low risk populations to the number of high risk populations and the number of female to male infections. These are compared with ratios from other countries. None of the consistency and audit checks is meant to be proscriptive, rather, they are warning that the values used or produced fall out of the usual range of values and should be checked. These values of audits have been extracted from regional averages in countries with this kind of epidemic, which were collected and developed in a series of regional consultations.10
STRENGTHS
The primary strength in the workbook approach for both point prevalence estimates and projections/scenarios is the transparency in the process of making the estimates and building future scenarios. The workbooks clearly display the assumptions used in making the estimate or scenarios: which populations are most exposed to HIV, how large those populations are, and the current and projected prevalence in the various populations. The methodology is beneficial to plan the (re-)design of second generation surveillance systems because it makes explicit where surveillance data are lacking.
A second strength of the workbooks is the automatic consistency and audit checking system. This set of automatic checks helps eliminate many errors and forces one to reconsider values or outputs that are out of the usual range.
The use of state or regional spreadsheets and estimates for each of the regions is also very beneficial. Especially in populous and diverse countries, estimates based on median values for the country can mask large differences among regions. In addition, the production of estimates at the state or regional level can be useful in programming and implementation planning at these levels. Another strength of the approach is that it emphasises ranges for the estimates instead of a point estimate. This can be important as the certainty range around estimates for countries with low level and concentrated epidemics can be quite large. With this approach, countries are forced to make lower and higher estimates of population size and prevalence, thereby reinforcing the emphasis on the large range of certainty. The information in the workbook sheets serves as the basis to generate ranges of certainty as described in the accompanying paper.11 In addition, this approach results in a review and analysis of behavioural and serological data needed to understand the epidemic. In some ways, the analysis required to make the estimate may be more important than the estimate itself. It not only requires a review of all available data, but also identifies information gaps and requirements of an improved surveillance system.
Finally, we also feel that the use of Excel to develop the workbook has clear advantages over stand alone software packages. The workbooks build on a widely used application and most users in most countries are already familiar with the functioning of spreadsheets and can therefore easily alter the workbooks to fit their specific needs.
WEAKNESSES AND LIMITATIONS
The primary weakness of the estimation workbook method is the quality of data available when making the estimate. In particular, few countries have good estimates of the size of many populations most exposed to HIV/AIDS and often prevalence data for these groups are obtained among convenience samples. One group that is especially problematic is clients of sex workers. Although many countries do have estimates of the size of this population, few have a way to collect data on HIV prevalence in this group. Instead, prevalence data for other groups, such as male attendees of STI clinics, are used.
The approach also has the drawback that it does not explicitly deal with interactions of groups. As noted earlier, this approach to making an estimate or building a future scenario does not capture the dynamics of interactions of the multiple epidemics in various sub-populations which make up a national HIV epidemic. In making an estimate it uses a static representation of the epidemic. Even in developing the future scenarios it basically assumes various static states in the various sub-epidemics over time, with estimates of previous years and then the future scenarios based on saturation levels as separate, static estimates.
Another weakness is that these static representations of various time points in the epidemic cannot capture entrances into and exits from various groups at higher risk. For some of the populations at higher risk (for example sex workers and IDUs) people may only stay in the risk groups for a few years. These people may become infected and then no longer are represented in identified risk groups.
Another major limitation of this approach is that the curve fitting approach for the epidemics in each of the groups at higher risk cannot capture real epidemic curves that over time may have multiple inflection points. The approach used in the workbook limits an epidemic curve that asymptotically approaches a saturation prevalence level. Finally, it must be noted that, to date, there has been no prospective test of the validity of using this type of scenario building approach.
CONCLUSIONS
The workbook approach to making estimates of the number of adults living with HIV/AIDS is not new. It builds on the straightforward approach of identifying and estimating the size of groups exposed to HIV, estimating prevalence in those groups, and then combining them to get a national estimate of adult prevalence. The workbooks do, however, formalise the approach and also have built-in consistency and audit checks that help to insure that reasonable assumptions are used in making the estimate. The workbooks support the creation of regional or state level estimates, which can provide a better understanding of sub-epidemics in a country and can be more useful in providing information for programme planning at the local level.
As with the EPP,8 a major advantage of the workbook approach to making estimates and building future scenarios in countries with low level and concentrated epidemics is that it promotes a consistent set of methods that can be used by countries, thereby yielding estimates that are more comparable. Also, as the process of using the workbooks forces one to identify groups that are exposed to HIV and then estimate the size and prevalence of these populations, it promotes a more thorough analysis and understanding of the dynamics of the HIV/AIDS epidemic in countries. However, the workbooks do not produce a dynamic representation of HIV epidemics. Its use should be limited to developing estimates only in countries where there are insufficient time series data in sub-populations that would allow for use of models such as EPP,8 which would more accurately capture the dynamics of HIV epidemics. Estimates and future scenarios developed using this approach and these tools should not be viewed as a final product or to produce a full understanding of an HIV epidemic. Rather, they are simply a first step in the process.
Acknowledgments
The authors would like to acknowledge the work of the people who have participated in the meetings of the UNAIDS Reference Group on Estimates, Projections and Modeling in recent years. The authors would also like to acknowledge the contributions from members of national AIDS programmes who have used earlier versions of the workbooks and have made suggestions for improvements that have been incorporated into the current version.
AUTHOR CONTRIBUTIONS All of the authors worked in developing early versions of this software. NG and JS worked to incorporate the curve fitting approaches used in the EPP into these spreadsheet models. Also, all of the authors participated in initial training workshops using these tools that were then used to refine the software. NW was responsible for drafting the initial version of the paper.