Article Text

Abstract
Feasible epidemiological approaches are required to make a better assessment of the stage of an epidemic and to monitor its transition through various phases. Application of the Lorenz curve and Gini coefficient to summarise the inequality in STD incidence rates between jurisdictions in Manitoba, Canada, was found to provide useful insights into the concentration of these epidemics over time and thus their transition through epidemic phases. Further exploration of the statistical properties of these and other indices of inequality and their potential application to STD epidemiology is warranted. New epidemiological tools are also required for better monitoring of the impact of prevention and control activities and to inform the content of these activities.
- sexually transmitted disease
- Canada
- epidemiology
Statistics from Altmetric.com
A s in many populations worldwide, the epidemiology of sexually transmitted diseases in the Canadian province of Manitoba (population 1.14 million) has been evolving in recent decades. There are undoubtedly diverse factors that have influenced this evolution, including the changing socioeconomic and demographic characteristics of the population, altered patterns of risk behaviours, emerging social and sexual networks, and the introduction of various disease prevention and control activities. The cumulative result of these changes has been a substantial overall decline in the incidence of bacterial sexually transmitted disease (STD). However, the decline in STD rates has not been uniform. Instead, STDs have been concentrating into certain subpopulations and geographical regions of the province. Recently, the historic decline in STD rates has levelled and may even be reversing. As a result, it has become clear that new prevention and control strategies will be required. Specifically, there is a need to respond to the changing phases of the epidemics and to become increasingly mindful of the specific underlying and proximate determinants that are helping to maintain relatively high rates of STDs in some populations.
In this paper, we present a descriptive analysis of the chlamydia and gonorrhoea epidemics in Manitoba, focusing on geographical variations and trends over time. Our interest in examining geographical variations is threefold. First, it provides us with information that can help us to understand areas of highest risk, so that prevention and control activities can be targeted appropriately. Second, this type of analysis can be accomplished with routinely collected surveillance data and does not require more intensive data gathering activities, such as those required to delineate sexual networks. Third, we believe that a careful study of these geographical variations can provide valuable insights into the evolution of these pathogens through various epidemic phases, and the impact of programmatic activities on this evolution.
Our reasoning is based largely on our previous empiric findings1 and on the theoretical framework proposed by Wasserheit and Aral.2 In their framework, a new sexually transmitted infection is most likely first to be introduced and disseminated within populations in which STDs are efficiently transmitted. These are characterised by high rates of sexual partner change, concurrent partnerships, and efficient sexual networks. From an epidemiological perspective, it seems likely this initial “growth” phase of an epidemic would be characterised by a high degree of geographical variability in disease rates, with the highest rates focused in geographical areas characterised by features such as a relatively large population of young, single persons, high population density, low socioeconomic status, and poorer access to health care.
Following the initial “growth” epidemic phase, in the absence of effective prevention and control activities, STDs will disseminate more broadly within the population. The rapidity of spread will differ between pathogens as it will be influenced by characteristics such as the transmissibility, duration of infectiousness, and clinical features.
Epidemiologically, this transition to a “hyperendemic” epidemic phase is likely to be characterised by a decrease in the geographical variability of disease rates, as a wider segment of the population will be infected. Once a population recognises and reacts to an STD epidemic with effective individual and programmatic preventive and control activities, the overall incidence will decrease, marking the beginning of the “decline” phase. We propose that the decline phase will be characterised by a return to greater geographical variability, because the prevention and control activities will initially have a greater impact on some populations than others. Specifically, one might expect that during the decline phase, STDs would again be concentrated into those areas where prevention and control activities have been less effective. Finally, if prevention and control activities are sustained and are effective in reducing the incidence of STDs to a low level throughout the population (“endemic” phase), this would be characterised by a high degree of geographical concentration. However, at this stage the geographical distribution may become less predictable as much of the disease transmission would reflect sporadic outbreaks following the introduction of disease into specific sexual networks.
METHODS
For this paper, we have segmented the province geographically in two ways. First, we have segmented it into large geographical regions based on the provincial regional health authorities (RHAs). There are 11 rural health authorities and one urban health authority (serving the city of Winnipeg). We have excluded one RHA in the subarctic region of the province (Churchill) as it has a population of only 500 and largely serves the Inuit people of the non-Manitoba territory of Nunavut. We have further divided the remaining rural RHAs into two groups: (1) the north/remote region, which includes three RHAs; (2) the south rural region, which comprises the remaining seven rural RHAs (fig 1A). The city of Winnipeg has also been divided into two main areas, the inner city “core” and the “non-core” (fig 1B).

(A) Map of Manitoba regions. (B) Map of Winnipeg areas.
For a finer geographical breakdown, we have used 51 Manitoba postal forward sortation areas (FSAs) (32 in Winnipeg and 19 in rural areas), which remained consistent between 1989 and 1998. We excluded four FSAs that were added between 1989 and 1998 and had few STD cases, and another two FSAs that were primarily industrial and had populations of less than 500.
Data sources
The Manitoba communicable disease surveillance database was the source of all STD data. All cases of chlamydia and gonorrhoea are notifiable to the provincial health department by both physicians and laboratories under the provincial Public Health Act. Since laboratories in the province routinely report all positive diagnostic tests for chlamydia and gonorrhoea, few laboratory confirmed cases are unreported. In Winnipeg, there are specially trained public health nurses who interview and conduct contact tracing for most persons infected with chlamydia or gonorrhoea. Sexual contacts of those with chlamydia and gonorrhoea are also notifiable to the provincial health department. As a result, the provincial surveillance databases are considered to be virtually complete for diagnosed cases of these two infections. There are undoubtedly many undiagnosed infections that are not captured in the surveillance system. The extent of this undiagnosed disease burden is unknown.
Analysis
Incidence rates for gonorrhoea and chlamydia infections were calculated using the mid-year populations as denominators. Crude rates are presented for overall Manitoba incidence and trends over time in overall rates. Age standardised rates (standardised by direct method to the Manitoba population for the current year) are presented for inter-regional comparisons.
We used Lorenz curves and the corresponding Gini coefficients to formally analyse the small area geographical variability (and degree of geographical concentration) in STD incidence rates.3 The Lorenz curve is one of several methods that has previously been used to illustrate inequality in individual level variables such as income (plotting cumulative income categories against cumulative population), and the Gini coefficient (representing twice the area under the Lorenz curve) is a summary index of this inequality, ranging from 0 (absolute equality) to 1 (absolute inequality).4–6 We applied these non-parametric measures of inequality in an ecological manner to illustrate the inequality in community STD rates, by plotting the relative age adjusted incidence rates of chlamydia and gonorrhoea of the 51 FSAs against the cumulative fraction of all communities.
RESULTS
Overall incidence and trends
Among Canada's provinces (excluding the northern territories), Manitoba has the highest reported incidence of both chlamydia and gonorrhoea. In 1998, the rate of reported chlamydia cases in Manitoba was more than twice the national average (275 v 130 per 100 000) and the rate of reported gonorrhoea cases was three times the national average (54 v 17 per 100 000). It is not certain whether the higher rates reported in Manitoba truly reflect a higher burden of disease or better case reporting owing to its highly centralised and comprehensive surveillance system, or both. However, there is indirect evidence that the burden of illness is indeed higher as the hospital admission rate for pelvic inflammatory disease in Manitoba is almost twice the national average (94 v 50 per 100 000).
The incidence of reported chlamydia and gonorrhoea cases declined substantially during the 1980s and 1990s in Manitoba. For chlamydia, trends are known back to the late 1980s, when a pathogen specific control programme and surveillance system was introduced in the province. Between 1988 and 1999, the incidence of chlamydia declined substantially among both women (from 780 to 362 per 100 000) and men (from 300 to 153 per 100 000, fig 2). Most of this decline occurred between 1988 and 1992—the first several years of the chlamydia control programme. Between 1993 and 1997 the incidence rate of chlamydia plateaued, and increased slightly between 1997 and 1999. The recent increase is partially but not completely accounted for by the introduction of more sensitive amplification diagnostic techniques in late 1997. In summary, it is apparent that after a rapid decline shortly after the introduction of control measures, provincial chlamydia rates have now stabilised.
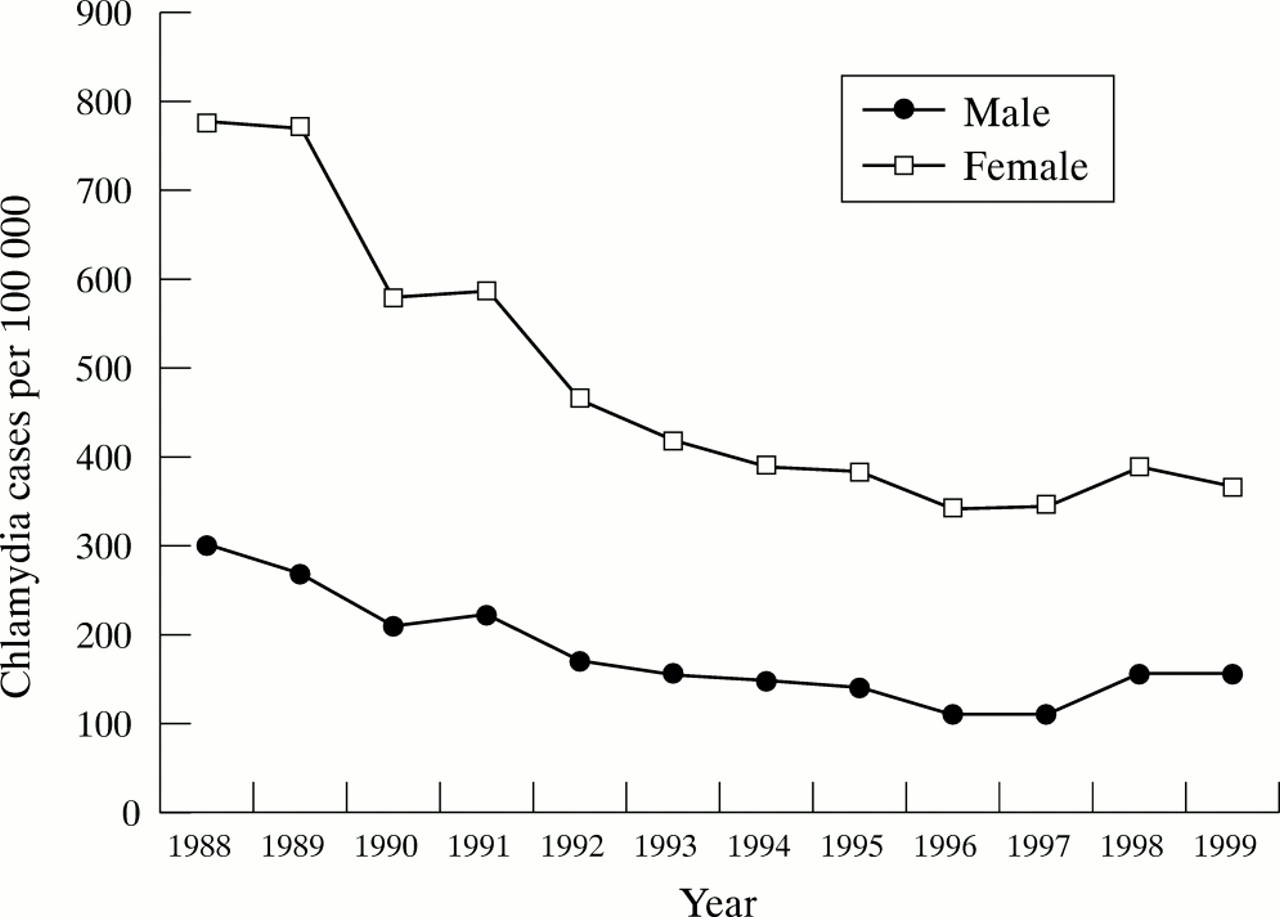
Incidence (per 100 000) of reported cases of chlamydia by sex, Manitoba 1988–99
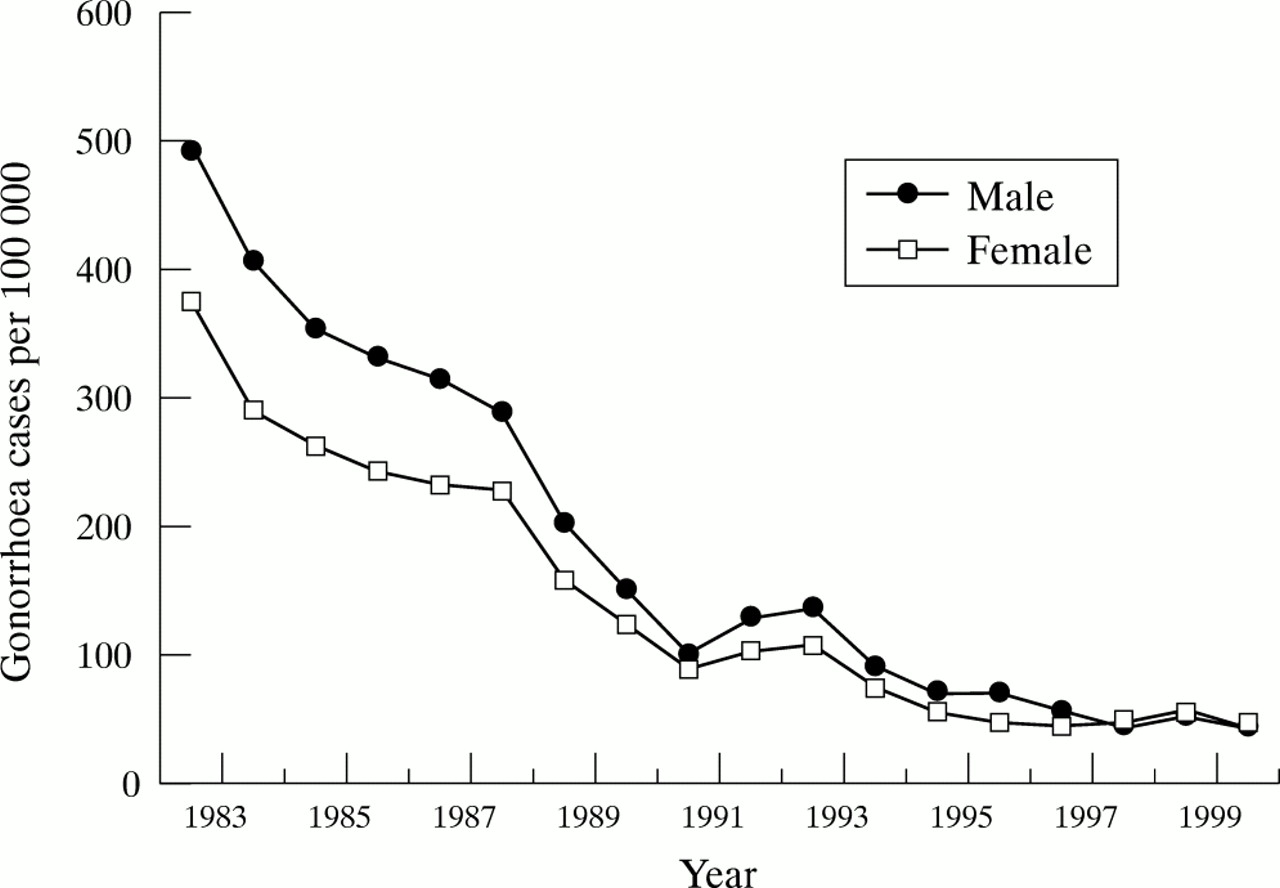
Surveillance data are available for a longer time period for gonorrhoea. Beginning in the early 1980s, there has been a substantial decline in the incidence rates of gonorrhoea over the past two decades. Between 1982 and 1999, the incidence decreased from 494 to 43 per 100 000 among men and from 376 to 45 per 100 000 among women (fig 3). The decline in gonorrhoea incidence was rapid and sustained through the 1980s. However, the decline has plateaued in recent years and there has been a slight increase in the last couple of years. For chlamydia, the increase is likely to be partly attributable to the introduction of more sensitive amplification diagnostics in mid-1997, but this does not explain the plateauing of rates through the 1990s.

Incidence (per 100 000) of reported cases of gonorrhoea by sex, Manitoba 1982–99.
Regional variations
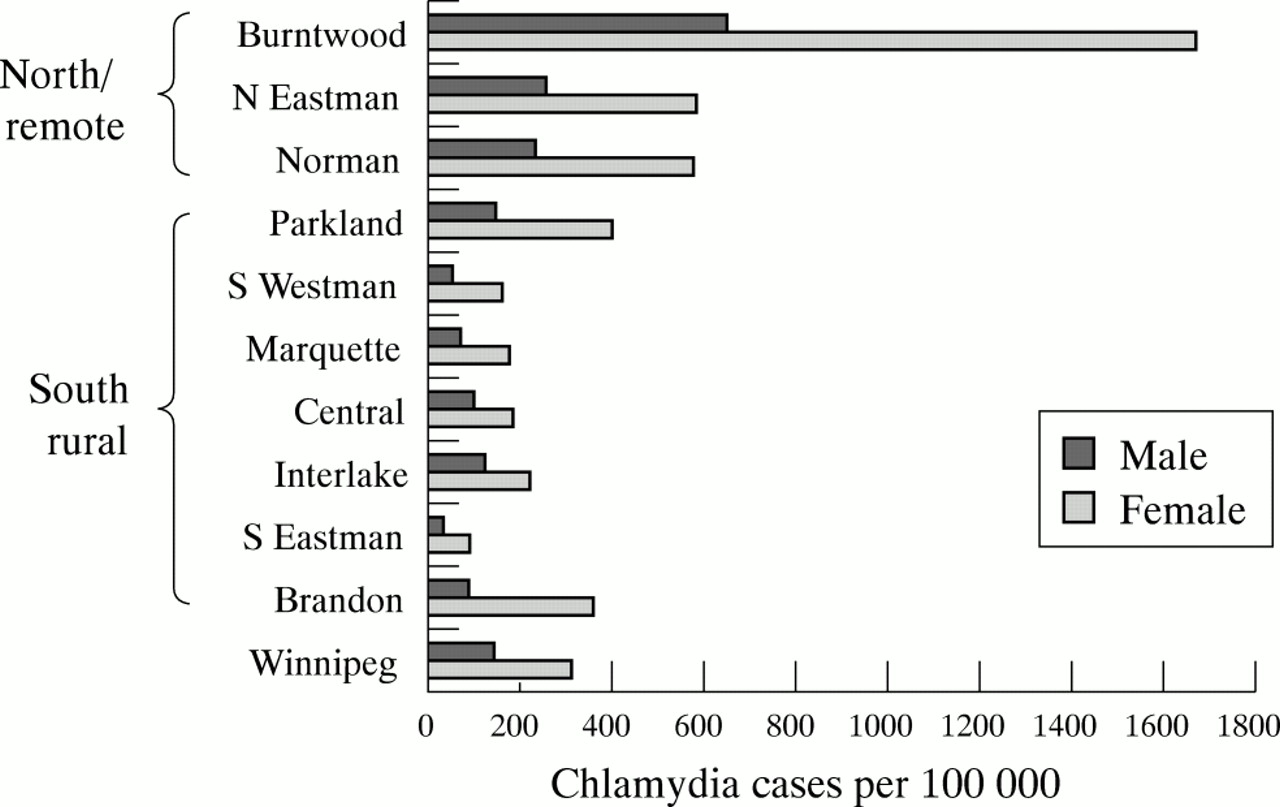
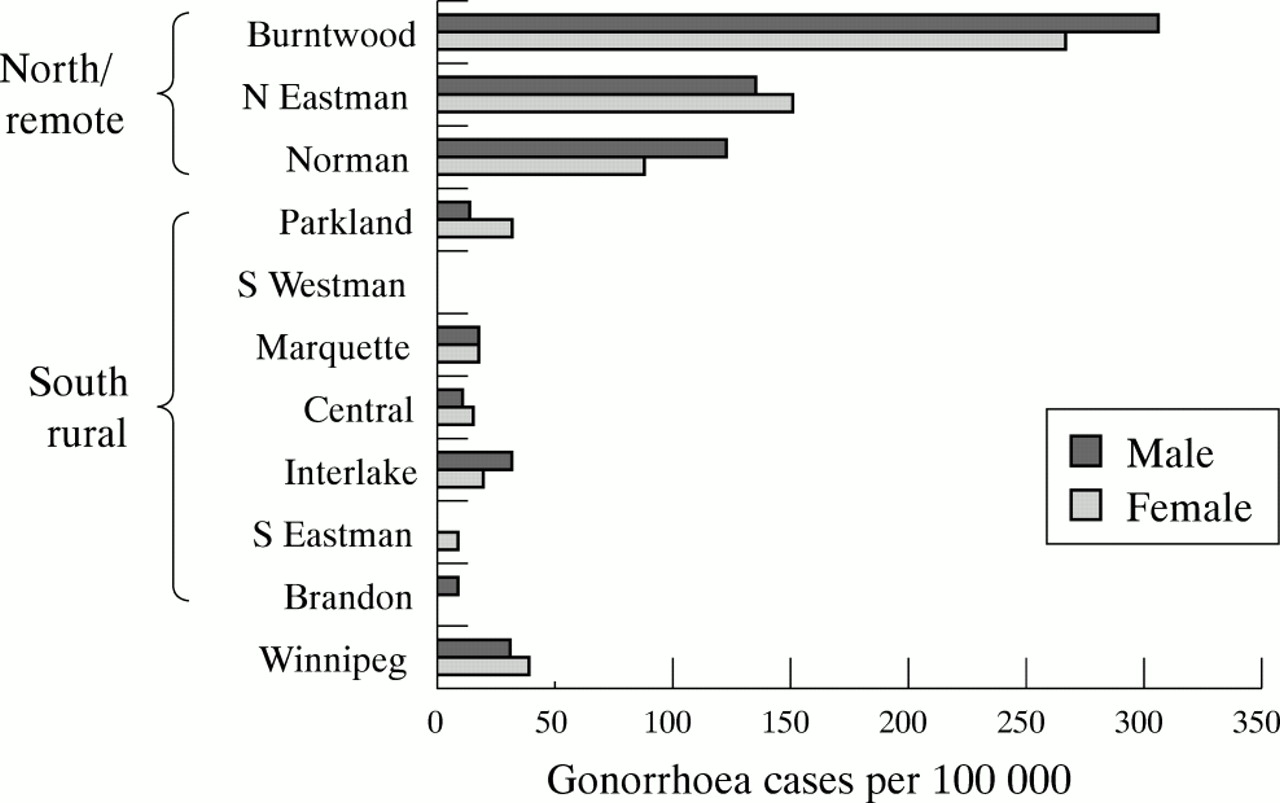
Perhaps the most striking feature of the epidemiology of chlamydia and gonorrhoea in Manitoba is the high level of geographical variation in their incidence, which we have reported previously.1 From a regional perspective, the incidence of these infections tends to be highest in the north/remote regions and lowest in the south rural regions (figs 4 and 5). The regional variability is greater for gonorrhoea than for chlamydia, gonorrhoea rates being much higher in the north/remote regions than in the city of Winnipeg or in the south rural regions, where the rates are the lowest.

Incidence of reported chlamydia infections by Manitoba region, 1999.

Incidence of reported gonorrhoea infections by Manitoba region, 1999.
Between 1991 and 1998, the incidence and number of reported cases of chlamydia declined substantially in all regions except the north/remote (fig 6). As a result, the percentage of chlamydia cases occurring in the north/remote regions increased from 21% in 1991 to 31% in 1998 (fig 7). The most pronounced declines were in the urban non-core areas, whose share of the provincial cases declined from 46% in 1991 to 40% in 1998. There was also a decline in the proportion of cases occurring in the urban core areas from 14% to 11%.
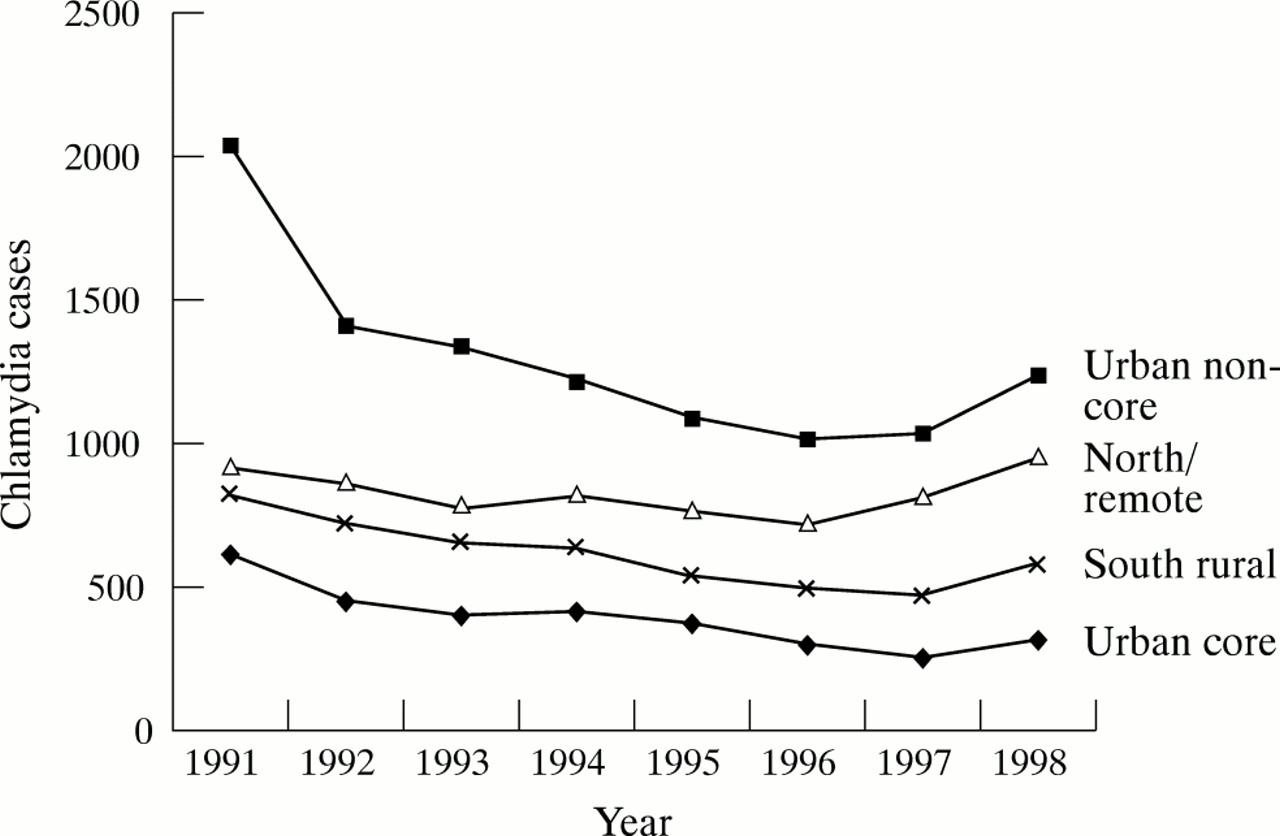
Number of reported chlamydia cases by Manitoba region by year, 1991–98.

Distribution of reported chlamydia cases by Manitoba region, 1991 and 1998.
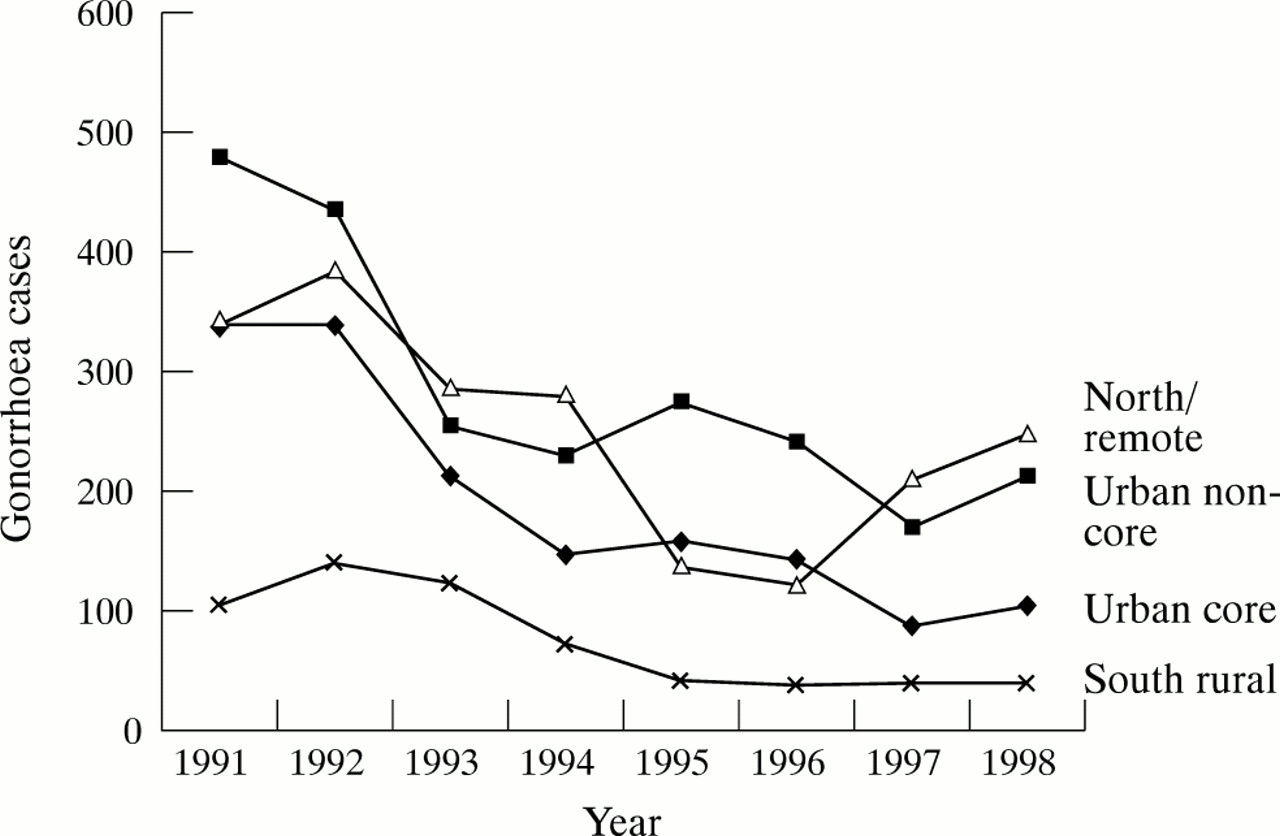
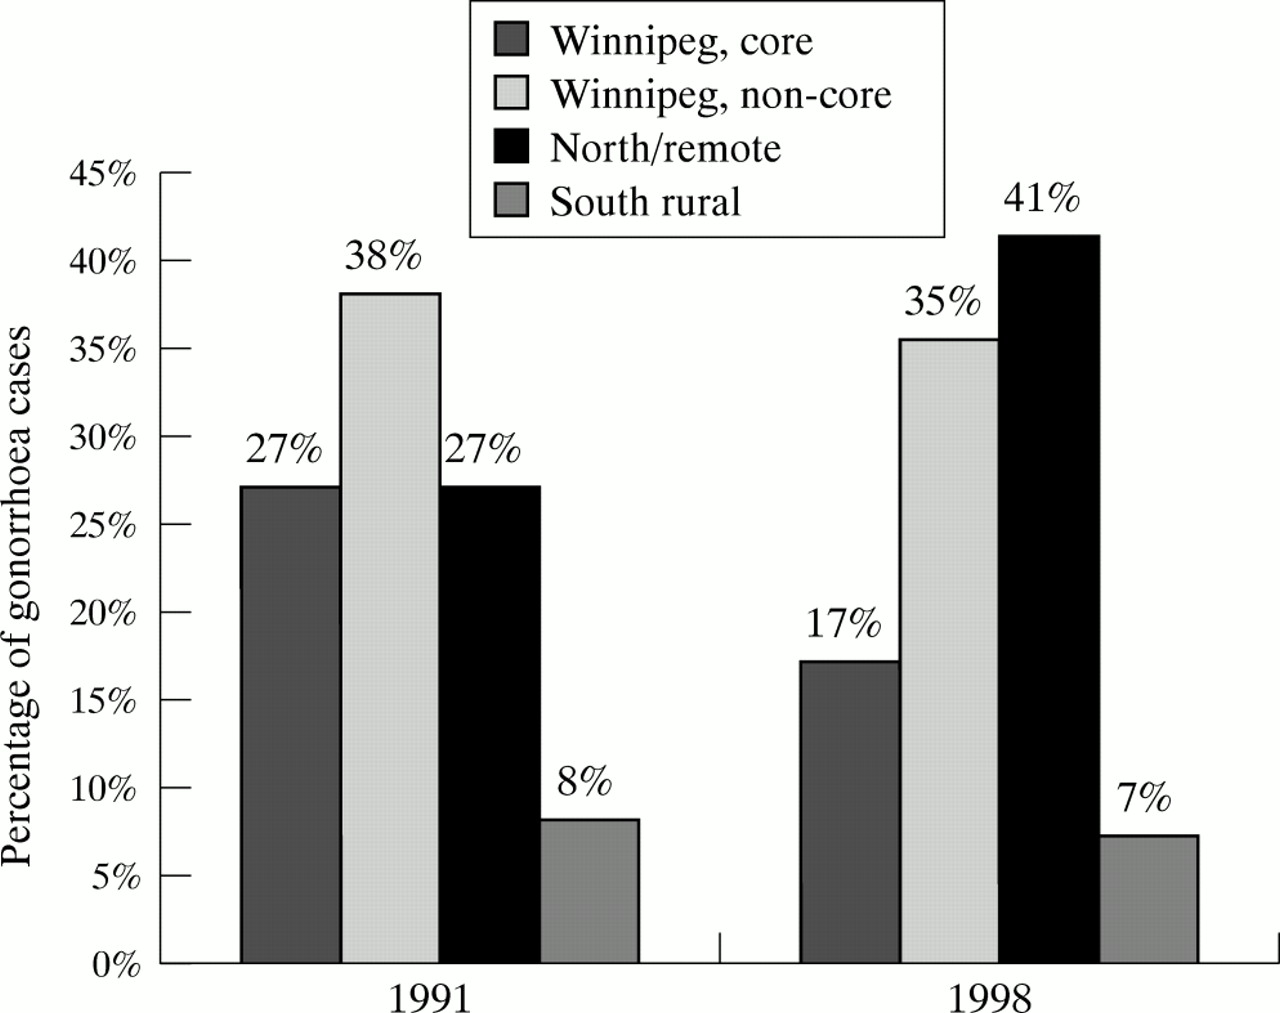
Although there were overall declines in the incidence of reported cases of gonorrhoea in all regions between 1991 and 1998, the declines were the least impressive in the north/remote regions (fig 8). In fact, there were notable increases in the north/remote regions in 1997 and 1998. The most substantial declines were observed in the urban core and non-core regions. As a result, the regional distribution of cases changed dramatically between 1991 and 1998 (fig 9). The proportion of cases occurring in the north/remote region increased from 27% to 41%. During that same time period, the proportion of cases occurring in the urban core region declined from 27% to 17%, with smaller declines in the urban non-core and south rural regions.

The number of reported cases of gonorrhoea by Manitoba region, 1991–98.

Distribution of reported gonorrhoea cases by Manitoba region, 1991 and 1998.
Small area variations
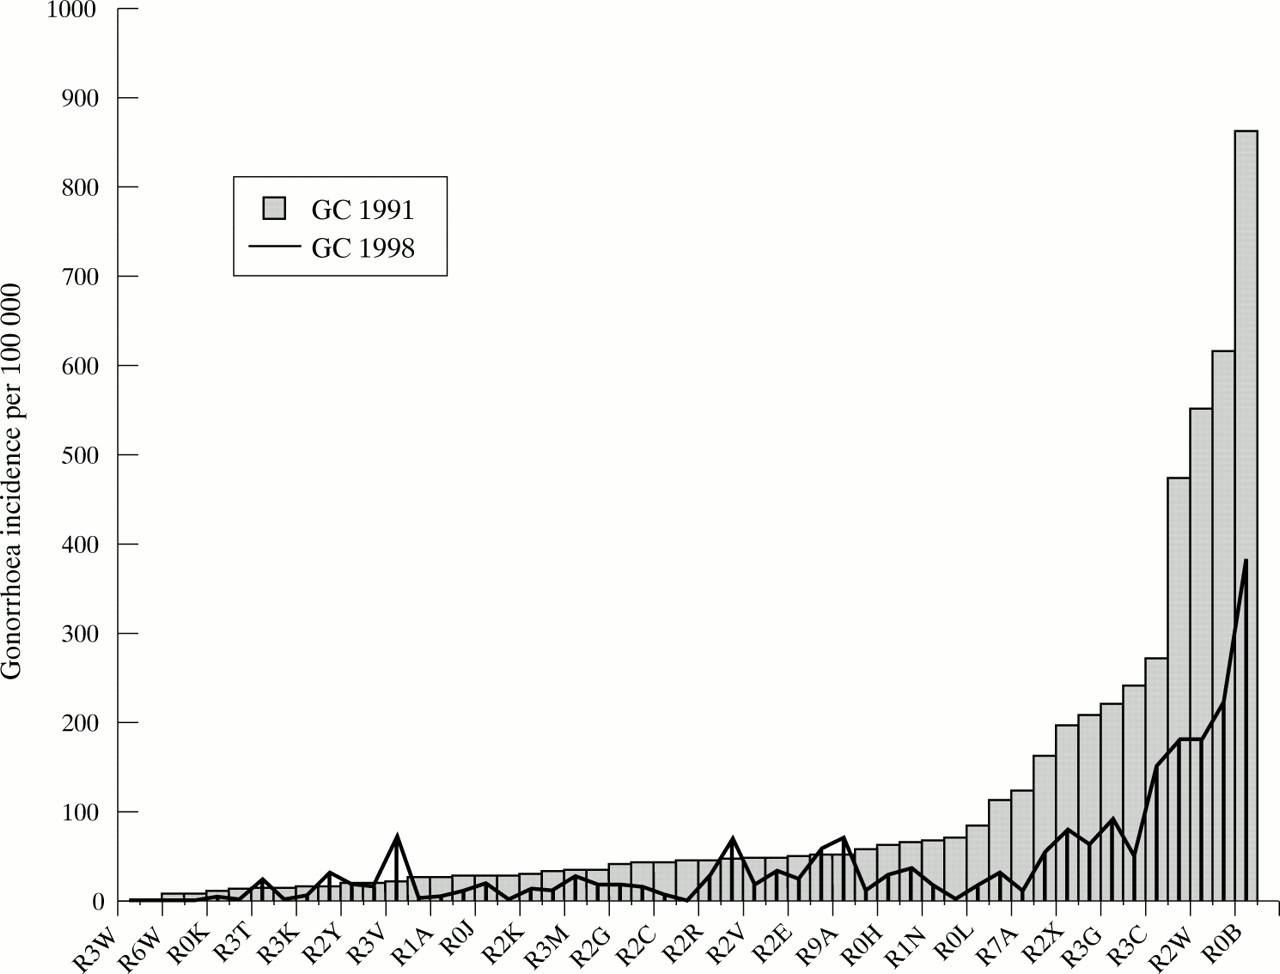
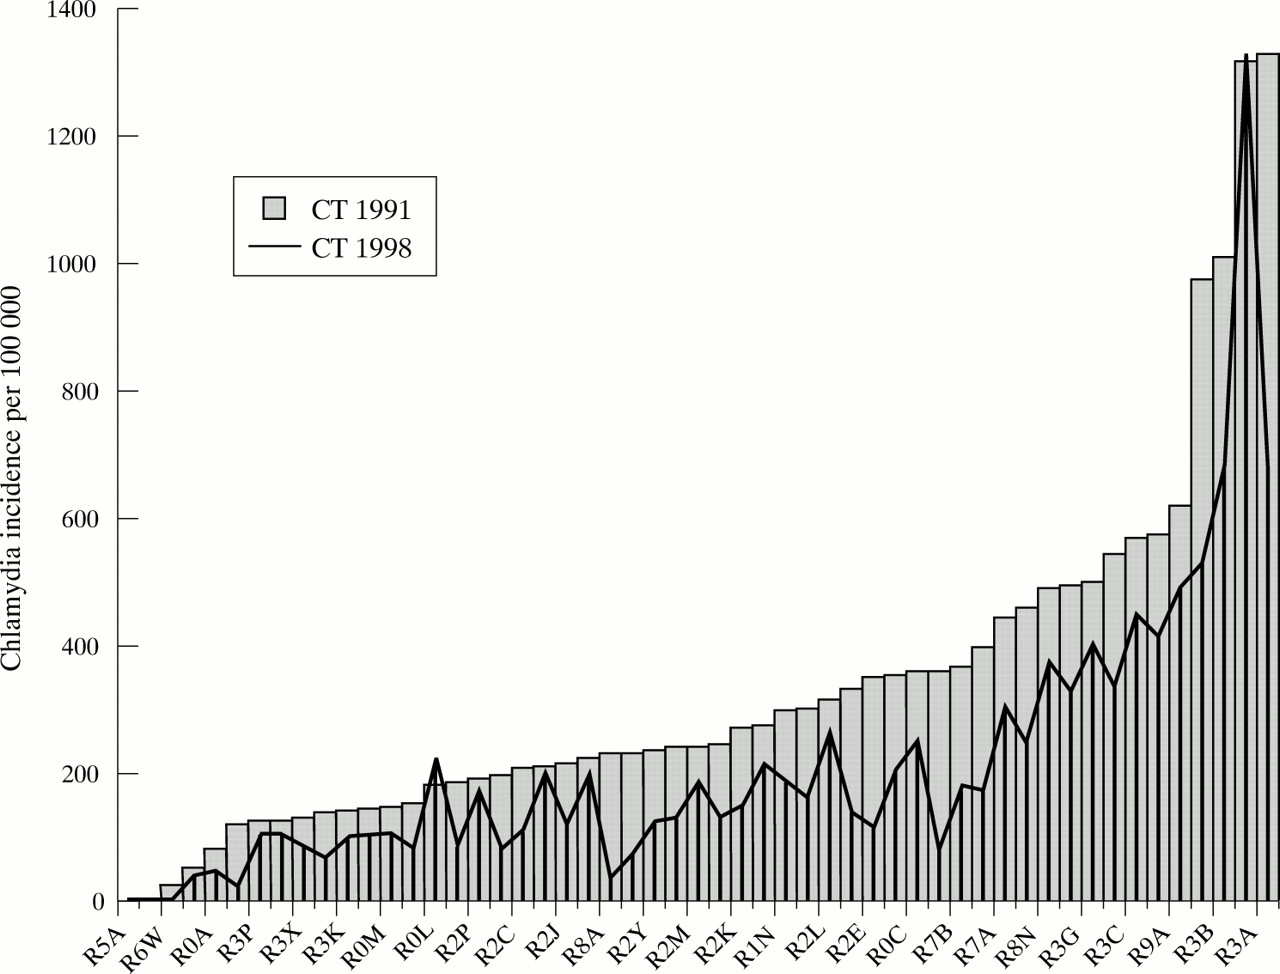
The geographical variability in the incidence of chlamydia and gonorrhoea in Manitoba is most evident when smaller geographical areas are analysed. At the level of the 51 FSAs, there is a striking variability in incidence rates for both chlamydia and gonorrhoea. Figures 10 and 11 show the age adjusted incidence rates for chlamydia and gonorrhoea, respectively, in each of the 51 postal areas in 1991 (bars) and 1998 (lines), arranged left to right from lowest to highest incidence. Several observations can be made from these figures. Overall, both chlamydia and gonorrhoea show a high degree of geographical variability, with a concentration of high rates in relatively few FSAs. Not surprisingly, the areas with the FSAs with the highest rates of both gonorrhoea and chlamydia are contained within the north/remote and urban core regions. This geographical concentration suggests that both diseases are well into the “decline” epidemic phase, which is consistent with the time trend data shown previously.

Age adjusted incidence rates of reported cases of chlamydia by postal forward sortation area in Manitoba in 1991 and 1998.
Age adjusted incidence rates of reported cases of gonorrhoea by postal forward sortation area in Manitoba in 1991 and 1998.
Second, gonorrhoea shows a higher degree of geographical concentration than chlamydia. In 1998, high rates of gonorrhoea persisted in several of the FSAs, but the majority of FSAs had achieved very low rates. Compared with the pattern seen for gonorrhoea, high rates of chlamydia persisted in a larger number of FSAs. This may in part reflect the biological characteristics of gonorrhoea, as the shorter average duration of the infection and the lower likelihood of its causing asymptomatic infection will render it less likely to be widely disseminated in a population than chlamydia. It may also be an indicator that the long and sustained control programme has pushed gonorrhoea into a later epidemic phase than chlamydia, for which a comprehensive control programme began more recently.
The third observation that can be made from these figures is that there have also been differences between chlamydia and gonorrhoea in the geographical patterns of decline in incidence rates. The difference in height between the bars and lines in the figures represents the change in the age adjusted incidence rates in each FSA between 1991 and 1998. For chlamydia, much of the overall decline in incidence occurred in areas that began with low or intermediate rates in 1991, with smaller proportionate declines in FSAs with initially high incidence rates. This pattern of decline has served to accentuate the geographical variability in chlamydia incidence rates and to concentrate high rates in fewer geographical areas. In contrast, over the same time period the largest declines in the incidence of gonorrhoea tended to occur in FSAs which began with the highest rates in 1991. Therefore, though gonorrhoea still displays more geographical concentration than does chlamydia, it appears that sustained prevention and control efforts have begun to make greater inroads into some of the higher risk population subgroups.
The Lorenz curves and Gini coefficients summarising the degree of inequality and changes in concentration of STD incidence are shown in fig 12. Two observations are of particular interest from this figure. First, the greater concavity in the Lorenz curves and the higher Gini coefficients for gonorrhoea confirm that there is more variability in gonorrhoea rates than in chlamydia rates, as was suggested by the actual incidence rates in figs 10 and 11. Second, whereas the geographical variability increased for chlamydia between 1991 (Gini coefficient = 0.39) and 1998 (Gini coefficient = 0.45), there was no change seen for gonorrhoea (Gini coefficient = 0.66 in both years). Thus it appears that the chlamydia epidemic is still actively concentrating geographically within Manitoba, while the gonorrhoea epidemic is already highly concentrated.

Lorenz curves showing the variability in the age adjusted incidence rates of chlamydia and gonorrhoea at the level of the postal forward sortation area in Manitoba, 1991 and 1998.
DISCUSSION
The incidence rates of reported chlamydia and gonorrhoea in Manitoba are substantially higher than in most other Canadian provinces. While this observation may partly reflect the more complete surveillance data in Manitoba, there is clearly opportunity for improvement in STD control. Several observations from the descriptive geographical analyses presented in this paper are relevant to improved STD control in Manitoba. The high overall rates are driven largely by the high rates in the north/remote regions and the urban core. In fact, much of the south rural area of Manitoba now has low rates of chlamydia and exceedingly low rates of gonorrhoea. Another notable finding is that the impressive decline in the incidence of both gonorrhoea and chlamydia which was evident throughout the 1980s was halted in the 1990s. This overall trend is primarily the result of the levelling off and subsequently increasing incidence rates in the north/remote region of the province.
The recent halt in the declining incidence of gonorrhoea and chlamydia infections in Manitoba indicates that new control strategies are required. There is an obvious need to focus resources in certain regions of the province (north/remote and urban core) where rates are the highest and previous progress has been halted. In addition to retargeting resources, new approaches will be required to meet the unique challenges of the high incidence geographical areas. In the north/remote region these challenges include governance and jurisdictional issues for the indigenous aboriginal people, uneven public health services, unique cultural constructs, poverty, and alcohol abuse. In the urban core, the challenges include socioeconomic deprivation, high mobility, substance abuse, and gang involvement. For both, community development and locally planned outreach approaches will need to become part of the solution.
There is substantial small area variation in the incidence of both chlamydia and gonorrhoea, with very high rates found in relatively few postal areas. This is more evident for gonorrhoea, which shows a greater degree of geographical concentration—as summarised by the higher Gini coefficient. However, over the past several years it appears that there has been a greater tendency for geographical concentration with chlamydia. Together, these data suggest that further progress in the reduction in the incidence of both chlamydia and gonorrhoea will require strategies that are more effective in those populations where high rates have been maintained.
In addition to those general approaches, phase specific strategies2 should be adopted for each of the bacterial pathogens discussed in this paper. The gonorrhoea epidemic, now highly concentrated both geographically and in core group composition, might require some specific intensive public health work to identify sexual networks and interrupt transmission within them. The chlamydia epidemic, in an earlier decline phase and beginning to concentrate geographically, requires further interventions in high risk populations which have not been adequately reached to date (for example, adolescents and young men involved with street culture, gangs, or the criminal justice system).
There are still many unanswered questions that will require research. Chief among these is operational research that is directed towards a better understanding of how to design and implement effective control programmes for higher risk communities. For example, the Manitoba programme would benefit greatly from a deeper understanding of why some aboriginal communities have high STD rates while others do not. This will require diverse research strategies, including ethnographic approaches, to gain richer insights. Molecular epidemiology and network analysis could also be used more, to provide a better understanding of the specifics of transmission patterns and to control outbreaks more efficiently (especially gonorrhoea in its current phase).
In addition, feasible epidemiological approaches are required for a better assessment of the stage of an epidemic and to monitor its transition through various phases. Application of the Lorenz curve and Gini coefficient to summarise the inequality in STD incidence rates between jurisdictions in Manitoba was found to provide useful insights into the concentration of these epidemics over time and thus their transition through epidemic phases. Further exploration of the statistical properties of these and other indices of inequality and their potential application to STD epidemiology is warranted. New epidemiological tools are also required to provide better monitoring of the impact of prevention and control activities and to inform the content of those activities.