Article Text

Abstract
Objectives: To examine the interrelation between demographic and geospatial risk factors for gonorrhoea, chlamydia, genital warts, and genital herpes.
Design: We analysed age, sex, ethnicity, socioeconomic status, and area of residence for Leeds residents aged 15–54 with Neisseria gonorrhoeae, genital Chlamydia trachomatis, first episode genital herpes, and first episode genital warts during 1994–5. The 1991 UK census provided denominator population information.
Results: Regression analysis showed that young age (15–24 years), ethnicity (with a gradient of risk black >white >Asian), and residence in inner city areas of deprivation were independent risk factors for all STDs. There were highly significant correlations in the geospatial distribution of incidence rates between the four infections. However, there was variation in the degree of central urban clustering, with gonorrhoea having the most restricted, and genital warts and chlamydia the widest distribution. 31% of all disease occurred in the four inner city census wards, representing 15% of the population.
Conclusion: These results are in keeping with core group theory applying in a unified manner to the four most common UK sexually transmitted diseases in this urban area. Population based studies are needed to clarify whether ethnicity is associated with differing sexual behavioural or mixing patterns. Our data suggest that chlamydia screening in women <25 years of age could detect 70% of cases in the community, that such programmes should give particular emphasis to implementation in core group areas, and that they could function as unifying strategies for the control of most common STDs within urban areas.
- sexually transmitted diseases
- demography
Statistics from Altmetric.com
The development of prevention strategies for sexually transmitted infections (STIs) is strongly facilitated by understanding the transmission dynamics of individual STIs.1 Thus arose the concept of core groups within populations who are central to the spread and maintenance of STIs.2,3 Core groups comprise certain individuals within a society who have a critical level of sexual partner change higher than the average for the entire population who thus maintain endemicity of STIs. These concepts have been enriched by research showing the importance of sexual network structures in determining the transmission and prevalence of STIs.4,5 Furthermore, population prevalence and distribution of STIs is dynamic, and the concept that STI epidemics evolve through different phases requiring phase specific interventions has recently been explored.6
Gonorrhoea was the first STD to be studied with such techniques and risk factors were characterised as young age, central urban residence, non-white ethnicity, and low socioeconomic status.7–9 Studies from the United Kingdom confirmed these associations and using multivariate analysis showed that age, ethnicity, and socioeconomic status were all independently predictors of gonococcal infection, with young black men and women at highest risk.10,11
To date, however, only a small number of epidemiological studies have attempted to provide analyses of more than one STD within populations,12–19 and the demographic inter-relation between different STDs remains unclear.1 Various patterns for the epidemic trajectory of STDs can be envisaged; firstly, that STDs show common demographic and transmission characteristics and overlap geospatially in concentric circles,20 or through differing biological characteristics, sexual networks, and phases of control over time, much more complex demographic and geospatial associations emerge.21 We previously investigated risk factors for gonorrhoea in an urban area in northern England.10 We therefore performed a unified analysis of the four most common clinically diagnosed STDs within the United Kingdom, the bacterial infections, gonorrhoea and chlamydia, and the viral infections, genital warts and genital herpes, to examine the degree of demographic and geospatial concordance between these STDs.22
METHODS
Subjects and study design
Leeds is an urban area, population ∼725 000, served by a single STD clinic at the Leeds General Infirmary. We collected details of all people, aged 15–54, resident within the Leeds Healthcare commissioning area who attended the STD clinic between 1 January 1994 and 31 December 1995 with culture confirmed Neisseria gonorrhoeae, Chlamydia trachomatis detected by ELISA (all new presentation male and female patients were routinely screened), first lifetime episode of genital herpes confirmed by culture as HSV-1 or HSV-2, or clinically diagnosed first lifetime episode of genital warts. Information included clinic identifier, sex, date of birth, postcode of residence and ethnic group. During the study all C trachomatis detection assays for Leeds, including those from gynaecologists and family doctors, were performed at the Public Health Laboratory Service (PHLS), Seacroft Hospital. Similar demographic information for Leeds residents diagnosed with chlamydia and gonorrhoea was also obtained from the PHLS (except ethnicity) and one other STD clinic within a radius of 12 kilometres.
STD clinic staff assigned ethnic group in 1994, but was patient assigned in 1995, using the UK Office of Population Census and Surveys’ 1991 census classification. For the analyses, this was simplified to white, black (black Caribbean, black African, black other), Asian (Indian, Pakistani, Bangladeshi, Chinese, Asian other), and other.
We used the Superprofile classification10 as an indicator of socioeconomic status. Derived from postcode of residence, Superprofile is a 10 cluster group classification of census enumeration districts with similar socioeconomic status based on 72 census variables. It strongly correlates with the Jarman, Townsend, and Carstairs deprivation indices for the Yorkshire population.10 In decreasing order of affluence the 10 clusters are subsequently referred to as socioeconomic groups 1 to 10.
Population denominators used to calculate age by sex incidence rates were 1994 and 1995 mid-year population estimates from the Office for National Statistics. All other rates and relative risks were calculated using populations from the UK 1991 national census.
Ethical approval for the study was from the United Leeds Teaching Hospitals local research ethics committee, and the ethics committee of the Public Health Laboratory Service, Colindale, United Kingdom. All data were anonymised.
Statistical analyses
Crude incidence rates and 95% confidence intervals were calculated for the four infections.10 Relative risk of each infection was estimated with 95% confidence intervals for all levels of age, sex, ethnic group, and socioeconomic group using Poisson regression. Four separate models were fitted, one for each STD, with independent variables sex, age, ethnic group, and socioeconomic group as main effects.
Lorenz curves and Gini coefficients23 were used to summarise and compare the geographic variability of the four infections in census wards of Leeds Health Authority area. Lorenz curves plot the cumulative proportion of the population (x axis 0 to 1) against the cumulative proportion of incidence (y axis 0 to 1), when the units of analysis (for example, wards) are ranked in ascending order of the incidence rate. The Gini coefficient is equal to twice the area between the Lorenz curve and the straight diagonal line x = y and derives values between 0 (uniform incidence) and 1 (maximum inequality). According to 1991 census estimates, average population aged 15–54 of these wards was 12 185, and ranged between 8210 and 17 516. Pearson product moment correlation coefficients of the number of cases of each infection occurring in census wards were calculated.
RESULTS
Characteristics of the study population
The Office for National Statistics mid-year population estimate for the Leeds Health Authority was 725 170 in 1995. Total numbers of subjects aged 15–54 identified with first episode genital warts, Chlamydia trachomatis, first episode genital herpes, and gonorrhoea from 1 January 1994 to 31 December 1995 were 1573, 1313, 468, and 352 respectively. Ethnic group was unknown for 254 cases of C trachomatis and five cases of gonorrhoea that were diagnosed and managed outside STD clinics. Twenty cases of culture positive genital herpes identified by the laboratory where there were no details of first episode or recurrent disease were excluded from the analysis. Only the first episode of each infection for a single subject was considered in the analysis.
Sex by age incidence rates
The years 1994–5 annualised incidence rates per 100 000 resident population by sex and age are shown in figure 1. Overall chlamydia incidence rates were higher in females, 197.8 per 106 (95% confidence interval (CI) 184.2 to 212.8) compared to males, 127.8 per 106 (95% CI 117.1 to 139.1). Gonococcal infection was more common in males than females, 52.6 per 106 (95% CI 45.9 to 60) compared to 32.7 per 106 (95% CI 27.3 to 38.9). The genital herpes attack rate among females, 77.3 per 106 (95% CI 68.9 to 86.5), was twice that among males, 39.1 per 106 (95% CI 33.4 to 45.6). Male and female incidences of genital warts were very similar, 198.1 per 106 males (95% CI 184.8 to 212.1) and 189.7 per 106 females (95% CI 176.3 to 203.8).
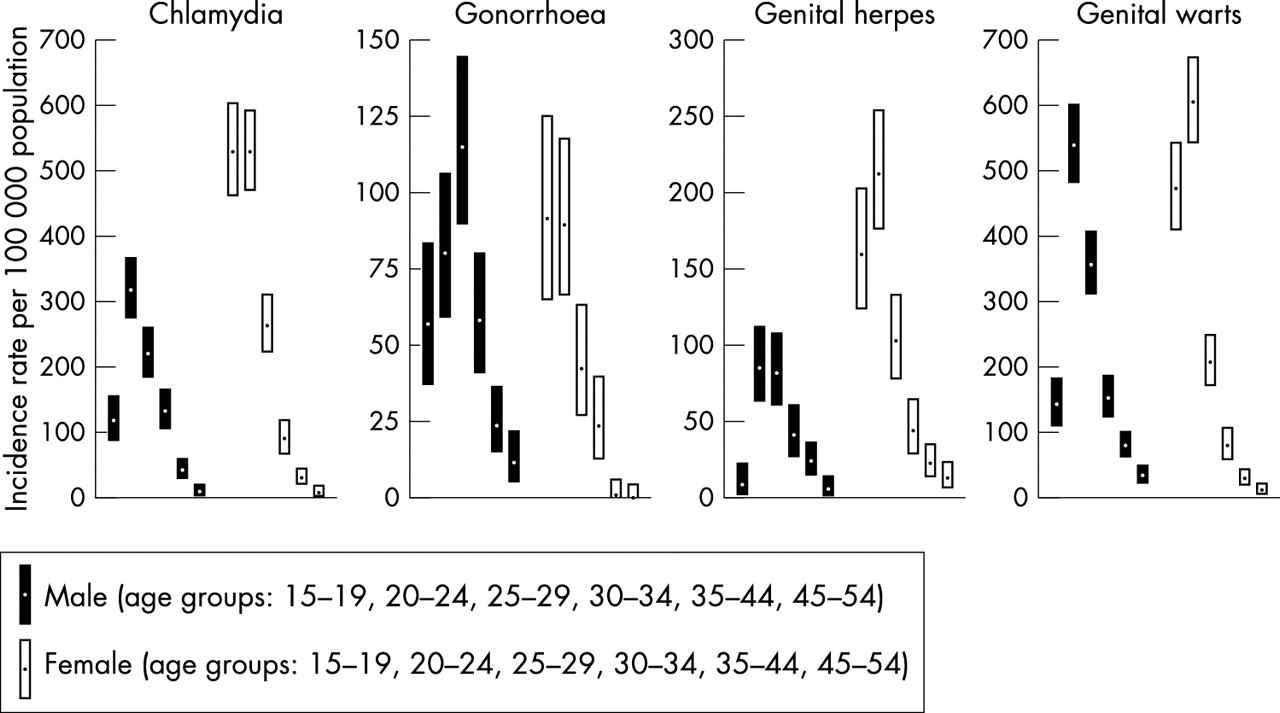
Age by sex annualised incidence rate with 95% confidence interval, Leeds Health Authority 1994–5.
All four diseases showed relatively similar patterns of incidence across age distribution in women; however, men presenting with gonorrhoea showed an older age distribution than men presenting with genital herpes, chlamydia, or warts.
Ethnic group and socioeconomic group relative risks
Figure 2 shows estimated risk of infection for black and Asian ethnic groups relative to white ethnic group, after accounting for the effects of sex, age, and socioeconomic group. For all four infections black ethnicity was associated with an elevated risk and Asian ethnicity with a decreased risk. Many of these associations were remarkably strong, although they varied in pattern and strength.
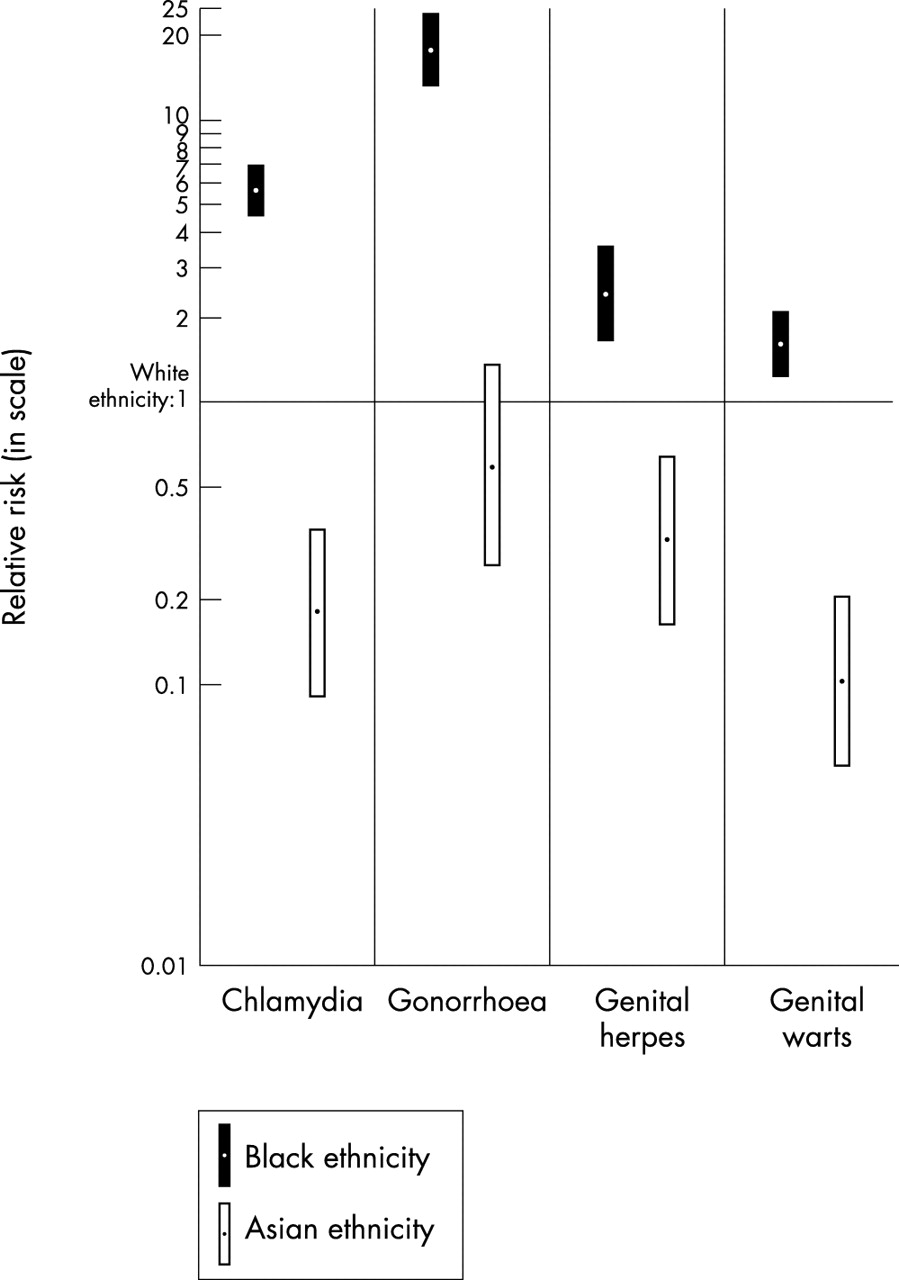
Ethnic groups relative risk with 95% confidence interval, Leeds Health Authority 1994–5. Poisson regression reference group with relative risk = 1: white ethnicity. Relative risk adjusted for sex, age, and socioeconomic group.
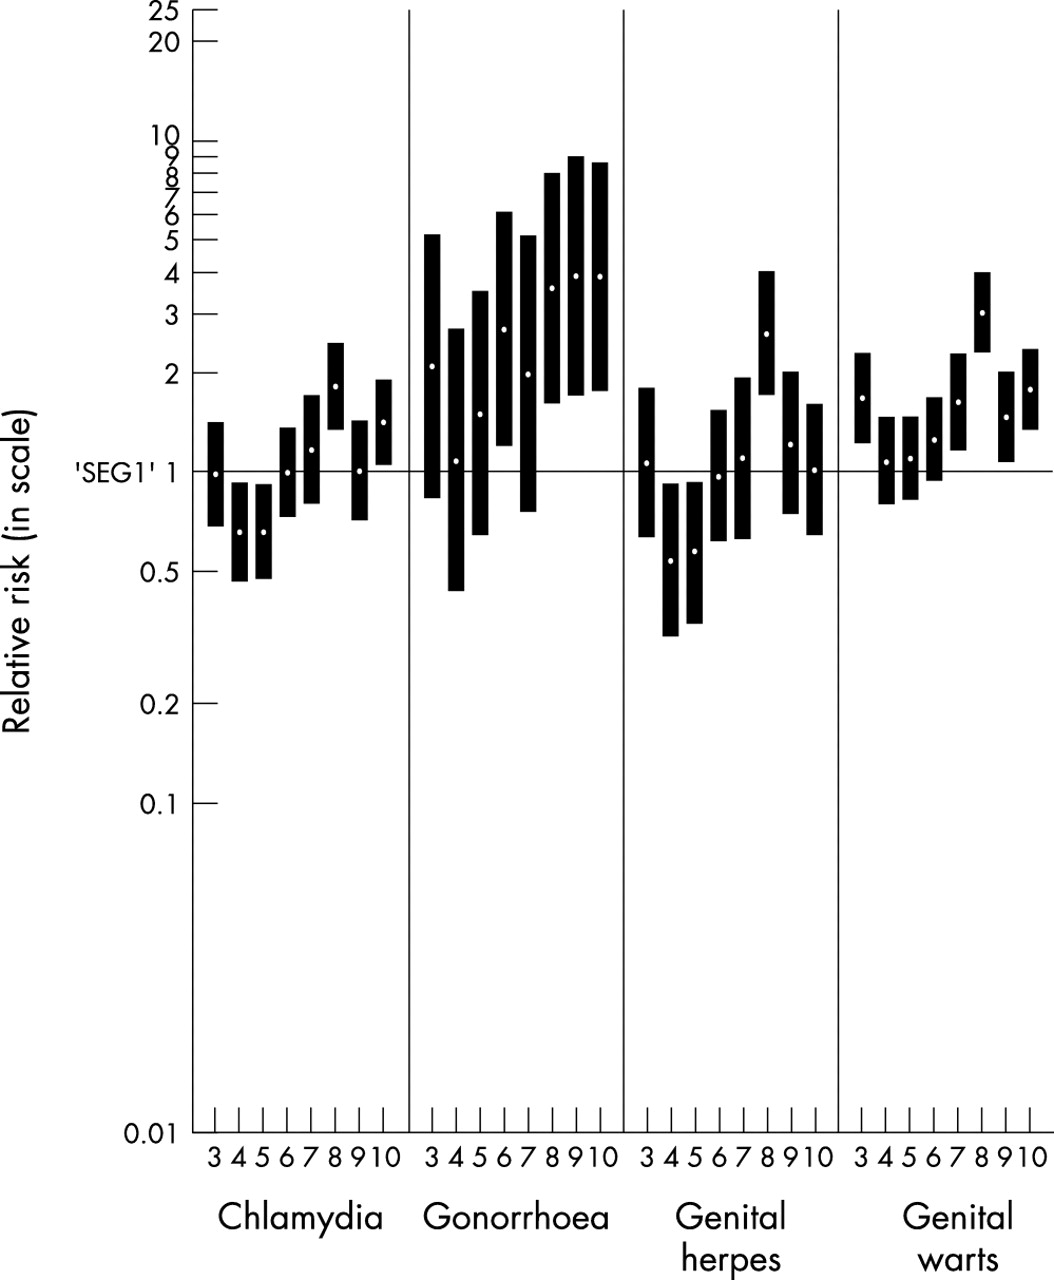
Figure 3 shows estimated risk of infection in the socioeconomic groups 3 to 10 relative to socioeconomic group 1, after controlling for the effects of sex, age, and ethnic group. The Superprofile classification group 2 is a rural affluent group, and comprised only 0.3% of our population. Furthermore, we only observed one case of chlamydia and four cases of genital warts in this group and have therefore omitted it from the results because of small numbers. Gonorrhoea shows the clearest association between elevated risk and more deprived socioeconomic status (SES), with relative risks of 3 to 4 for the lower SES groups. The other diseases do not show such strong linear trends, although socioeconomic group 8, which is predominant in the more deprived central and urban areas of Leeds, has elevated risks for all four diseases.

Socioeconomic groups relative risk with 95% confidence interval, Leeds Health Authority 1994–5. Poisson regression reference group with relative risk = 1: socioeconomic group 1 (most affluent). Relative risk adjusted for sex, age, and ethnic group.
Figures 2 and 3 share the same scale, which shows that ethnic group was generally a more powerful determinant of the incidence rates of all four infections than was socioeconomic status.
Geospatial distribution
Figure 4 shows the incidence rate per 100 000 resident population in census wards. All four STDs cluster around the same central focus, with highest incidence rates in the more deprived central urban areas of Leeds and with lower rates in the more prosperous outlying suburbs. While only 15% of the total Leeds population aged 15–54 lives in the four central urban wards, they accounted for 46%, 34%, 32%, and 27% of all new cases of gonorrhoea, genital herpes, chlamydia, and genital warts respectively.

STD incidence rate per 100 000 people aged 15–54 years in census wards of Leeds Health Authority 1994–5. (n = number of wards.)
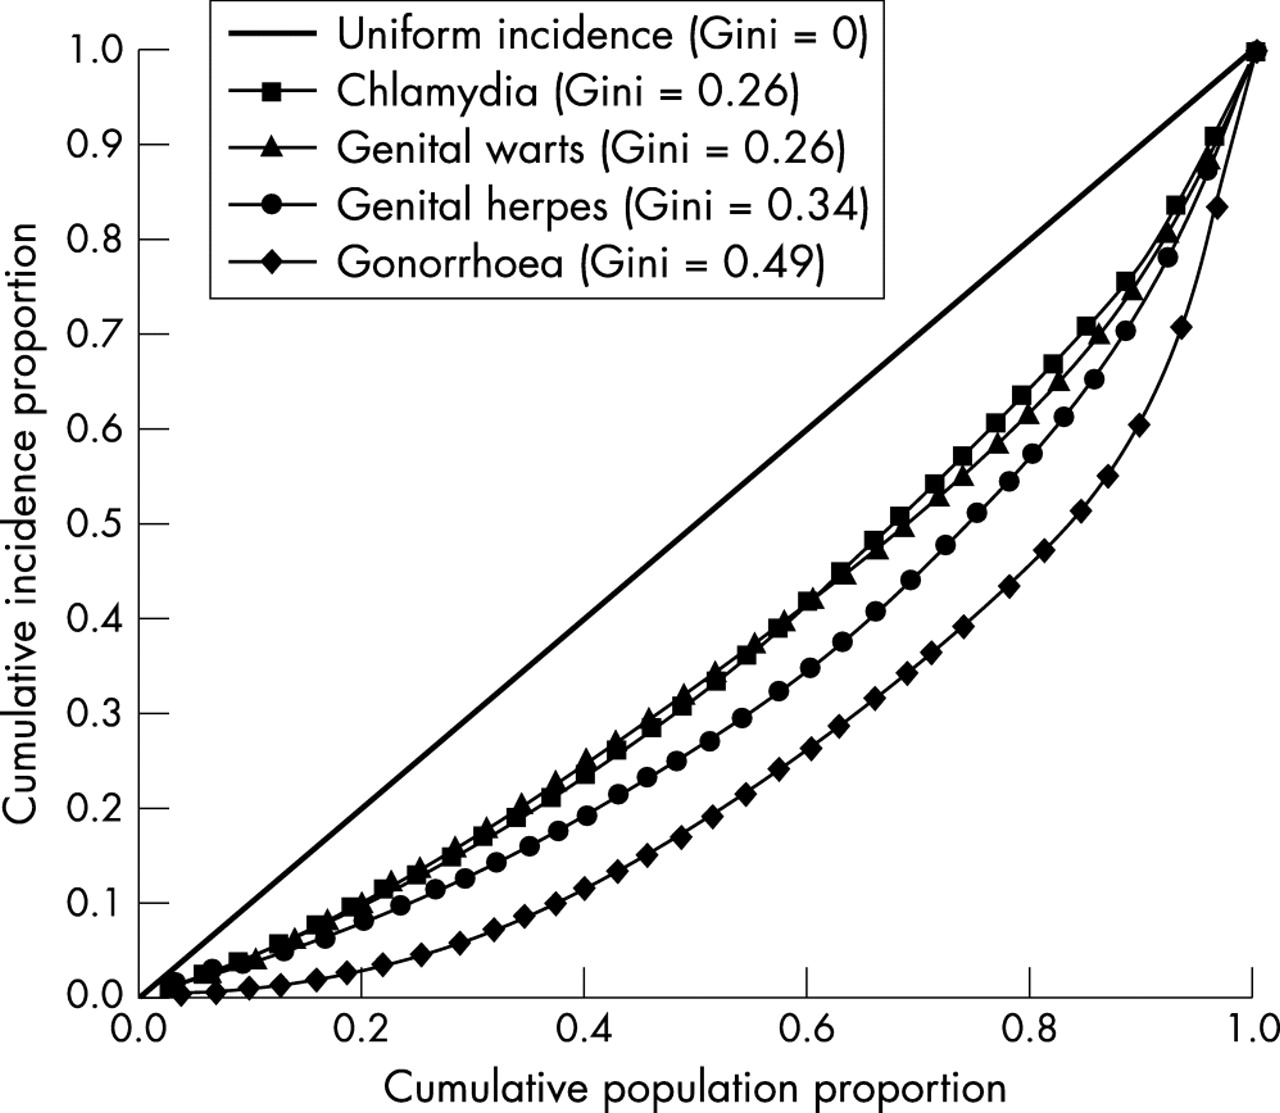
The variability of the incidence rate of each STD across the census wards is summarised using Lorenz curves and their Gini coefficients in figure 5. The greater the concavity of the curve and its Gini coefficient, the greater the inequality of the incidence rate across wards. The straight line represents uniform incidence. The Lorenz curve for gonorrhoea was the most bowed (Gini coefficient = 0.49), confirming gonorrhoea incidence as more geographically heterogeneous and more highly concentrated in relatively few wards than were the other three STDs. Genital herpes had the next most variable incidence (Gini coefficient = 0.34). Chlamydia (Gini coefficient = 0.26) and genital warts (Gini coefficient = 0.26) show very similar distributions and are the least geospatially restricted of the four STDs. These differences have not been tested for significance, as statistical methodology for estimating the distribution of Lorenz curve ordinates is still being developed.24
Lorenz curves and Gini coefficients comparing inequality of incidence rates of four STDs across census wards in Leeds 1994–5 (Leeds Health Authority area 1994–5).
While there is clearly considerable geospatial congruence between all four infections, the distributions of some infections are more closely aligned than others. The Pearson product moment correlations of ward level incidence rates displayed in table 1 quantify the extent to which there is geospatial concordance between each infection. All of these correlations are large and highly significant (p<0.01).
Pearson correlation coefficients of gonorrhoea, chlamydia, genital herpes, and genital warts incidence rates in 33 census wards of Leeds Health Authority, 1994–5*
DISCUSSION
We have explored epidemiological and demographic associations of the four commonest UK STDs. Leeds has a single open access STD clinic based at the same site for 80 years. Evidence shows that UK STD clinics treat the majority of all STDs diagnosed in the community.25 Our analyses are strengthened by the fact that during the study period there was only one laboratory in Leeds performing diagnostic assays for chlamydia that participated in the study. We therefore believe that our ascertainment rate for diagnosed cases of chlamydia and gonorrhoea was close to 100%.
However, several factors may cause under-representation of cases of disease or infection. Firstly, cases will have been diagnosed and treated in primary care settings without investigation or referral. Secondly, C trachomatis, genital herpes, and genital warts have a wide clinical and subclinical spectrum of infection, and our analyses will not reflect cases of subclinical infection presenting only in the community. Thirdly, during the study period EIA tests were used to diagnose chlamydia and these are less sensitive than newer amplification assays. Finally, different patterns of healthcare seeking behaviour between sexes, or ethnic or socioeconomic groups might have influenced the relative proportions of cases identified.
Incidence and sociodemographic characteristics of STDs
One can compare the sex and age incidence of our data with the national UK data.21 The ratio of male to female cases varies between different STDs, reflecting their differing natural histories.20 Our STD sex ratios are very similar to the national picture, except for chlamydia, perhaps reflecting the universal male chlamydia screening policy at the STD clinic. Our rates of gonorrhoea, chlamydia, and genital herpes are slightly higher overall than the UK data, but also show a 25% excess of female genital herpes. Our peak age attack rates for gonorrhoea are delayed in both men and women compared to the national UK data, which is the same as we found in the 1989–93 era.8 Similarly, the peak age attack rates for female genital herpes and warts are delayed compared to the national data.
Analyses of ethnic and socioeconomic associations with STD incidence are fraught with difficulties. Firstly, ethnicity could be associated with genetic or somatic characteristics that influence the acquisition or transmission of infection, but there is a dearth of research in this area. Secondly, under-enumeration in the 1991 census occurred preferentially among those aged 20–29 and also to a degree among black versus white subjects. However, this is likely to reduce the relative risk for black versus white subjects aged 20–29 by a factor of only 0.97–0.95.26 Thirdly, changes in the population structure between 1991 and 1994–5 because of ethnic variations in migration, birth, or death rates might have biased our results, although we know of no evidence to suggest this. Fourthly, aggregate ethnic classifications, such as white, black, and Asian, may conceal important variation between subgroups within such categories.19 We acknowledge that our ethnicity data classification does not address this issue, but because of the small proportion of subjects of black African ethnicity in the Leeds population (subjects in Leeds in the 1991 census described themselves in the following proportions—black Caribbean 0.96%, black other 0.43%, black African 0.20%) and unknown reliability of such subclassification from our data sources we have not attempted such analyses.
Figure 2 shows a striking pattern where the relative risks for all four infections by ethnicity can be stratified as black >white >Asian. However, gonorrhoea is at one end of a spectrum where the risk for Asian subjects overlap that of whites, and blacks have a 17-fold increased risk, with genital warts at the other end of the spectrum where the risk for black people is only 1.6 times that of white people, whereas Asians have a 10-fold degree of protection compared to white people. It is possible that observer assigned or self assigned misclassification of ethnicity could have influenced our results. However, previous US and UK population based data in black, white and, in one case Asian subjects, reported similar incidences for gonorrhoea and chlamydia and differences between these ethnic groups.9,18,19 For genital herpes and genital warts there have only been two previous UK case-control studies which addressed ethnicity, and these reported differing findings to our data.27,28 It is possible that in different geographical areas there may be different ethnic disease associated risks, and further population based studies are needed to explore this. We also considered whether differing degrees of risk associated with ethnicity for different STDs merely reflected differing geospatial concentrations of the infections and associated population make-up, but two factors lead us to believe our findings are valid. Firstly, Superprofile classification has a strong central/urban to peripheral/suburban gradient, and by its inclusion in the regression models differential risks associated with ethnicity are likely to be controlled for in relation to higher incidence in the central urban wards. Secondly, we constructed maps both of ward level population density and individual disease incidence by ethnicity (data not shown). These suggest that there are both geospatial effects independent of ethnicity and ethnicity effects independent of geospatial distribution. We presume that sexual behavioural and sexual mixing/network effects contribute to the substantial differential risks between ethnic groups; population based studies of these variables are needed to elucidate such differential risks. It can be seen from figure 3 that SES can also be an independent risk factor for STD, although in general a less powerful determinant than ethnicity. SES is also inherently linked to area of residence, and therefore geospatial analyses can clarify such associations.
Geospatial distribution and inter-relation of STDs
Our analyses are more complex than previous reports in that we compare four STDs using population based census data and analyse their relative geospatial congruity. One study used product moment correlation coefficients with census based data and showed a correlation for gonorrhoea and chlamydia of r = 0.83.17 We found an almost identical correlation for these two STDs, r = 0.82, but extend the observation to show that statistically significant correlations exist between all four STDs. Lorenz curves and Gini coefficients were used to analyse geospatial variation in the incidence of gonorrhoea and chlamydia over time in Manitoba, Canada.29 The same hierarchy of values (Gini coefficient for gonorrhoea >chlamydia) was demonstrated but with higher values than we found (Manitoba Gini coefficient for gonorrhoea 0.66, Leeds 0.49). However, Gini coefficients for a particular infection presumably inherently vary between different areas reflecting demographic and phase specific factors. Figures 4 and 5 also illustrate the degree of central clustering of the four diseases, which in decreasing order are gonorrhoea, herpes, chlamydia and genital warts. This precisely corresponds to the increasing order of incidence of the four diseases. Furthermore, quartiles of incidence of the diseases show that the incremental pattern of spread of the four diseases throughout the population is very similar, and is a direct reflection of their incidence (data not shown). Brunham and Plummer proposed a general model of sexually transmitted disease epidemiology based on core group theory and transmission dynamics.30 Although various authors have used the term core group in different ways, Rothenberg’s original geospatial definition was districts within an area that contained ⩾50% of cases.4,5 Brunham and Plummer proposed that core group size would vary between STDs because diseases such as gonorrhoea needed a higher rate of partner exchange for persistence than, for example, chlamydia, and would consequently persist in a smaller population. We have shown in our population a hierarchy of core group sizes reflecting transmission efficiency in accord with the above postulates. The geographical nature of Leeds may simplify interpretation of our data, in that it is a relatively discrete urban area, with a historical inner city area showing greater degrees of social deprivation. Nevertheless, these cross sectional findings are in keeping with simpler models of STD demographic epidemiology,20 and do not show divergence of demographics for different STDs,21 which has significant relevance for general population public health interventions (see below). One population based study of an STD has been published where it was possible to analyse the demographics of heterosexual versus homosexual acquisition, and between urban versus suburban areas.13 Rothenberg analysed syphilis in New York State and showed that patterns of incidence varied between urban areas, where tight geospatial clustering was seen, and non-urban areas, where more diffuse patterns were seen. The analyses also suggested that different patterns of ethnicity and sexual orientation were contributing to disease in urban versus non-urban areas. A caveat to our findings is therefore that they should be seen as applying to predominantly heterosexually transmitted STDs within a predominantly urban area.
Public health implications
Community based screening for asymptomatic infection may control or reduce the transmission of STDs. Screening for C trachomatis has been facilitated by the development of highly sensitive amplification assays. A randomised controlled trial of chlamydia screening in women in the United States demonstrated a substantial reduction in the incidence of pelvic inflammatory disease.31 Thus, the UK National Strategy for Sexual Health and HIV has recommended the introduction of opportunistic chlamydia screening in certain groups of women under 25 years of age and similar recommendations have been published in the United States.32,33 Our findings directly support, complement and inform such proposed community based screening for chlamydia. Firstly, we show that 70% of chlamydia infections occur in women aged <25 and that infection is distributed widely within the urban area. Secondly, chlamydia shows strong correlations in its incidence with gonorrhoea, genital herpes and genital warts. Services for chlamydia case detection, partner notification, treatment, and counselling should therefore incorporate facilities for the recognition of other common STDs, which in turn should accrue additional benefit in overall sexual health and STD control.34 Thirdly, although chlamydial infection is widespread in the community within Leeds there is clearly a geographical core in the four inner city wards where one third of all infection occurs. Local public health programmes should ensure that STD screening programmes operate optimally in such areas. Fourthly, using methodology such as ours to analyse incidence rates over time after the introduction of community based screening would allow the analysis of longitudinal effects on incidence across sociodemographic subgroups within the community.
Key messages
-
In Leeds, an urban area, the incidence of gonorrhoea, chlamydia, genital herpes, and genital warts were all significantly related by area of residence
-
There was a hierarchy of geographical dispersion of infections with genital warts = chlamydia >genital herpes >gonorrhoea
-
Ethnicity was strongly related to risk of infection, with black >white >Asian; socioeconomic deprivation was also related to risk, but less strongly
-
These results suggest that community screening for chlamydia should be widespread, but there should be special focus for implementation in inner city areas of deprivation.
Acknowledgments
We thank Dr Michael Waugh and Dr Janet Wilson at the Leeds General Infirmary, Dr Emile Morgan at St Luke’s Hospital, Bradford, and Dr David Tompkins and Dr Chris Newman, Public Health Laboratory Service, Leeds, for allowing us to study their patients.
CONTRIBUTORS The study was designed and implemented by EM, CL, and DM; EM carried out the primary data collection and DM carried out the statistical analyses; EM, CL, and DM interpreted the data and wrote the manuscript; the authors declare no conflict of interest. No external funding was used for the study.