Article Text

Abstract
Background: Measuring clinical performance within a framework of clinical governance is increasingly important for monitoring improvements in patient care. Standards for quality indicators must, however, be achievable and evidence based. We describe an approach to the development of national standards for measuring outcomes of care for gonorrhoea and genital chlamydia in genitourinary medicine clinics.
Methods: Two standards for each infection, one reflecting quality of case management and one reflecting partner management were chosen by consensus. A systematic review of published and unpublished UK studies about gonorrhoea and chlamydia management was carried out and weighted averages calculated for each parameter, stratified by location. Genitourinary medicine practitioners around the country were also asked for their opinion about desirable values for each standard and the results compared. Variability in performance between centres was examined using Shewhart’s control charts.
Results: We identified 17 reports about gonorrhoea outcomes and 14 about chlamydia. There was marked heterogeneity in results according to geographical location and different standards were set for clinics in and out of London. Opinions from practitioners suggested much higher standards than the values obtained from the systematic review. There was evidence for special cause variation related to management of gonorrhoea and chlamydia in London clinics.
Conclusions: Standards set using expert opinion are unrealistic when compared to evidence of what is achievable. Evidence based methods should therefore be used to derive outcome standards for case management gonorrhoea and chlamydia. The control chart method identified clinics where investigation to find reasons for special cause variation in performance should be undertaken to change practice.
- chlamydia
- clinical effectiveness
- gonorrhoea
- medical audit
- quality indicators
Statistics from Altmetric.com
Measuring clinical performance within a framework of clinical governance is increasingly important for monitoring improvements in patient care. Clinical audit often reveals wide variation and reducing this is one way of increasing consistency, which should improve quality of care and, ultimately, health. Practice guidelines are instruments used to give assistance about the action to take for a specific clinical situation. They usually contain a number of quality indicators and specify standards that must be met. While there are several sources of guidance about the process of developing evidence based practice guidelines,1,2 it is more difficult to find out how to develop quality indicators.3,4 In addition, although it is widely agreed that standards should be evidence based there is little information about how to synthesise the results of different studies to define exact standards for the guidelines. Evidence from randomised controlled trials should be used to define standards for clinical outcomes such as targets for blood pressure reduction5 or acceptable cure rates for antibiotics used to treat gonorrhoea.6 This level of evidence, however, is usually not available for defining quality indicators to improve the process of care such as the proportion of patients who should return for follow up visits after an episode of gonorrhoea.
There are many reasons for variations in clinical practice and many ways of expressing them. One method that has recently been applied to clinical practice comes from concepts of quality control used in engineering.7 Using this model variation can be categorised into two groups according to the action required to reduce it. Common cause variation is intrinsic to the process and even when as many variables as possible are controlled there will still be some acceptable variation in practice that can only be decreased by changing the underlying process. Special cause variation results from factors external to the process and to eliminate this they need to be specifically identified and dealt with.7
We describe the process and results of an attempt to produce evidence based standards of process in the management of gonorrhoea and chlamydia in genitourinary medicine (GUM) clinics in the United Kingdom used by the Clinical Effectiveness Group of the Medical Society for the Study of Venereal Diseases and Association of Genitourinary Medicine. We then use the method outlined above to examine variations in performance of GUM clinics in the United Kingdom.
METHODS
Figure 1 shows the process we undertook. The Clinical Effectiveness Group chose quality indicators reflecting the process of clinical management and partner notification for gonorrhoea and chlamydia and decided on the following principles for setting the outcome standards:
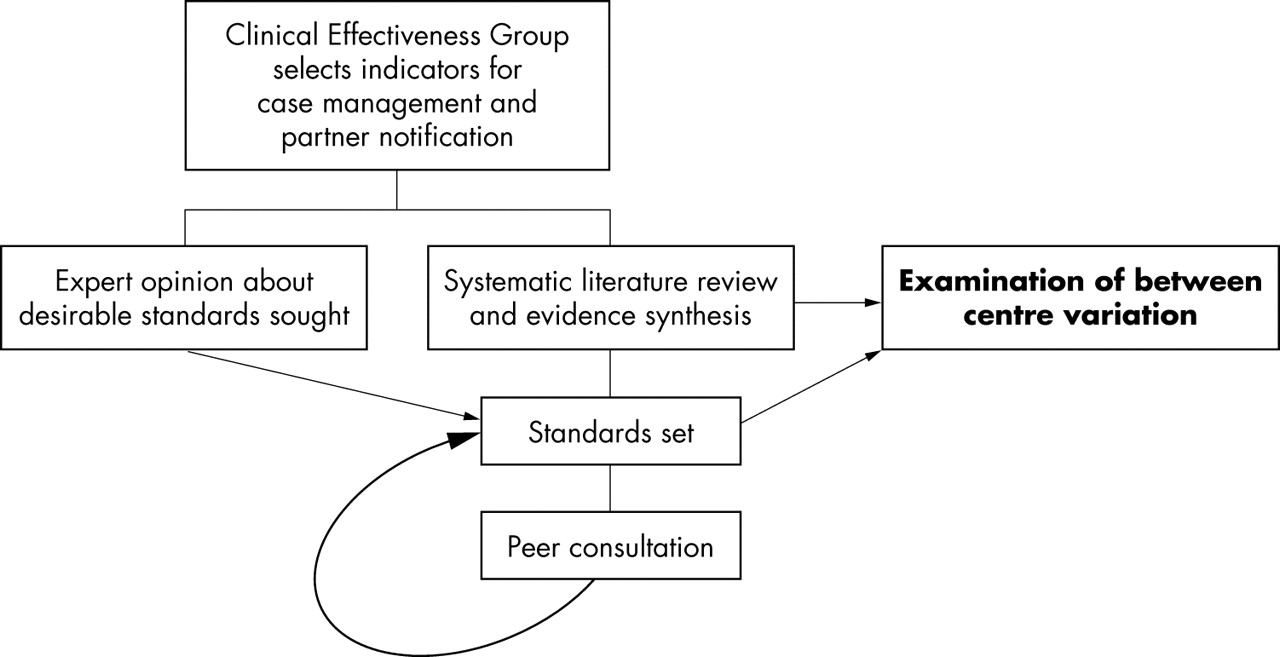
Development of outcome standards.
-
To derive figures for each standard using available published and unpublished evidence and opinions solicited from individual specialists across the United Kingdom.
-
The standards should not be aspirational targets unlikely to be achieved in the real world, nor so low as not to detect a failing service. They should reflect targets consistently achievable by well resourced and adequately run clinics.
-
To consider factors that may influence clinics’ ability to meet the standards—for example, patient demographics, geography, resources, efficient management, etc.
Table 1 describes the indicators selected to reflect the quality of care. The literature review and evidence synthesis were then carried out to derive numerical standards for the parameters x (cure, treatment or partner notification rates) and y (time limit) for each standard.
Quality indicators for management of gonorrhoea and chlamydia set by the Clinical Effectiveness Group
Literature search
The box shows the search strategy. Data from unblinded published and unpublished reports were extracted by one reviewer using a standard proforma that recorded details of the publication, study population, numbers of participants, and the parameters x and y for each indicator. Some centres were included in multiple reports so only the most recent estimate from each was included in analyses. Data from multicentre reports were disaggregated where possible to obtain information from individual centres. Where individual clinic data could not be extracted—for example, from the National Gonorrhoea Audit,8,9 we used unweighted figures, stratified into London and non-London clinics when possible. This means that clinics contributing to the national audit and to another study will therefore be duplicated.
Evidence synthesis
Pooling of data from individual centres
For each parameter and each indicator we calculated the average (with 95% confidence intervals) of results from all relevant studies, weighted according to the number of cases analysed at each clinic. Evidence of variation between estimates from different centres beyond that expected by chance was examined by performing a statistical test of heterogeneity (χ2 test). If there was evidence of heterogeneity (p<0.1) the weighted average was calculated using random effects models that allow for variation. We then stratified results according to geographical location (London or large city v other). The exact figures for the standards were rounded up to the nearest 10%.
Search strategy
-
Literature search of Medline and Embase 1995–2002 to identify recently published articles reflecting current practice in UK GUM clinics.
-
Search terms in Medline were (“gonorrhea” OR “Neisseria gonorrhoeae” OR “chlamydia infections” OR “Chlamydia trachomatis”) and (“medical audit” OR “England” or “Scotland” or “Wales” OR “Northern Ireland” OR “London” OR “Great Britain”).
-
Hand search of audit reports in the International Journal of STD & AIDS 1995–2002.
-
Unpublished audits submitted to the Clinical Effectiveness Group.
-
Opinion of individuals, groups of clinicians, interested parties proposing figures for the agreed standards.
-
Reports from non-GUM clinic settings and from settings outside the United Kingdom were excluded.
We compared our results with the opinions of experts who were asked to specify desirable standards for each indicator.
Exploration of between centre variation
We plotted data about numbers of patients cured and contacts treated per case in each centre using “Shewhart’s control charts,” a graphical method that allows different sources of variation in performance to be examined. The control charts were created using methods previously described.7 They present data points for each clinic together with three lines: the mean and upper and lower limits. The upper and lower limits represent the limits of common cause variation, taken as three standard deviations from the mean. Points falling outside these limits suggest special cause variation.7
RESULTS
Setting standards
The search strategy (box) yielded 25 published and unpublished reports. These included 17 reporting gonorrhoea management, including two from a national audit8–24 and 14 about chlamydia management (table 2).15,16,19,20,23–32
Characteristics of published and unpublished studies
Gonorrhoea
The 17 reports included results from 50 different departments of genitourinary medicine in 15 reports10–24 and two reports from the National Gonorrhoea Audit of 155 departments, 22 in London and 133 outside London.8,9 The majority of reports were from centres outside London.
Cure rates (x)
Seven reports8,11,13,17,19,21,23 including 2563 patients contained sufficient data to calculate cure rates (table 3). Two further studies reported the numbers of patients returning for a test of cure but not the results.15,22 Two multicentre reports did not stratify results by geographical location so we stratified data into London clinics,21,23 provincial clinics,13,19 and combined rates.8,11,17 The results from the National Gonorrhoea Audit8 were consistent with those from other centres.
Pooled cure rates for gonorrhoea
Table 3 shows that cure rates calculated as defined by the Clinical Effectiveness Group (proportion with negative tests of cure out of all patients diagnosed, table 1) ranged from 42.9% to 76.0% and differed between centres (test for between centre heterogeneity, p<0.001). The proportion of patients returning for a test of cure was much lower in London (weighted mean 55.8%) than outside (weighted mean 78.4%). After stratifying by location heterogeneity in cure rates between non-London clinics remained (range 54.5–76.0%).
The efficacy of antibiotic treatment, calculated as the number of patients cured as a proportion of those who returned for a test of cure, was 94.7% (95% CI, 92.8 to 96.6), with no evidence of heterogeneity between studies carried out in and outside London (p = 0.203).
Time between diagnosis and cure (y)
Eight studies reported the average time between diagnosis and test of cure, which was from 28,10,11,21 to 4 weeks.15,19,22,23
Partner notification (x)
Twelve studies reported the number of sexual contacts screened for gonorrhoea8,12–14,16,17,19,20,22–24 (table 4) but no study reported the proportion confirmed to have been treated or returning for follow up.
Number of sexual contacts screened per case
The pooled data show that, overall, 0.58 contacts per case of gonorrhoea are screened (table 4). Fewer contacts per case are screened inside London than outside but confidence intervals for these estimates overlap. Geographical location did not explain all the heterogeneity between studies since strong evidence of heterogeneity remained after stratification (p<0.001, estimates ranged from 0.14 to 0.60 contacts per case in London and 0.23 to 0.99 contacts per case outside London).
Time between notification and screening of contacts (y)
Only one study reported the time between diagnosis and screening of contacts15 as 4 weeks.
The proposed outcome standards are summarised in table 5. We rounded figures to the nearest 10% for simplicity.
Proposed evidence based outcome standards
Chlamydia
Fourteen studies reported on chlamydia outcomes in a total of 10 860 patients at 82 different clinics.15,16,19,20,23–32
Satisfactory treatment (x)
Most studies reported the proportion of diagnosed cases receiving treatment but information about satisfactory completion of treatment was much less well documented. One small study from London reported the proportion of patients satisfactorily completing treatment for chlamydia.23 Of 35 female patients seen in 1 month 11 returned for follow up and eight (22.9%, 95% CI 10.4 to 40.1) had completed treatment satisfactorily. Another study from Durham found that 46/209 (22%, 95% CI 16.6 to 28.2) female patients required re-treatment, particularly if they had been referred by a general practitioner. Three studies (from London, Wessex, and Yorkshire) found that, overall, 63.7% (95% CI 56.6 to 71.7) of patients returned for a test of cure,23,26,27 with strong evidence for heterogeneity between studies (p<0.001). These studies did not report whether or not treatment had been completed satisfactorily. The Wessex audit, however, reported results of tests of cure performed at the follow up visit in 172 patients from six clinics.27 71.0% (95% CI 64.5 to 78.0) of patients could be established as being cured, by this definition. Using these data, which estimated the chosen outcome standard indirectly, we set the values for satisfactory treatment of chlamydia at the same levels as for cure of gonorrhoea.
Time from diagnosis to follow up (y)
The time period between diagnosis and follow up was reported in two studies as 4 or 5 weeks.23,26
Partner notification (x)
Twelve studies reported the number of contacts screened per case of chlamydia diagnosed.16,19,20,23–28,30–32 These studies involved 6877 patients in seven single centre studies (2085 patients) and five multicentre audits (4792 patients, 66 centres).
Table 4 shows that overall, 0.61 (95% CI 0.55 to 0.66) contacts per chlamydia case diagnosed were screened. These data could be stratified as large city (London, Birmingham, Manchester) or other clinic locations. In large city clinics 0.43 (95% CI 0.30 to 0.62) contacts per case were screened, compared with 0.64 95% CI 0.58 to 0.70) contacts per case in other clinics. There was strong evidence for between clinic heterogeneity in all settings. These figures were similar to those for gonorrhoea and the same standards were set for both (table 5).
Time from notification and screening of contacts (y)
The time between diagnosis and screening of contacts was 4 weeks in two studies16,27 and 5 weeks in another.23
Expert opinion
Table 6 shows the opinions of GUM physicians and representatives of national and regional organisations. When compared with the pooled results of audit data individuals’ expectations for performance were higher than the achieved outcomes. This is exemplified by experience from Scotland (GR Scott, personal communication) where audit standards for gonorrhoea and chlamydia proposed that 90% of patients should be satisfactorily treatment and 50% of partners notified. The results showed that 71% of gonorrhoea and 55% of chlamydia cases achieved the standard for satisfactory treatment and partners of 32% of gonorrhoea and 27% of chlamydia cases were satisfactorily managed.
Expert opinion estimates of desirable outcome standards
Variation between centres
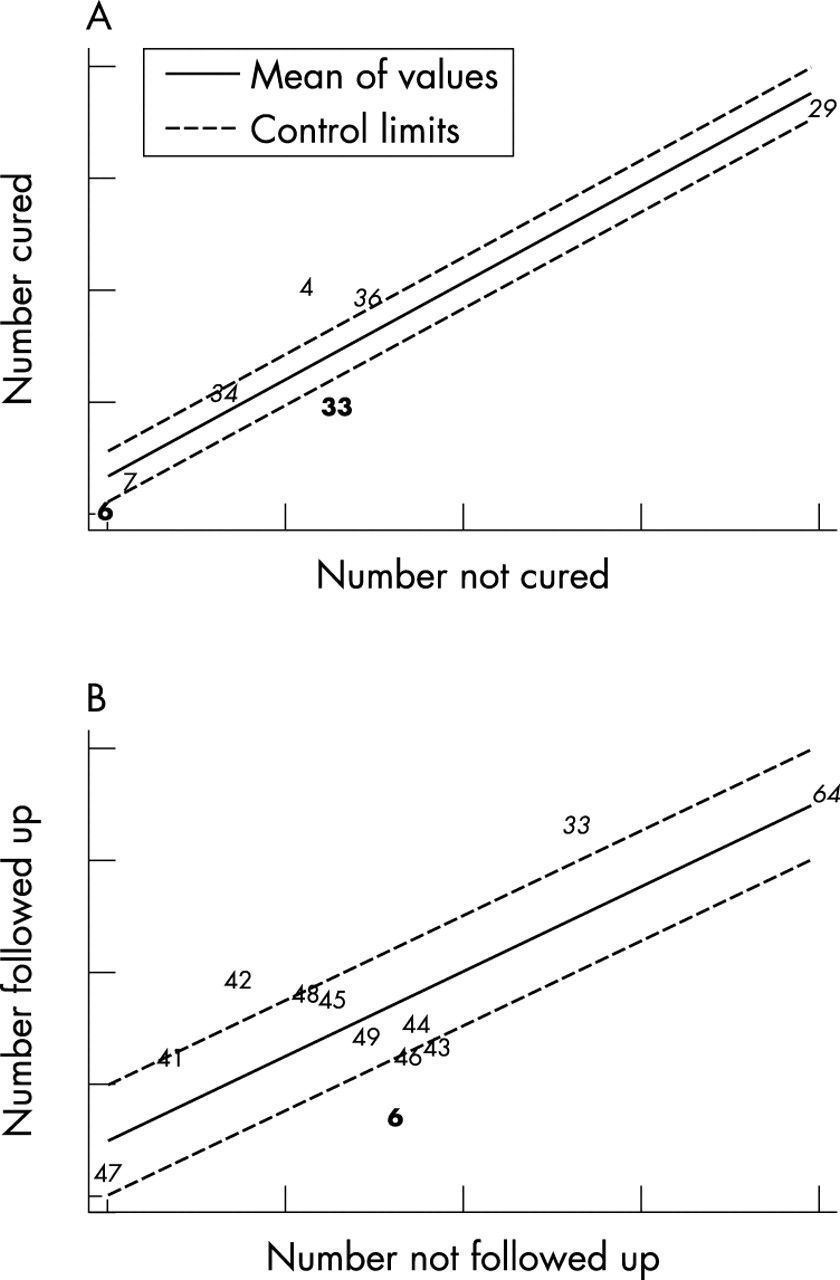
Figures 2 and 3 show control charts plotted to display variation in the outcomes of treatment and partner notification between different centres in the reports retrieved from the literature search. Points lying outside the control limits (broken lines) suggest a special cause for this degree of variation. Points lying above the upper control limit show high cure or partner notification rates and knowledge of why these centres perform well could be used to help improve practice in other centres, particularly those below the lower control limit.

Control charts showing between centre variation in treatment outcomes for gonorrhoea and chlamydia. (A) Gonorrhoea cure in 202 clinics reported in seven audit reports. Points 6 and 33 (bold) are centres in London. Points 29, 34, and 36 are composite results (italic). Points 4 and 7 are non-metropolitan centres. (B) Follow up rates for patients with chlamydia in 46 clinics reported in four studies. Point 6 (bold) is in London. Points 33 and 64 are composite results (italic). The remainder are individual non-metropolitan areas.

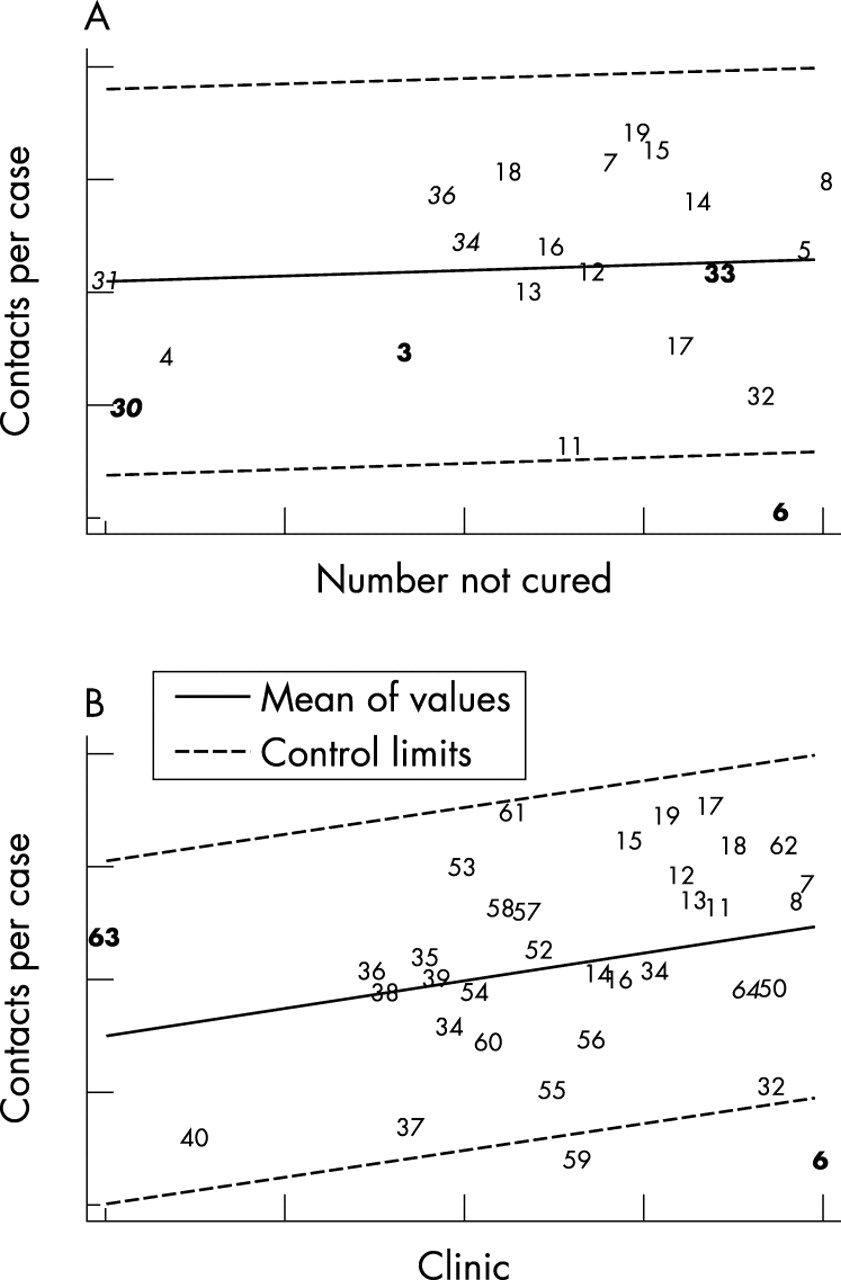
Control charts showing between centre variation in partner notification outcomes for gonorrhoea and chlamydia. (A) Number of contacts screened per gonorrhoea case in 215 clinics reported in 12 audit reports. Points 3, 6, 30, and 33 (bold) are in London. Points 30, 31, 34, and 36 are combined results (italic). The remainder are individual non-metropolitan centres. (B) Number of contacts screened per chlamydia case in 73 clinics in 12 reports. Points 6 and 63 (bold) are in London. Point 64 is a composite result (italic). The remainder are individual non-metropolitan areas.
In figure 2 the points lying clearly below the lower control limit are in London. Those on the line are outside London. For chlamydia (fig 2B) the horizontal axis shows the numbers of people returning for follow up, which is used as a proxy for the number satisfactorily completing treatment.
Figure 3 shows substantial variation between clinics in the outcome of partner notification. Most points lie within the control upper and lower control limits, however, suggesting common cause variation. Special cause variation is suggested in one London and one non-London centre.
DISCUSSION
We derived standards of management for gonorrhoea and chlamydia in GUM clinics using a process coordinated by an expert professional group that included a systematic review of published and unpublished literature and peer consultation. The evidence based standards were considerably lower than if they had been based on the expert opinion. We found good evidence on which to base standards for satisfactory treatment for gonorrhoea and rates of partner notification for gonorrhoea and chlamydia. There was, however, little empirical evidence about satisfactory treatment for chlamydial infections and the times within which follow up for either infection should be conducted. There was wide variation in outcomes achieved in different clinics, most of which is the result of common causes. The data suggest special causes for variation in the rates of follow up for chlamydia and gonorrhoea cure and these should be investigated further.
Limitations of the data and methods
In any systematic review it is possible to miss reports, particularly unpublished data. The data analysed and reported here may therefore be incomplete but they include a large number of diverse centres across the country. More importantly, the reports retrieved often did not provide the information required. In particular, audits of the management of chlamydial infections collected data about the number of patients returning for follow up but the number of patients requiring re-treatment, which is a better measure of the adequacy of management, was rarely reported. Times over which outcomes were measured were usually not reported. These data should be collected in future audit reports now that standards have been defined.
Some of the reports from multicentre audits did not provide the results from individual centres. They usually presented simple proportions—that is, estimates that were not weighted for the number of observations from each centre. The inclusion of these unweighted data ignores some of the variability between centres, which could bias the pooled estimates.
Choice of standards
For each infection we presented a weighted average of the proportion of cases and the number of contacts per case managed satisfactorily. We found substantial heterogeneity in outcomes achieved between clinics, some of which was due to geographical location. We therefore chose different standards for clinics in London and those outside. The reasons for less complete follow up in London clinics include a more mobile population, greater clinic workload and longer waiting times, which may discourage reattendance. There may be areas in which practice could be changed to facilitate follow up or ascertainment of compliance with treatment, including telephone calls, text messaging, and use of outreach health advisers and nurses. The use of audit should enable clinics to evaluate the effects of changes in practice.
The outcome of contact tracing was based on total numbers of sexual contacts ascertained although it is known that some contacts can not realistically be traced and others have already presented as index cases and been treated. There were insufficient data in the studies reported to determine outcomes for different categories of contacts and most reports did not state the basis for calculating this variable. The wording of the standards reflects current practice, although it is recognised that other measures such as the total proportion of contacts screened may be more relevant for disease control. Future audits should collect data on a range of contact tracing outcomes so that standards can be modified appropriately.
Variability in outcomes between clinics
As discussed above some of the variation between clinics was explained by geographical location. There was, however, residual heterogeneity that was not due to geographical location and that could represent unmeasured factors in the process of care. The control charts (figs 2 and 3) provide information that gives clues as to the source, if not the cause, of variation. In each case the clinics can be divided into three groups.7 Firstly, data points above the upper control limit show well performing clinics. Reasons for their success (special causes) could be investigated and modifiable factors could help improve performance in other clinics. Secondly, data points lying between the control limits show variations in performance that are the result of common causes. Examining the underlying processes of care in all clinics could identify modifiable factors, which could be used to reduce variation and improve performance overall. Thirdly, data points below the lower control limit show clinics with special causes responsible for their poor performance. Identifying these factors could help eliminate them and improve quality of care.
The control charts presented here show that most variation in the outcomes related to cure and follow up has common causes but special cause variation also exists. We investigated geographical location as one reason for special cause variation. The stratified analyses complement the findings in the control charts. The lowest cure or follow up rates were from London clinics and these clinics were also below the lower limit of the control chart. The results of contact tracing outcomes also show fewer contacts treated per case in London clinics. Reviews of partner notification processes across clinics and identification of factors associated with improved outcomes would therefore be more likely to reduce between clinic variations.
Monitoring clinic performance
The proposed outcome standards (table 5) can be used in conjunction with the control charts. The standard represents the weighted average performance target. Future national audits could measure performance against best practice targets as well as the standards suggested here by the Clinical Effectiveness Group. The actual performance of clinics will generally lie above or below the average. A control chart plotted for all clinics would then show if performance lies outside the limits, in which case causes of special variation should be sought to explain particularly good or poor performance. The profession as a whole should examine the process of care to look for causes of common cause variation and to try to reduce these to improve the consistency of care. As successive audit rounds and changes in practice occur the average performance target would be expected to increase and the control limits become narrower with fewer clinics below the lower limit.
In summary, we have defined evidence based outcome standards for gonorrhoea and chlamydia. We have also shown how a method for examining variation in performance between clinics can be applied to monitor performance and could improve consistency and quality of care over time.
Acknowledgments
The members of the MSSVD/AGUM Clinical Effectiveness Group are (chairman) Keith Radcliffe (MSSVD), Imtyaz Ahmad-Jushuf (AGUM), Mark FitzGerald (AGUM), Guy Rooney (Royal College of Physicians GU Medicine Committee), Jan Welch (MSSVD).
Dr Tom Marshall gave advice about the use and interpretation of the control charts and Dr Jonathan Sterne provided statistical advice to construct them.
We are grateful to all the clinicians who took the time to provide data, comment on the standards, and provide additional information.
Dr Nicola Low is sponsored by a NHS Career Scientist Award.
CONTRIBUTORS NL carried out the systematic review, statistical analysis, and drafted the report; JW and KR developed the quality indicators as part of the Clinical Effectiveness Group and revised the manuscript.
REFERENCES
Linked Articles
- Brief Encounters