Article Text

Abstract
Objective: We analysed and mapped the distribution of four reportable sexually transmitted diseases, chlamydial infection/non-gonococcal urethritis (chlamydial infection), gonorrhoea, primary and secondary syphilis (syphilis), and HIV infection, for Wake County, North Carolina, to optimise an intervention.
Methods: We used STD surveillance data reported to Wake County, for the year 2000 to analyse and map STD rates. STD rates were mathematically represented as a spatial random field. We analysed spatial variability by calculating and modelling covariance functions of random field theory. Covariances are useful in assessing spatial patterns of disease locally and at a distance. We combined observed STD rates and appropriate covariance models using a geostatistical method called kriging, to predict STD rates and associated prediction errors for a grid covering Wake County. Final disease estimates were interpolated using a spline with tension and mapped to generate a continuous surface of infection.
Results: Lower incidence STDs exhibited larger spatial variability and smaller neighbourhoods of influence than higher incidence STDs. Each reported STD had a clustered spatial distribution with one primary core area of infection. Core areas overlapped for all four STDs.
Conclusions: Spatial heterogeneity within STD suggests that STD specific prevention strategies should not be targeted uniformly across Wake County, but rather to core areas. Overlap of core areas among STDs suggests that intervention and prevention strategies can be combined to target multiple STDs effectively. Geostatistical techniques are objective, population level approaches to spatial analysis and mapping that can be used to visualise disease patterns and identify emerging outbreaks.
- spatial distribution
- sexually transmitted diseases
- population surveillance
Statistics from Altmetric.com
Local and national agencies spend millions of dollars on sexually transmitted disease (STD) interventions and prevention strategies.1 Many interventions include free access to STD health care, increased education, STD screening, and enhanced surveillance to identify outbreaks. Decisions regarding where to allocate limited resources require knowledge of vulnerable groups, effective and appropriate interventions, and the spatial distribution of STDs in the community.
Previous studies have shown that chlamydial infection and gonorrhoea have geographically definable core areas of infection2–9 that partially overlap3 and geographical regions at increased risk for repeat infection.5,7,8,10,11 Additionally, there is evidence that sexual partners are selected locally,12 further supporting the hypothesis of spatially definable core areas of infection. Most of the methods used in these investigations mapped STDs by census tract (or larger geopolitical unit) or zip code and identified core areas using modified versions of Rothenberg’s method.2 However, none of these methods includes a spatial analysis of disease patterns, and maps of STDs by discrete areas can cause misinterpretation of spatial patterns since large census tracts representing sparsely populated areas with high STD rates can give the visual illusion that an epidemic is more widespread than it actually is.13
Our objective was to help decision makers optimally target resources for an intervention called “HIV prevention through coordinated STD services in a Southern community” by providing accurate depictions of the spatial distribution of reportable STDs in Wake County, North Carolina. At the same time, we wanted to develop an approach that could minimise misinterpretation of the results and enhance the existing surveillance system by allowing spatial analysis and disease mapping in near real time. The purpose of this paper is to describe and compare the spatial distribution of chlamydial infection/non-gonococcal urethritis (chlamydial infection), gonorrhoea, primary and secondary syphilis (syphilis), and human immunodeficiency virus (HIV) infection using the approach we developed. We conducted our spatial analysis of the four reportable STDs using surveillance data for Wake County for the year 2000, random field modelling, and kriging.14 Random field modelling can be used to describe the spatial distribution of disease as a collection of realisations across space.15 Kriging is a geostatistical technique that can be used to analyse the strength and scale of disease pattern, and map STD measures as a continuous surface of infection.
METHODS
Study setting
Wake County is located in the central part of North Carolina. Raleigh, the capital of North Carolina, is an urban area in the centre of Wake County (fig 1). Suburban centres predominate west and south of Raleigh, and the rest of the county is mainly rural. In the year 2000, 627 846 people lived in Wake County.16
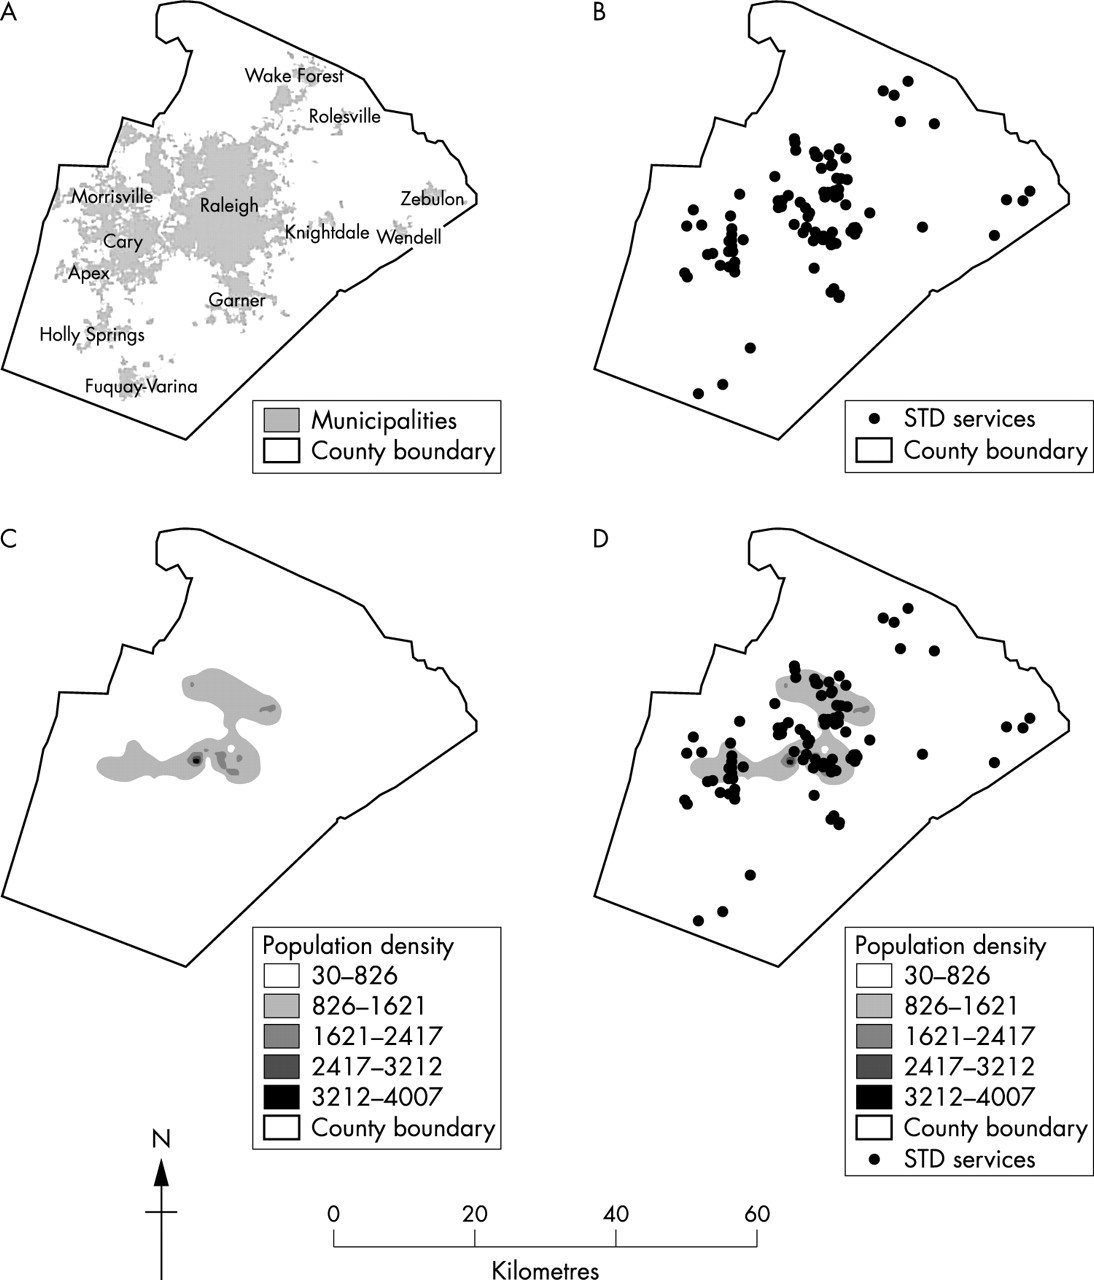
Characteristics of Wake County, North Carolina in the year 2000. (A) Wake County, North Carolina; (B) Wake County STD services; (C) population density of Wake County; (D) location of STD services relative to population density.
Study population
North Carolina healthcare providers and laboratories are required to complete communicable disease report cards for each diagnosed case of chlamydial infection, non-gonococcal urethritis, gonorrhoea, syphilis, and HIV infection, and submit these reports to the appropriate county health department. Communicable disease report cards include information on the patient’s disease, report date, date of onset, residence, reporting healthcare provider, and limited demographic characteristics such as sex, race/ethnicity, and age. Both the University of North Carolina institutional review board and the Center for Disease Control and Prevention internal review board approved a spatial analysis of each reported STD based on the information from these cards.
Our study population included all Wake County residents 10 years old and older. Individuals residing outside of Wake County and children under the age of 10 years were not considered part of the population at risk and excluded. An STD case was defined as an infected Wake County resident with a report date between 1 January 2000 and 31 December 2000. A county database of reported cases constructed from the communicable disease report cards was used as the source of case information. Cases reported more than once in the county database were checked for co-infection, re-infection (more than 2 weeks since last chlamydial infection or gonorrhoea report, more than 1 month since last syphilis report), or duplication. Duplicate entries were removed from the county database. Before analysis, personal identifying information was removed from the county database to create the analytical database. The disease code on each report card was used to categorise each STD case into one of four diseases: chlamydial infection (chlamydial infection and non-gonococcal urethritis codes), gonorrhoea (gonorrhoea codes), syphilis (primary and secondary codes only), or HIV infection (HIV codes).
Yearly incidences were calculated using newly reported cases of chlamydial infection, gonorrhoea, syphilis, and HIV infection. Demographic characteristics were determined using univariate analyses of age, sex, and race/ethnicity.
STD cases were geocoded by matching addresses to an updated US Census Bureau Topologically Integrated Geographic Encoding and Referencing (TIGER) streets map for Wake County,17 in ArcView3.2.18 We checked for demographic differences between geocoded cases and cases that failed to match to a location using stratified analyses.
STD rates
We aggregated cases by census tract and then analysed and mapped incidence rates for each STD. We calculated the incidence rate of infection in the population for the year 2000 using the equation: ratei = (counti/populationi)×1000 for i = 1, …, 105 census tracts. Year 2000 census tract boundaries and population counts for residents 10 years old and older were obtained from the US Census Bureau.16,17
Spatial analysis and disease mapping
Kriging uses random field theory to produce disease estimates with minimal mean square error at nodes on an estimation grid. Various types of kriging have been used in past epidemiological studies including simple, ordinary, and intrinsic kriging.14,19–22 We conducted our spatial analysis of STD rates using simple kriging.14 STD rates were mathematically represented as spatial random fields (that is, a collection of realisations).14
We analysed the spatial variability of STD rates by calculating and modelling covariances. Covariance plots provide a quantitative assessment of the correlation between pairs of observations as a function of the distance between those observations, and they are useful in assessing the strength and scale of disease pattern where:
-
The overall spatial variability is summarised by the sill (y intercept) or the covariance at zero distance (surveillance data uncertainty). The greater the spatial variability, the greater the value of the sill.
-
The neighbourhood of influence is identified by the covariance range (distance where the curve becomes asymptotic to the x axis or where 95% of the correlation among points is lost). Observations within the neighbourhood of influence (distances less than the range) influence what is observed at the current location, but observations outside the neighbourhood of influence (distances greater than the range) are not influential.
-
Local disease patterns are described by the behaviour of the model near the origin. The sill and model behaviour near the origin indicate how much and how quickly the disease variability changes locally. A steep curve indicates rapid change or high variability, over a short distance while a shallow curve indicates slow change, or less variability, with increasing distance.
-
Global disease patterns are described by the behaviour of the model with increasing distance. An asymptotic curve implies that the disease process becomes spatially homogeneous, whereas a non-asymptotic shape suggests disease trends at a distance.
Directional covariance plots indicated that variation in STD rates remained the same in all directions across space. Therefore, we conducted our spatial analysis using omnidirectional covariance plots for each STD (termed “isotropic” covariances in random field theory).
Predicted STD rates and associated prediction errors were obtained for a 1000 metres by 1000 metres cell grid covering Wake County by kriging the observed data with an appropriate covariance model. Kriging was conducted using BMElib23 in Matlab.24 Final disease estimates, interpolated using a spline with tension and mapped using ArcView, were grouped for interpretation purposes into four or five equal intervals.
RESULTS
In all, 4553 STD cases reported to the Wake County health department in the year 2000 were over the age of 10 years and resided in Wake County. Sixty seven per cent (3055 cases) were chlamydial infection (1387 chlamydial infection and 1671 non-gonococcal urethritis), 28% (1265 cases) were gonorrhoea, 3% (121 cases) were syphilis, and 2% (112 cases) were HIV infection. Chlamydial infection had the highest incidence (4.87 per 1000) followed in order of decreasing incidence by gonorrhoea (2.01 per 1000), syphilis (0.19 per 1000), and HIV infection (0.18 per 1000). On average, reported syphilis and HIV infection cases were older, but not significantly older, than chlamydial infection and gonorrhoea cases. The majority of reported chlamydial infection, gonorrhoea, syphilis, and HIV cases were male and black.
Geocoding matched 88–90% of case addresses to a location, for each STD. The primary reasons STD case addresses did not match to a location included: (1) having an incomplete or invalid address (3–6%), or (2) having a valid address not included in the street map file (2–5%). Homelessness was another notable reason for syphilis cases failing to match to a location (2%), but was a minor problem for the other STDs (0.3–0.9%). Rural routes accounted for 0.3% of gonorrhoea addresses, 0.1% of chlamydial infection addresses, and none of the syphilis or HIV addresses. Age, sex, or race did not differ significantly between geocoded STD cases and cases that failed to match to a location.
Independent patterns of four reportable STDs
Covariance plots for each STD (fig 2) indicated that patterns of disease were more similar locally than at a distance and neighbourhood effects extended approximately 9.5 km for chlamydial infection, 8.5 km for gonorrhoea, 7 km for syphilis, and 6.5 km for HIV infection. Disease maps showed that each STD had a clustered distribution with one primary focal area of elevated infection rates (fig 3). Infection rates were heterogeneous within the primary focal area.
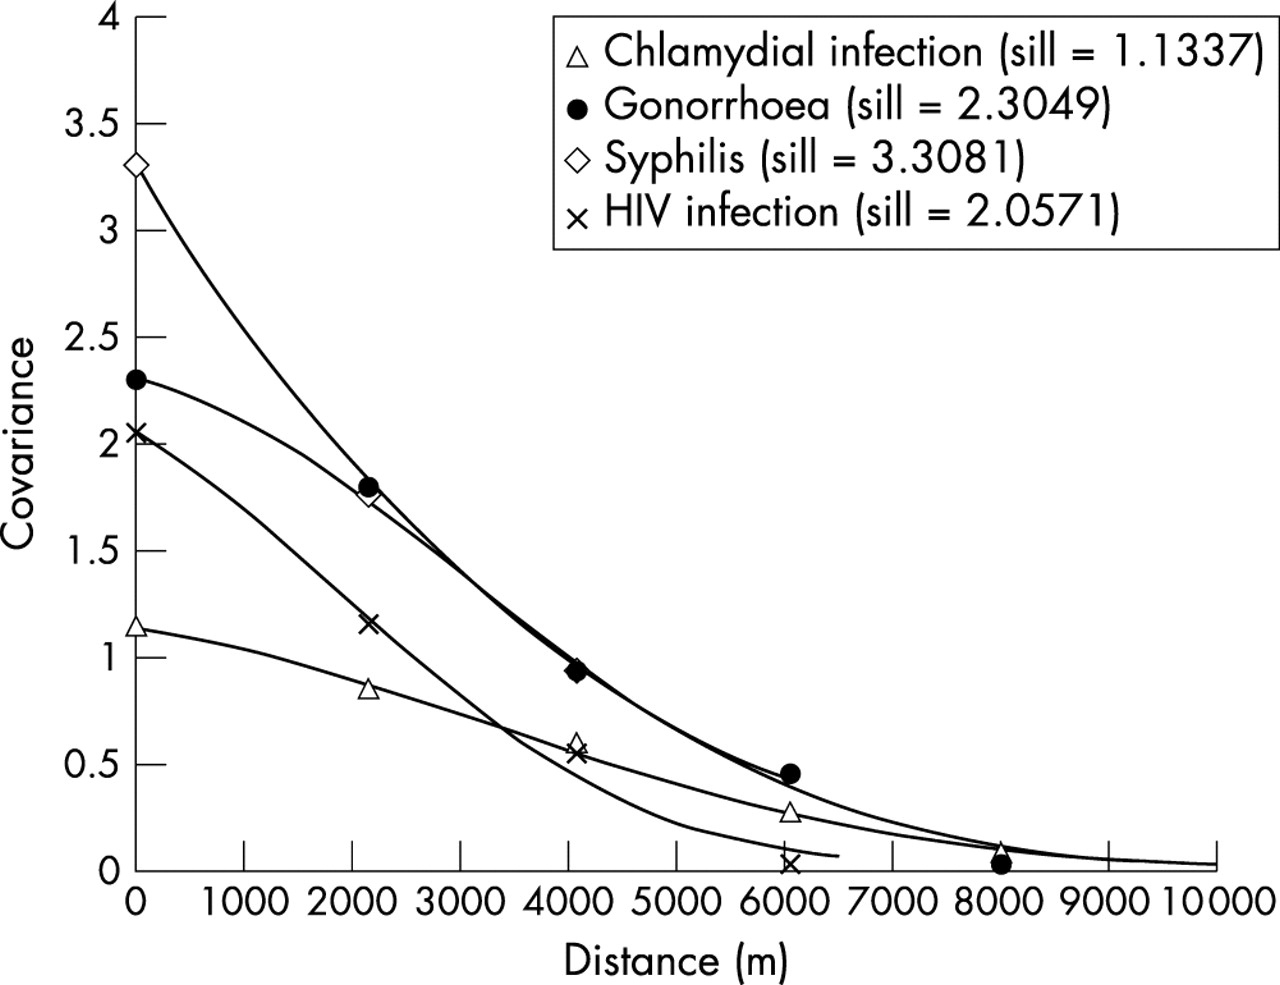
The spatial correlation structure of reportable sexually transmitted diseases in Wake County, North Carolina for the year 2000 described using covariances for infection rates.
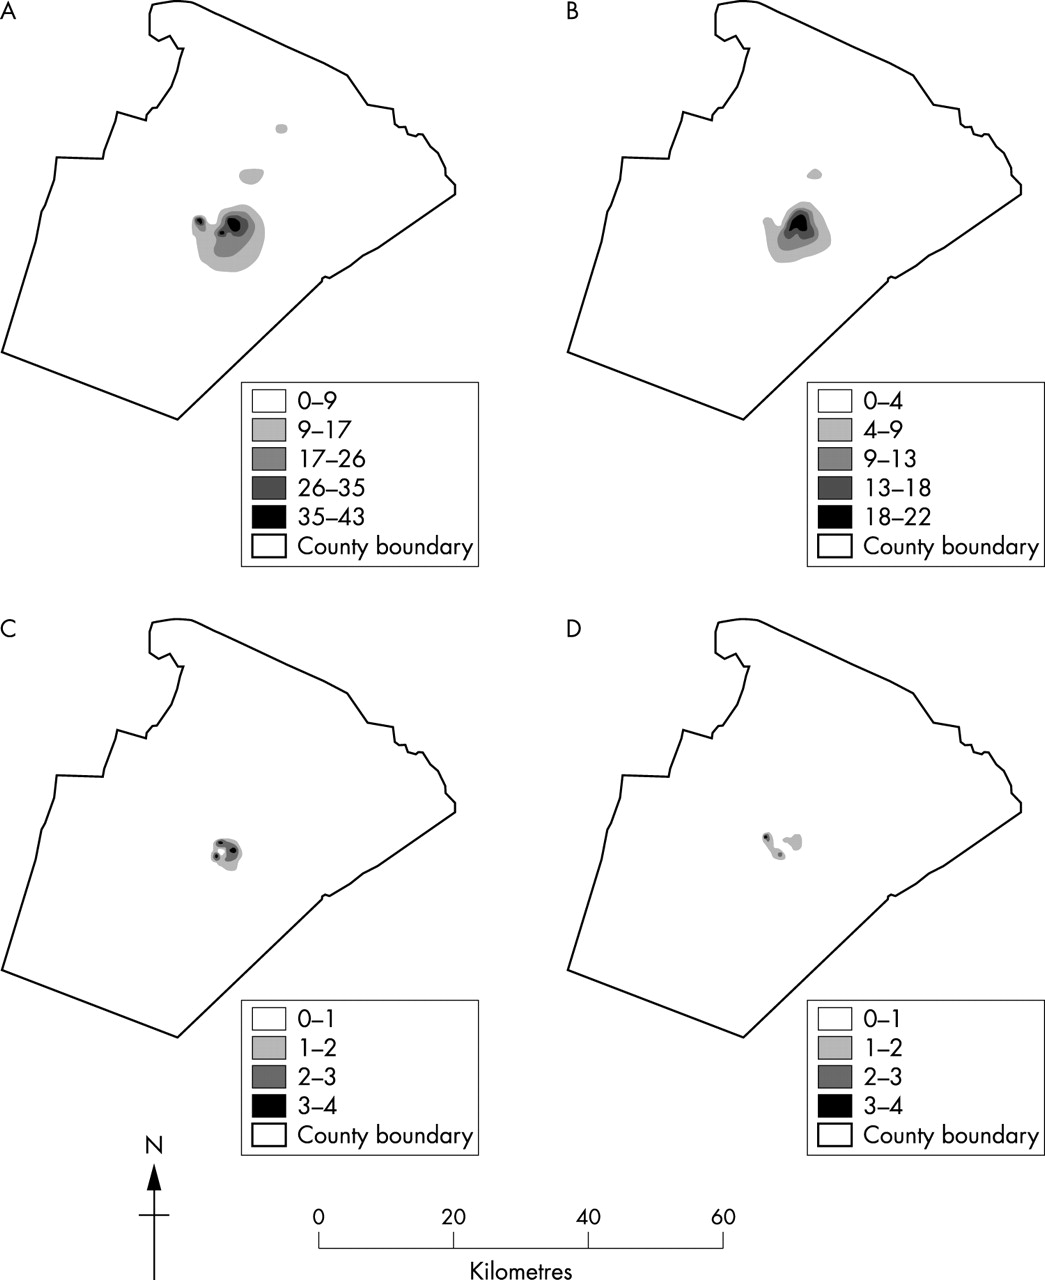
Spatial heterogeneity of STD rates for Wake County, North Carolina, for the year 2000: (A) chlamydial infection (county average = 4.87/1000), (B) gonorrhoea (county average = 2.01/1000), (C) syphilis (county average = 0.19/1000), (D) HIV infection (county average = 0.18/1000). Note scale differences between STDs.
Comparison of four reportable STDs
Lower incidence STDs had smaller neighbourhoods of influence and greater spatial variability (as measured by the ratio of the observed standard deviation and the observed mean (coefficient of variation, cov)) than higher incidence STDs. In particular, syphilis (cov = 2.0682) had the greatest spatial variability of the four reportable STDs, followed in order of decreasing variability by HIV infection (cov = 1.4046), gonorrhoea (cov = 1.3216), and chlamydial infection (cov = 1.0644).
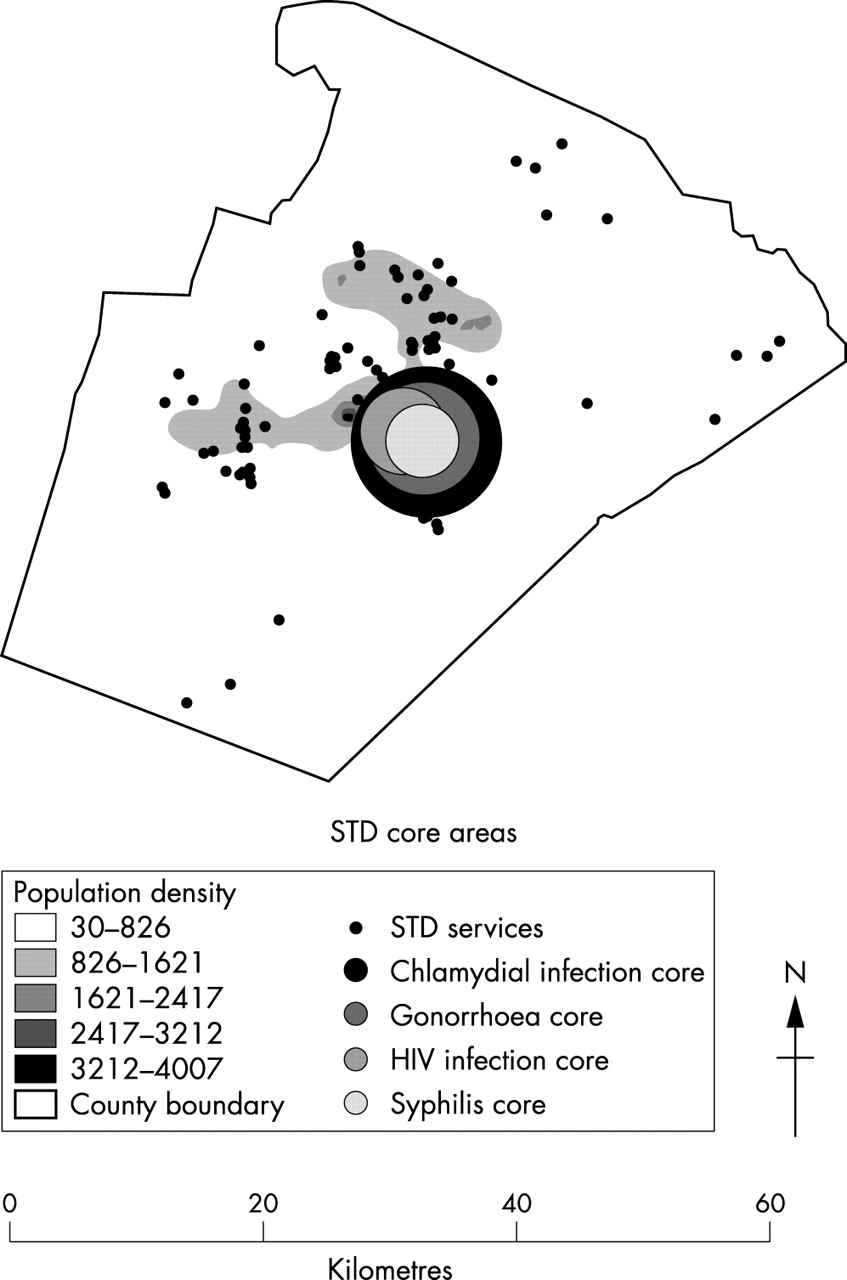
Overlapping the STD maps for Wake County showed that all four reportable STDs shared the same primary focal area of infection (fig 4). The focal area was most widespread for chlamydial infection rates, followed in order of decreasing dispersion by gonorrhoea, HIV infection, and syphilis. Clusters outside the primary focal area did not overlap for any of the STDs.

Overlay of primary core areas for chlamydial infection, gonorrhoea, syphilis, and HIV infection.
DISCUSSION
In Wake County, North Carolina, in the year 2000, chlamydial infection, gonorrhoea, syphilis, and HIV infection had clustered spatial distributions. Each STD had one primary focal area of infection where rates were higher than the overall county average. Primary focal areas overlapped for all four STDs and suggested a common core area of transmission. Each core area had multiple nested clusters of high infection suggesting different infected groups within the core.
Spatial prediction errors were lowest for STD estimates around the primary focal areas and census tract centroids, and highest for STD estimates near the county borders (data not shown). Low prediction error increases our certainty that the spatial patterns modelled for each STD are appropriate, comparable to small confidence intervals.
The validity of our disease maps depends on the quality of reported STD data. Contacts of HIV infection and syphilis cases are located actively in North Carolina, and this active surveillance increases our confidence in the spatial patterns generated. Conversely, chlamydial infection and gonorrhoea cases are passively surveyed and are likely to be under-represented in our data, despite screening and voluntary partner notification. If missing cases are disproportionately distributed over the area, the observed spatial distributions may not be adequate. However, if asymptomatic cases are missed randomly, the observed spatial distribution should be appropriate.
Missing STD cases could be disproportionately distributed if the spatial distributions of reported cases by STD healthcare provider were disproportionate. However, a stratified analysis of STD cases reported by provider type (county health departments, hospital emergency rooms, clinics, and private physicians) indicated similar spatial distributions (data not shown). Also, missing cases near the county border because of healthcare seeking in adjacent counties is unlikely since STD cases are reported to both the county of healthcare provider and the county of patient residence.
Methodological issues
The interpretation of our STD maps relies on the absence, or minimisation, of a modifiable area unit problem. A modifiable area unit problem occurs when different results arise from different methods of aggregation,25 which can happen if boundary changes divide, or encompass, clusters of cases. We attempted to minimise the potential for a modifiable area unit problem by mapping disease rates, which should not be significantly affected by changes in aggregation area given the scale of our study.
Interpretation and implications
Our results have important implications for targeting STD intervention and prevention strategies, especially in Wake County. Clearly defined core areas for each STD indicate that reportable STDs are spatially heterogeneous and, therefore, intervention and prevention strategies should not be uniformly targeted across the county.26 Uniform interventions, especially ones focusing on treatment to prevent spread, will underestimate the critical fraction that needs to be treated in core areas, and overestimate the critical fraction in non-core areas. Core areas of infection also suggest that transmission rates are likely to be higher within core areas than outside core areas, especially given the high probability of local partner selection. Consequently, demographic and risk factor characteristics of core areas should be investigated further to better target interventions to those areas. Additionally, non-traditional and alternative HIV testing sites should be located in the primary core area. Overlapping core areas suggests that intervention strategies can be combined and targeted to core areas.
Furthermore, STD services should be enhanced in the core. STD healthcare providers tended to be concentrated outside the primary core area where the population density was high, but STD rates were low (fig 4). Conversely, resources were scant within the primary core area leaving the county health department and hospital emergency room, located just outside the north eastern perimeter of the core, to provide the bulk of STD services to the core. Enhancing services within the core could be a good strategy for reducing the incidence of STDs and HIV infection in the community as a whole.
Our methodological approach has important implications for disease surveillance, outbreak investigation, and response. Firstly, our approach generates disease maps based on surveillance data, which can often provide a more comprehensive picture of the pattern of disease than interviewing knowledgeable public health practitioners and community members, especially at state, regional, national, and international scales. Secondly, our maps display a continuous surface of STDs which can significantly decrease the area intervention teams need to cover to suppress an outbreak compared to maps of disease by geopolitical units. Targeting can be further refined by incorporating estimates of spatial variability and the neighbourhood of influence.
Key messages
-
We contribute evidence for the emerging theory that core areas of STD transmission can be defined spatially.
-
We contribute evidence that STD core areas can overlap geographically, even if the populations at risk are different, and that, consequently, interventions can be combined.
-
We use and describe an objective, population level approach to spatial analysis and mapping that can help identify emerging outbreaks but has not been applied to sexually transmitted diseases previously.
-
We mapped STDs as continuous surfaces of infection, which has not been reported previously, to limit the area disease intervention teams must investigate to suppress an outbreak.
Random field modelling and kriging estimation constitute an objective, population level approach to identify and analyse the spatial pattern of reportable STDs in Wake County, North Carolina. Our methodological framework can be used to map incidence rates of STDs, or other infectious diseases, automatically as they are reported, which can enable county and state health departments to identify emerging outbreaks in near real time.
Acknowledgments
Our work was funded primarily by a collaborative agreement between the Centers for Disease Control and Prevention and the North Carolina Department of Health and Human Services. Dr Miller was supported by the Clinical Associate Physician Program of the General Clinical Research Center (RR00046), Division of Research Resources, National Institutes of Health. Drs Christakos and Serre were supported by the National Institute of Environmental Health Sciences (P42-ES05948 and P30-ES10126).
CONTRIBUTORS DCGL helped develop study ideas and analysis, managed data, conducted analysis, provided interpretation, and led writing the manuscript; MLS provided extensive guidance on applying the method of analysis and assisted with programming; GC conceptualised the method of analysis and provided guidance on its application; PAL provided access to data and aided in the interpretation and application of study results; WCM helped conceptualise the study idea, supervised all aspects of its implementation, and aided in the interpretation and application of study results; all authors helped interpret findings and reviewed drafts of manuscripts.