Article Text

Abstract
Objectives: To estimate the average cost per screening offer, cost per testing episode and cost per chlamydia positive episode for an opportunistic chlamydia screening programme (including partner management), and to explore the uncertainty of parameter assumptions, based on the costs to the healthcare system.
Methods: A decision tree was constructed and parameterised using empirical data from a chlamydia screening pilot study and other sources. The model was run using baseline data from the pilot, and univariate and multivariate sensitivity analyses were conducted.
Results: The total estimated cost for offering screening over 12 months to 33 215 females aged 16–24 was £493 412. The average cost (with partner management) was £14.88 per screening offer (90% credibility interval (CI) 10.34 to 18.56), £21.83 per testing episode (90% CI 18.16 to 24.20), and £38.36 per positive episode (90% CI 33.97 to 42.25). The proportion of individuals accepting screening, the clinician (general practitioner/nurse) time and their relative involvement in discussing screening, the test cost, the time to notify patients of their results, and the receptionist time recruiting patients had the greatest impact on the outcomes in both the univariate and multivariate sensitivity analyses.
Conclusions: Results from this costing study may be used to inform resource allocation for current and future chlamydia screening programme implementation.
- CI, credibility interval
- GP, general practitioner
- GUM, genitourinary medicine
- LCR, ligase chain reaction
- PID, pelvic inflammatory disease
- STI, sexually transmitted infection
- healthcare costs
- chlamydia screening
Statistics from Altmetric.com
- CI, credibility interval
- GP, general practitioner
- GUM, genitourinary medicine
- LCR, ligase chain reaction
- PID, pelvic inflammatory disease
- STI, sexually transmitted infection
Genital Chlamydia trachomatis infection is the most common sexually transmitted infection (STI) diagnosed in genitourinary medicine (GUM) clinics in the United Kingdom.1 It is mainly asymptomatic and may lead to pelvic inflammatory disease (PID) in a proportion of untreated cases, which in turn may cause ectopic pregnancy and infertility in women.2 Asymptomatically infected individuals may not have adequate opportunity or seek to be tested, leaving a reservoir of hidden infections and risk of sequelae. Therefore, screening at-risk populations can identify and treat asymptomatic infection, reduce sequelae, and perhaps impact the associated long term healthcare costs.3,4
The decision to implement opportunistic chlamydia screening may be based in part upon results from economic analysis, which have been undertaken using various screening assumptions.5,6 A review of other cost effectiveness studies by Honey et al7 found that depending on the model assumptions, screening females for chlamydial infection can be cost effective under various baseline prevalence estimates, especially when age is used to select women and DNA testing methods are used. In England, chlamydia screening is currently being implemented in phases across the country.8 It is, therefore, timely to assess the cost of such a screening programme and examine in detail the relative contribution of the cost elements, using a combination of data such as the time involvement of personnel, variable costs, and overhead costs. As screening encompasses more sites across the country, information from this study may be particularly useful as it directly feeds back into programme implementation, and may help other sites that are planning and undertaking screening programmes elsewhere.
In this study, a decision analytical model was used to estimate the average cost per test offer, cost per testing episode, and cost per chlamydia positive episode, based on the costs incurred by the healthcare system. The model structure gives the ability to change the model assumptions and run a series of “what if” scenarios (for example, what if the role of practice nurses is emphasised over doctors’ roles in discussing screening). It also allows for detailed analyses of uncertainty on how patients move through the screening process for both patient flow and the costs of the programme. The results from this analysis may help to advise on appropriate resource allocation to minimise screening costs and improve the efficiency of future screening programmes in the United Kingdom and elsewhere.
METHODS
Screening methodology
Data on patient flow came from a pilot study funded by the Department of Health (England) to evaluate the costs, acceptability, and feasibility of opportunisitic chlamydia screening; these methods have been fully described elsewhere.9,10 This analysis included 16–24 year old females who were offered screening when attending GUM clinics, family planning clinics, antenatal clinics, termination of pregnancy clinics, and general practitioner (GP) surgeries. The study was undertaken between 1 September 1999 and 31 August 2000 in Portsmouth and Wirral, England. Although some men were also offered screening opportunistically at GUM and youth clinics those data are not included here. In the pilot study, research nurses were responsible for managing patients and their partners. In this analysis, we have estimated the costs of a health adviser who would have a similar role with patient and partner management. Women who accepted a test offer were asked to submit a urine sample for ligase chain reaction (LCR) testing (LCx Chlamydia trachomatis assay, Abbott Laboratories Diagnostic Division). Patients in the pilot study with an insufficient diagnosis were advised to get another test, and patients with an equivocal result were given the option to be treated or retested. The model used in this analysis assumed that patients with a final diagnosis of positive, insufficient, or equivocal were asked to attend for treatment (azithromycin or doxycycline; alternative regimen used for pregnant women). The positive patients were also asked to report any sexual partners from the past 3 months. For the reported partners, contact was attempted (either by the patient or the health adviser), and the partner(s) was asked to attend, receive prophylactic treatment, and give a urine sample for LCR testing. A small subset of partners was tested using other methods (n = 20); these were not included in this analysis.
Decision analysis model
Two linked decision trees (Precision Tree, version 1.0.4, Palisade Corporation) were constructed to simulate the flow of female screening episodes from initial test offer to patient treatment and partner reporting (fig 1A), and contacting partners and partner management (prophylaxis and testing) (fig 1B). Two of the nodes have branches with the same outcomes (or next steps), which are linked in the model (that is, all insufficient/equivocal diagnoses are treated as positives and go to the treatment node, and individuals may have reported partners without receiving treatment). Each node of the model returns the number of patient episodes and the expected average value of the model at that point.
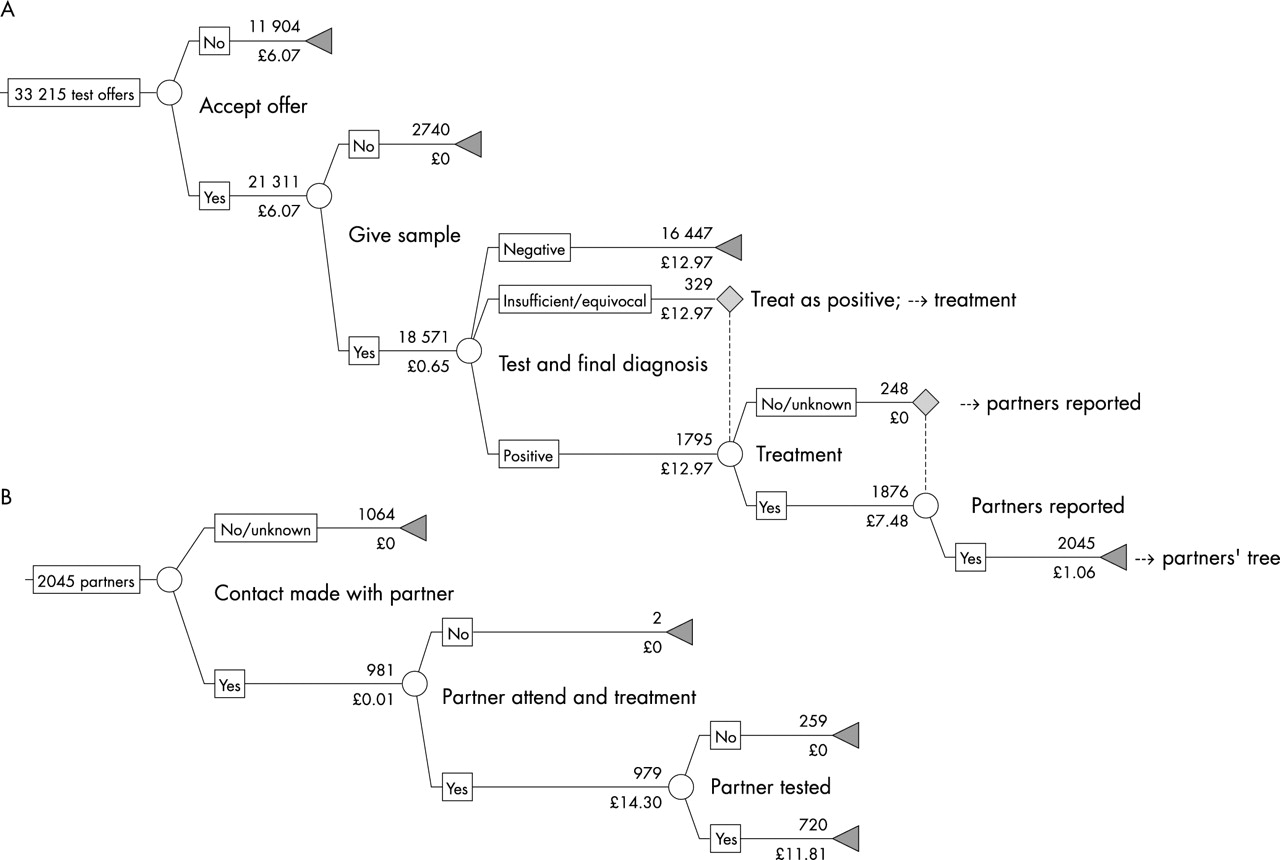
Schematic diagram of the screening trees used in the analysis. (A) Patient tree; (B) partner tree. For each branch option, the number who flowed through that branch is given above the line, and the baseline cost is below. Triangles indicate a branch termination, and broken lines indicate a flow to another node.
Patient data extraction
In the pilot screening model, patient testing and management spanned across various healthcare settings. The methodology of the pilot study stated that patients would be tested in a variety of settings but treatment and partner notification would be undertaken in GUM clinics, by health advisers or at the site of testing. This analysis combined the number of patient episodes through each step of the tree across healthcare settings, instead of using individuals as the unit of measurement. Since some women were tested more than once and in various clinical settings,9 each time they were offered a test they would have been included in the total number of patient episodes. This was thought to better estimate the true costs to the screening programme. However, this may contribute to a different acceptance rate than if the results were estimated based on the number of women who accepted testing, instead of counting each occasion they were offered a test. Data were also combined from Portsmouth and Wirral to give an average estimate of the value of such a screening strategy.
Two researchers (DSL, ARJ) extracted the data for each branch of the decision tree using different methods to check for accuracy (Stata, version 8.2, Stata Corporation, and SPSS, version 11.0, SPSS Inc). In both methods, screening episodes from men, women aged <16 years or >24 years and any test of cure episodes were excluded from the analysis. For both extraction methods, a stepwise approach was used following the decision trees (figs 1A, B) with the test records filtered at each node.
Costs
The overall healthcare costs of screening were estimated from direct costs from the pilot study (preliminary invoiced expense forms supplied by the Department of Health, Economics and Operational Research Division) and additional costs borne by the healthcare system (that is, clinicians involved in screening who did not receive remuneration from the screening programme, etc). Incorporating both types of costs was thought to more closely estimate the true costs of a chlamydia screening programme, by taking on the wider healthcare costs (but excluding the social costs and costs to the patient). The included costs were not all paid for directly by the screening study itself, and therefore would not necessarily be funded in a nationally implemented programme.
The planning and set-up costs of the screening programme were included and were based on the pilot invoiced expenses. Costs deemed to be associated with the research side of the pilot screening programme were excluded from the analysis (that is, personnel costs for analysis relating to the study evaluation, since the pilot was a research study to evaluate the feasibility and effectiveness of chlamydia screening). Recruitment of staff and laboratory upgrade costs (from EIA to NAAT testing) were also excluded.
In the pilot, a fee was paid to the clinicians for each chlamydia test initiated. However, this cost was excluded from the analysis, as it is unlikely to continue in the phased implementation of the national programme. Instead, their time costs have been accounted for in the analysis by estimating the cost of a consultation with a healthcare clinician to offer screening to a potential patient (see below).
All costs were inflated to reflect 2001 prices (£ sterling), using the Hospital and Community Health Services inflation indices for either prices or pay.11 The adjusted costs included all overhead costs and some of the unit costs (noted in tables 1 and 2).
Total annual overhead costs used in the analysis based on invoiced expenses from the chlamydia screening pilot study
Total variable costs at each node of the decision tree (in bold) and their constituent inputs
Overheads
There was an overhead fixed cost for the screening infrastructure, personnel and running the programme (table 1). These costs were taken from the expenditure reports and include one off and recurring costs.
While the patient flow data were taken over a 12 month period, the screening study and associated costs were incurred roughly over 2 years. Therefore, the total costs were annualised to allow for comparison with the study period data. One-off costs, including refrigerators, computers, and office furnishings, were assigned an estimated lifespan of 5 years, and an annual cost per item was estimated12 using a discount rate of 3.5%.13 Only one of the sites supplied these one-off costs, so these total annualised costs were doubled to account for both sites. The personnel (that is, administrators, screening coordinator, etc) and running (that is, telephones, travel/transport, etc) overhead costs from both the Portsmouth and Wirral sites (including set up and pilot costs) were halved to estimate an annual cost per item. An overhead cost per patient screening episode was estimated from the total overhead costs.
Costs at each branch
Variable costs were added at each step in the decision tree (table 2). To estimate these, costs of materials and personnel were summed (derived from the mean Portsmouth and Wirral costs when data were available). Personnel costs were derived from the estimated salary of a typical healthcare worker who would see a patient or partner (receptionists, GPs, practice nurses/health advisers, and GUM consultants), and included qualification costs, ongoing training and other additional costs such as overhead costs, to estimate the actual opportunity costs.11,14 In the pilot, women were screened at various clinical settings and would have spoken to various healthcare personnel. This analysis assumed that the salary of a practice nurse or health adviser (both assumed to be a grade F nurse in the NHS pay scale11) would give a lower cost estimate, and that of a GP clinician an upper estimate. The relative involvement of both clinicians was assumed to be 50%, but was allowed to vary in the sensitivity analysis (see below). These annual costs were used to derive the cost per patient related minute (except for receptionist, which was just a cost per minute), using data on the average number of weeks worked per year, and the average number of hours per week.11
These data were then combined with estimates of the time spent on different screening and related activities. To obtain this, a questionnaire was sent to the primary research nurses involved in the original chlamydia screening pilot in both sites, asking about the time spent on specific activities during the screening process. These estimates were not directly measured while the pilot was conducted, and therefore are based on retrospective accounts. The baseline estimates represent an average when data from both sites were available.
The total cost of a patient (or partner) flowing through various parts of the tree (with different outcomes) will simply be the sum of the branch costs through which she or he flows.
Outcome: estimated average cost of screening
Three main outcomes were estimated: the average cost per screening offer; cost per testing episode (giving a urine sample and testing, regardless of the outcome), and cost per positive episode. The cost estimates are additive, such that the cost per testing episode includes the cost per screening offer and the cost per positive episode includes the cost per testing episode. These are simply the weighted average of all possible outcomes (and associated costs) for that decision node and all subsequent nodes. For example, the cost per offer is the weighted average of the cost of all the occasions a test offer was not accepted and the cost of all occasions a test was accepted and all of their subsequent downstream costs. Likewise, the cost per testing episode is the weighted average of those testing negative and those with a diagnosis of positive, insufficient, or equivocal. For all outcomes, these costs include those of accepting a test, the laboratory costs of testing, and the costs of notifying them of their results, and also include the weighted costs of those testing positive that may include the additional costs of treatment and partner notification for a proportion of positives.
All outcomes included the costs of partner management (contacting, treatment, and testing) as these are all part of the screening structure and contribute to the cost of the outcomes. These outcomes were assessed from the healthcare provider perspective, incorporating the costs of the screening programme and the associated wider healthcare costs. The baseline costs were used in the primary analysis.
Sensitivity analyses
Sensitivity analyses were undertaken to assess which costs and patient flow values were most important to the outcomes, and to explore the range of possible outcomes (given some parameter uncertainty) for this screening programme. The costs of such a screening programme are variable and may depend on the personnel involved in counselling and testing (that is, whether a general practitioner, health adviser, or GUM consultant discusses screening with a patient), the cost of the LCR test (which often varies between laboratories), and the numbers of patients and their partners who flow through the screening and partner decision trees.
Parameter values were drawn from specified distributions. The patient flow through the model was based on data from the pilot and was binomially distributed (proportion at each branch and the total number). The cost and the time components were mainly drawn from uniform distributions to represent a large degree of uncertainty (with any value randomly drawn from the range). Triangular distributions were assigned when there was considerable evidence that the mean closely approximated the baseline value. Then, the value used for each simulation was more likely to be drawn from a value closer to the mean. The baseline and maximum and minimum values used are given in table 2 along with the assigned distribution.
The screening programme modelled here is just one of many possible options. Therefore, univariate sensitivity analyses were performed, which varied one of the model assumptions at a time, and we then compared results to the baseline model outcomes. The input parameters were varied between the minimum and maximum values given in table 2. Additionally, several other “what if” scenarios were tested, in which one or two of the parameters were changed. This included (a) changing the relative time a receptionist rather than GP spent with a patient during screening recruitment (that is, if a receptionist spends 3 minutes recruiting each patient then a GP spends only 3 minutes per patient; or no receptionist involvement then 10 minutes of GP time per patient), (b) excluding the cost of a consultation with a clinician for non-test acceptors, (c) varying the test acceptance rate from 34% to 94% (roughly a 50% change from the baseline of 64%), (d) including a lower LCR test cost estimate of £9, thought to be more realistic of the test costs for a larger scale screening programme, and (e) changing the chlamydia prevalence of tested patients. The prevalence range was based on a lower estimate of 3% found in 18–24 year old females in a population based survey,15 and on an upper estimate of 18% found in females aged 16–24 attending GUM clinics.10 The estimate for prevalence was driven by data from the decision analysis model, and it was assumed that positivity was an approximate estimate for prevalence.16 It was estimated by: (positive + equivocal + insufficient tests)/total tests. In this analysis the baseline prevalence was estimated to be 11.4%, based on the above equation and data on screening episodes, and differed slightly from the estimated prevalence in the pilot study.10
A probabilistic multivariate sensitivity analysis was also performed using @risk (version 4.0.5, Palisade Corporation) running within Excel (version 2000, Microsoft). The analysis was run 1000 times, and at each simulation parameter values were randomly drawn using Latin Hypercube sampling. The parameters that varied were the input costs and times with ranges given in table 2, the distribution of individuals flowing through the tree (drawn from binomial distributions described above), and the acceptance rate (triangular distribution: minimum 34%, mean 64%, maximum 94%). Distributions for the outcome variables (cost/offer, cost/tested, cost/positive) were generated along with non-parametric 90% credibility intervals (CIs)—that is, 90% of the model simulations fell within the upper and lower CI.
RESULTS
The estimated overall annual cost of the opportunistic screening programme based on offering screening to 33 215 women aged 16–24 was £493 412. Of these costs, 80% (£394 429) were the variable patient costs, 5% (£22 515) were associated with partner management costs, and 15% (£76,468) were overhead costs for running the programme. Thirty nine per cent of the costs were personnel costs (including overheads and variable costs). About a third (37%) of the total costs were associated with the test kit cost (excluding testing personnel). These estimates are specific to the number of screening episodes examined in this analysis.
The estimated average cost per test offer given the flow of individual testing episodes in the pilot was £14.88 (90% CI 10.34 to 18.56), which included all of the downstream costs of testing, notifying patients of results, treatment and partner notification for positives, and all of the partner management costs. The average cost per testing episode was £21.83 (90% CI 18.16 to 24.20) including all downstream costs and partner management. The estimated average cost per positive episode was £38.36 (90% CI 33.97 to 42.25), which included a proportion of positive episodes having treatment and partner management. If the partner management costs were ignored, the average cost per screening offer, testing episode, and positive episode were reduced to £14.18 (90% CI 10.01 to 17.80), £20.57 (90% CI 17.18 to 22.63), and £27.35 (90% CI 24.29 to 29.98), respectively. If the partner tree was examined alone, the expected average cost per partner contact was £11.01 (90% CI 9.12 to 13.23), a weighted average of the costs of contact made with a proportion of partners, and partner treatment and testing for a proportion of partners.
Sensitivity analyses
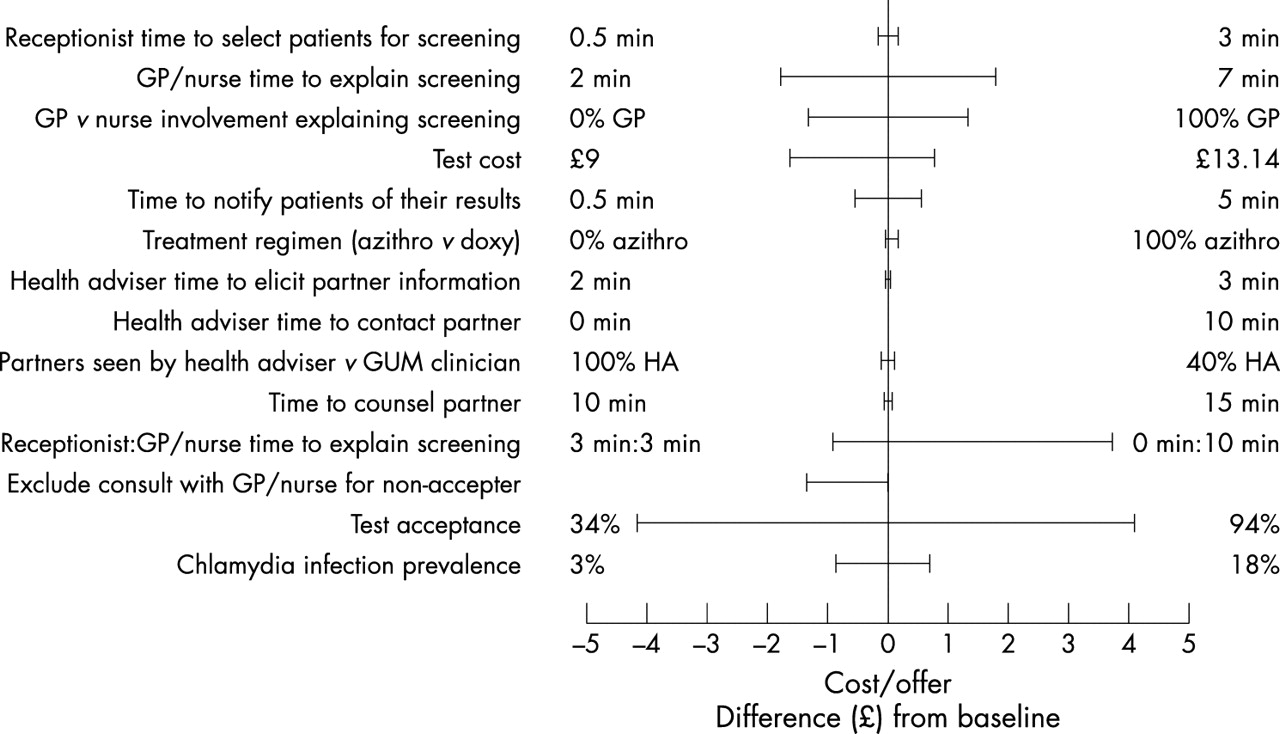
In the univariate sensitivity analysis, varying the proportion accepting the test offer had the greatest expected impact on the cost per screening offer compared to the baseline result (fig 2). As the test acceptance increased, so did the cost per offer, and vice versa as the acceptance decreased (£18.98 for 94% acceptance; £10.74 for 34% acceptance). The relative role of the receptionist in explaining screening (compared to GP involvement) also had a large impact (25% difference from baseline) on the cost per offer. As the receptionist spent more time explaining screening and the clinicians spent less time, the average cost per offer declined from £18.59 to £13.98. Similarly, as the time associated with primary care clinicians (doctors or nurses) explaining screening to patients decreased, so did the average cost per offer.

Results from the univariate sensitivity analysis. The difference (£) from the baseline cost per test offer for various parameters tested individually from their minimum to maximum values. A negative difference denotes a cost savings from the baseline.
Several of the parameters had a moderate impact on the outcomes (12% or less change from the baseline results). These included the relative involvement of GP versus practice nurse explaining screening to patients, excluding the healthcare worker consultation for non-test accepter, the test cost, and the prevalence of chlamydial infection. A two way analysis of the prevalence and the proportion accepting a test indicated that the prevalence had little impact on the outcomes, compared to the proportion accepting a test that had a large impact on the cost per test offer (fig 3).
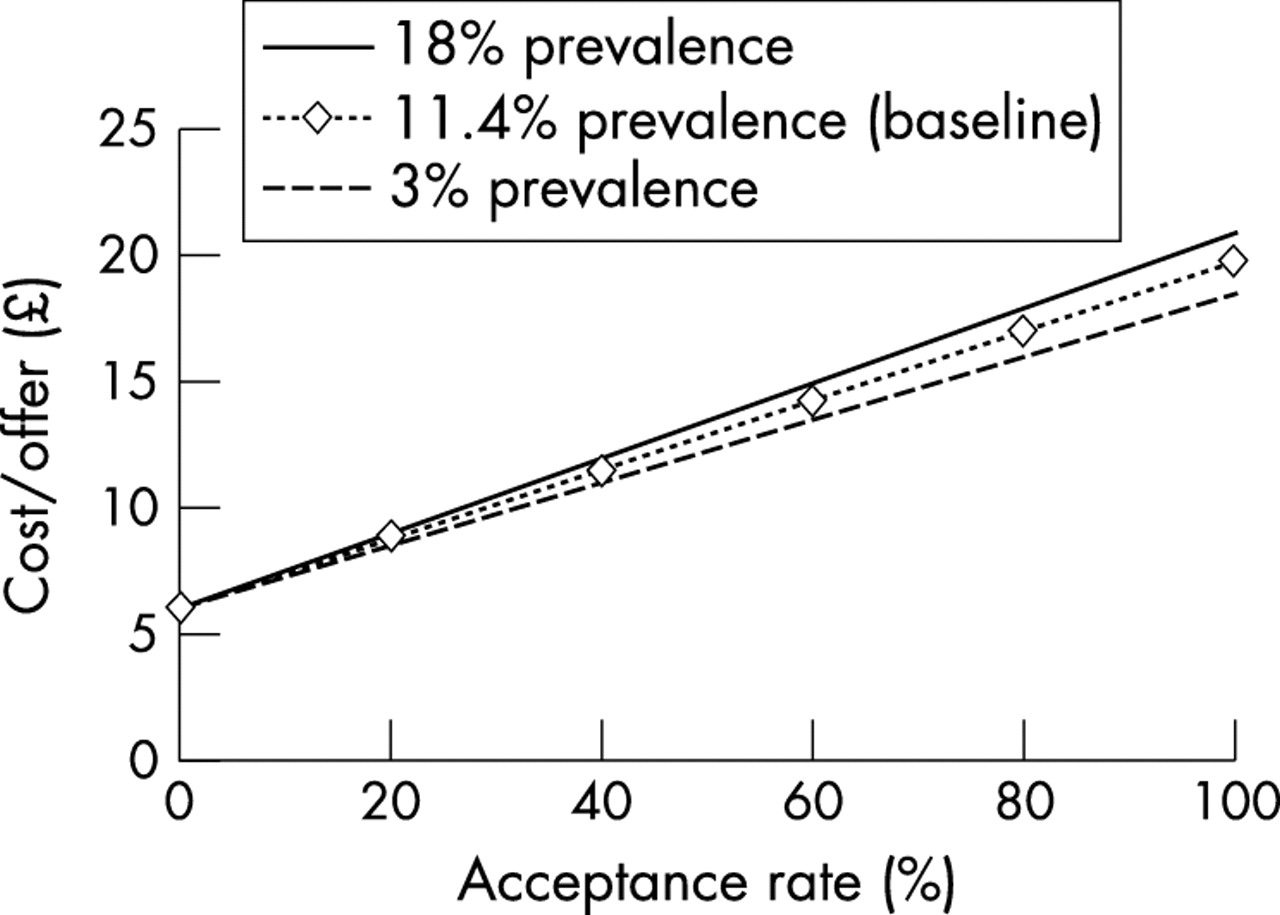
Results from the two way sensitivity analysis of prevalence and acceptance rate; change in the cost (£)/offer.
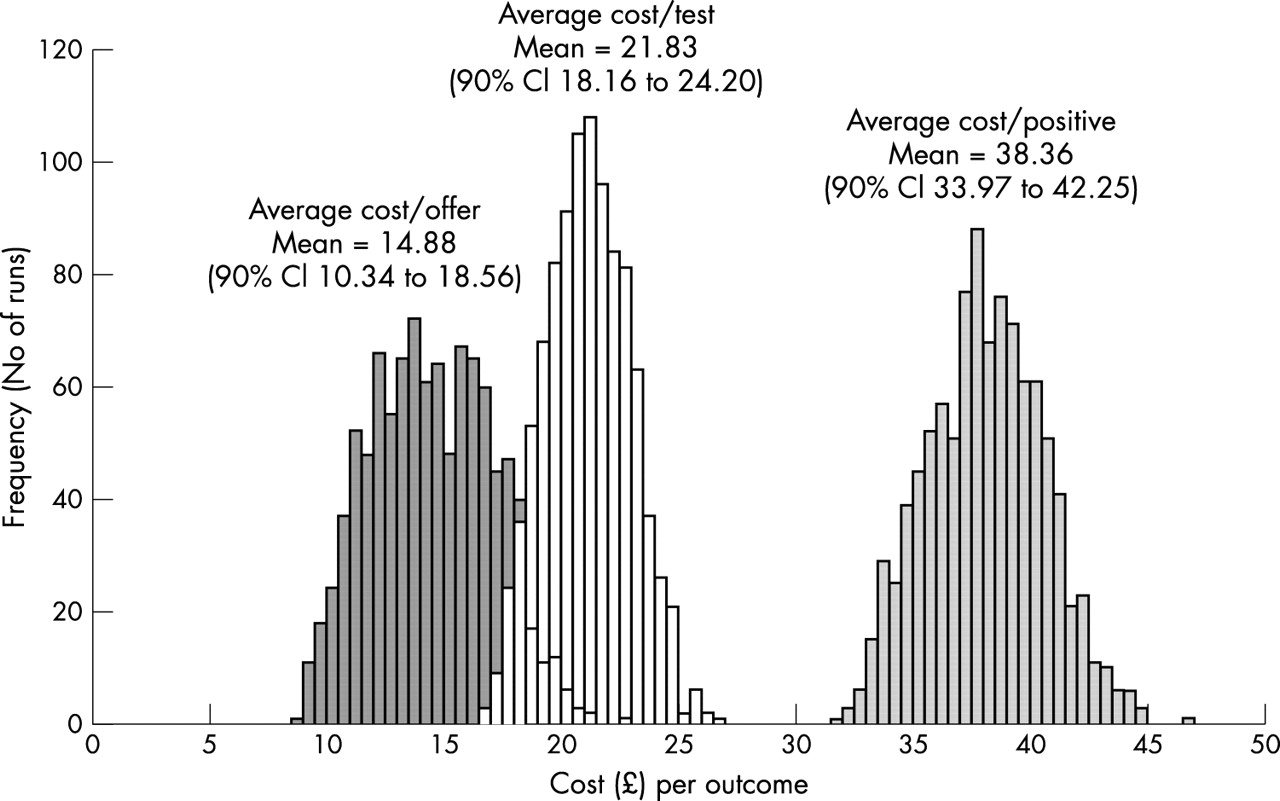
The distribution of the results from the multivariate sensitivity analysis is shown in figure 4. The estimated average cost per positive individual was less certain (had a wider range of possible values) than the cost per offer and cost per individual tested. The multivariate sensitivity analysis results indicated that the parameters that impacted most on the outcomes were (in order of importance): the proportion accepting a screening offer, the relative importance of GP versus nurse involvement in discussing screening and patient recruitment, the GP/nurse time to discuss screening before test acceptance, the total laboratory test cost, the time to notify patients of their results, and the receptionist time spent selecting and recruiting patients.

Results from the multivariate sensitivity analysis; frequency distribution of outcomes for 1000 runs, including partner management costs.
DISCUSSION
This analysis provides estimates of the average cost of screening from the healthcare perspective. The average cost per screening offer was about £15 including partner management. It was an additional estimated £7 more (£21 total) per person tested, and £16 more than that per person positive (total about £38).
Varying the proportion that accepted a test had the largest effect on the cost per offer, since the participants largely drive the overall costs of the screening programme. While a high test acceptance rate accounts for higher costs, it may help identify the greatest number of infections if the correct population is tested. Identifying cases through screening with the aim to reduce transmission and prevent sequelae may save money in the longer term. This is an area of ongoing research, and can be better addressed with cost effectiveness studies.
Since the laboratory test cost was important in the sensitivity analysis (in part because more than one third of the total screening cost came from LCR testing), determining the most accurate value for this variable will provide a better estimate of the overall costs of screening. Variations in laboratory cost may be explained by differences in the LCR test kit cost and laboratory personnel, and some local variation is expected. There are also various laboratory options, for the testing process including leasing equipment, buying equipment, and renting reagents, that can be examined to see if test costs can be reduced to drive down the overall laboratory costs.
Partner management contributed only 5% of the overall costs, yet it is an important part of a screening programme. While screening females will detect their infection, partner notification will identify male partners at risk who may not otherwise be tested, and treating partners may prevent both re-infection and onward transmission of chlamydia. The costs of partner management were included in the screening model, and it does not appear to make a difference to the cost per screening offer or cost per testing episode if it is included or not, although it does impact the cost per positive episode.
The infrastructure in place for screening may remain (for example the overheads), irrespective of the numbers being tested and treated, at least in the short run. Roughly 25% of the overhead costs were one-off costs such as capital items (refrigerators, office furnishings, computer equipment) that would probably not need to be spent again if more tests were done. These costs would, however, be necessary if a new site were to implement a screening programme. Screening start-up costs may be used for these capital costs, unless they could be accommodated and streamlined within the current healthcare infrastructure. This could be explored in future analyses.
Results from the multivariate and univariate sensitivity analyses highlight areas of uncertainty in the data that influence the costs of screening. For example, the time spent by clinicians explaining screening had a large impact on the costs because of its high variability and impact on all screening offers. Refining this and other estimates may give more precise estimates of the costs involved. However, some of the costs incurred in the pilot study, such as clinician time explaining screening, may not be incurred in future screening paradigms8 because patients will be expected to self select for screening and there would be minimal involvement of staff for recruitment. Time and motion studies can be conducted to better understand the flow of people through screening and the costs involved in each step. This information can be used to streamline the process and reduce costs within the existing infrastructure.
The costs and resources will be dictated at a local level to a certain extent, so variation in the outcomes would be expected if this analysis were done for other sites. However, the results from this analysis may also provide a point of reference for evaluating future screening proposals.
There are several reasons why this analysis adds greatly to the information about the cost of genital chlamydia screening. Firstly, the model input data on the patient and partner flow were taken directly from the pilot study. Secondly, much of the cost data also came directly from the pilot invoiced expenses, so is thought to accurately represent the current costs of a screening programme. Thirdly, the individual patient data allow direct estimates of the mean and variance in proportions at each node. This, combined with the flexible model structure and ability to simulate alternative scenarios, provides a powerful tool to explore the average costs of screening, the uncertainty in these estimates, and the cost under different scenarios.
Cost effectiveness studies of chlamydia screening address a different issue from the one in this analysis, but they require similar screening costs. In this analysis, the detailed costs at each step of the tree are examined, and include costs from the wider healthcare system such as personnel who have contact with potential patients in settings where screening is offered (receptionists, nurses, general practitioners), overhead costs of running a screening programme, screening set-up costs, and partner management costs. These may be included in other studies estimating the cost effectiveness of screening, depending on the assumptions about the infrastructure and organisation of the screening programme. Some studies have estimated the time and relative involvement of healthcare workers for different outcomes (PID, ectopic pregnancy, infertility),6,18,19 but this is the only recent analysis to explicitly estimate the time and costs at each step of a screening programme. The method presented here provides a more precise estimate of the cost of patients with a specific outcome flowing through the screening tree.
This analysis was done from the health provider perspective. It included screening costs and also those of other healthcare personnel involved in the screening process. However, there are other costs that are not included, such as patient costs and the wider societal costs. For example, there may be costs to a positive patient in terms of time lost from work to travel to a clinic to receive treatment, and similar costs for a partner. Another large chlamydia screening study is collecting patient costs as part of their study, which should provide more information when the results are published.20
Only the screening costs were included in this analysis, and none of the averted costs from preventing infection and sequelae were estimated. For example, preventing PID or ectopic pregnancy may be a result of screening and treating asymptomatic infection through a screening programme. Other costs and modelling studies have included these sequelae and the estimated costs saving from averting infection and/or complications.5,6,21,22 Results from this analysis combined with the identified costs of sequelae will be used in further modelling and economic studies.
Key messages
-
This study estimates the healthcare costs of opportunistic chlamydia screening in clinical settings in England. It is based on empirical data from a recently completed chlamydia screening pilot study and uses decision analytical modelling techniques to explore the uncertainty of results and the impact of changing key assumptions in the screening paradigm.
-
The average cost per screening offer is approximately £15 (under baseline assumptions); these are costs incurred by both the screening programme and the healthcare system in which screening occurs. Sensitivity analyses highlight the elements of screening where costs could be targeted for reduction, including lowering the laboratory test costs and reducing clinician involvement in screening.
This analysis provided the average expected cost of screening, based on detailed data, and provides a novel framework for estimating the costs and uncertainty of a screening programme. The uncertainty analyses provided information about the relative importance of different components of the screening model that may direct what information should be collected in future studies. Results may help advise in the phased chlamydia screening implementation planned for future areas in England, and for screening programmes elsewhere.
Acknowledgments
Thanks to Jeremy Townshend, Liam Toohill, and colleagues at the Department of Health, Economics and Operational Research Division for supplying the preliminary invoiced expenses data, research nurses in Portsmouth and Wirral for completing interviews about the patient flow, and everyone else involved in the chlamydia screening pilot study in Portsmouth and Wirral. Thanks to Philippe Mayaud for comments on the paper.
CONTRIBUTORS EJA contributed to designing and planning the study, created the decision tree model, collected and analysed the costs and related data, conducted interviews with the research nurses, conducted the cost and sensitivity analyses, interpreted results and prepared the manuscript as the lead writer; DSL and ARJ helped develop the decision tree model, extracted and analysed the empirical data from the pilot study and were involved in the data analysis and interpretation; JMP helped develop the decision tree model, was a primary investigator of the pilot study, and helped with interpretation of the data and results; KAF contributed to the study development and helped with interpretation of the analysis; WJE helped conceive and design the study, contributed to the model design, cost estimates and interpretation of data, and all authors read and provided comments on the manuscript and approved the final paper.
REFERENCES
Footnotes
-
↵* Formerly of the Health Protection Agency.