Article Text

Abstract
Objectives: To investigate ethnic differences in rates of gonorrhoea using empirical sexual behaviour data in a simple mathematical model. To explore the impact of different intervention strategies in this simulated population.
Methods: The findings from cross sectional studies of gonorrhoea rates and sexual behaviour in three ethnic groups in south east London were used to determine the parameters for a deterministic, mathematical model of gonorrhoea transmission dynamics, in a population stratified by sex, sexual activity (rate of partner change), and ethnic group (white, black African, and black Caribbean). We compared predicted and observed rates of infection and simulated the effects of targeted and population-wide intervention strategies.
Results: In model simulations the reported sexual behaviours and mixing patterns generated major differences in the rates of gonorrhoea experienced by each subpopulation. The fit of the model to observed data was sensitive to assumptions about the degree of mixing by level of sexual activity, the numbers of sexual partnerships reported by men and women, and the degree to which observed data underestimate female infection rates. Interventions to reduce duration of infection were most effective when targeted at black Caribbeans.
Conclusions: Average measures of sexual behaviour in large populations are inadequate descriptors for the epidemiology of gonorrhoea. The consistency between the model results and empirical data shows that profound differences in gonorrhoea rates between ethnic groups can be explained by modest differences in a limited number of sexual behaviours and mixing patterns. Targeting effective services to particular ethnic groups can have a disproportionate influence on disease reduction in the whole community.
- ethnic inequalities
- gonorrhoea rates
Statistics from Altmetric.com
Reported gonorrhoea rates in the United Kingdom more than doubled between 1994 and 2001.1 Gonorrhoea is endemic in some inner city areas where it is most common among those from black minority ethnic groups,2 with higher prevalence in those of black Caribbean than black African origin.3 Gonorrhoea is also a co-factor for HIV transmission,4 placing people from black ethnic groups at higher risk for HIV infection than their white counterparts. In England and Wales black Caribbeans also have higher rates of HIV than white people,5 although heterosexually acquired HIV is most common in black Africans, who have lower rates of gonorrhoea than black Caribbeans.3
Potential explanations for these disparities include differences in susceptibility, social and economic factors, and sexual behaviour. There is no evidence of ethnic differences in susceptibility to gonococcal infection and cross sectional studies have shown that ethnic disparities persist after controlling statistically for social and economic status,6,7 age at first sex, number of sexual partners, and condom use.8,9 These studies, however, do not take into account the behaviour of an individual’s sexual partners and their position within a sexual network.10 Laumann and Youm suggested that differences in rates of sexually transmitted infections between African-Americans and white people in the United States could be explained by patterns of sexual mixing within and between ethnic groups.10 They found that, among individuals at low risk of a sexually transmitted infection (only one partner in the past year), African-Americans were more likely to form partnerships with individuals with the most risky sexual behaviour than were whites. This sort of sexual mixing can generate differences in risk between ethnic groups in the absence of differences in individual level of behaviour. Whether a similar mechanism is found elsewhere, including in the United Kingdom, is not known.
Mathematical models can help us to understand the epidemiology of sexually transmitted infections.11 The transmission dynamics of an infection can be described mathematically and contact networks in simulated populations can be constructed. Information about pathogen biology and sexual behaviour can be incorporated into the model and the effects of changes in these on the incidence of a sexually transmitted infection can be examined. The consequences of interventions for treatment and prevention can also be explored.11
The information obtained from mathematical models is influenced by the quality of available data.11 One important factor is that, in sexual behaviour surveys, there is a consistent sex difference in the numbers of sexual partners reported, with men reporting more partners than women.12–16 This could be either the result of undersampling of very high activity females, such as sex workers, or under-reporting by women and/or over-reporting by men because of social desirability. A comparison of sexual attitudes and lifestyles in Britain between 1990 and the 2000 found that attitudes had liberalised and that the sex difference in reported behaviour had declined over time, suggesting that reporting bias plays a part.14 In addition, the available pool of women compared to men would be increased if women become sexually active earlier and are more consistently active throughout their sexual life than men. These factors can be incorporated in a model and their effects explored in sensitivity analyses.
The objectives of this study were to define the extent to which sexual mixing patterns by ethnicity and rates of partner change affect gonorrhoea rates, and to assess how preventive interventions might affect the endemic prevalence of disease. We used empirical data from observational studies in south east London, which has a high proportion of black Caribbean and African residents and where gonorrhoea rates are six to seven times higher than the national average,6 to choose parameters for a simple deterministic model of gonorrhoea transmission in young people.
METHODS
Empirical data
Sexual behaviour
We used data from a population based cross sectional questionnaire survey of 16–25 year olds from white, black Caribbean, and black African ethnic groups conducted in an area of the former Lambeth, Southwark and Lewisham Health Authority in south east London with known high rates of gonorrhoea.6,17 Interviews were conducted in participants’ homes using a questionnaire adapted from the National Survey of Sexual Attitudes and Lifestyles 2000.14 We used items relating to the number of years of sexual activity, reported lifetime number of sexual partners, and ethnic group (white, black African, black Caribbean) of the most recent sexual partner. Information about socioeconomic status and educational attainment were also collected but were not used in this analysis.
Gonorrhoea rates
We used previously published data3,6 to calculate the rate of gonorrhoea in the study area for the age group 16–25 years in each ethnic group. Observed gonorrhoea rates include newly acquired (incident) and existing (prevalent) cases diagnosed in genitourinary medicine clinics, the only place where screening for gonorrhoea is routine. In London, few diagnosed gonorrhoea cases are thought to be treated outside this setting. Asymptomatic infections are more common among women than men,18,19 and many female cases are diagnosed as a result of contact tracing. An unknown proportion, however, remains undiagnosed in the community at large. We assumed that female rates were underestimated and that male rates more closely reflected the incidence of gonorrhoea.
Mathematical model
We developed a simple deterministic model of gonorrhoea, based on previous work (see appendix).20,21 The model represents an exclusively heterosexual population aged 16–25 years, divided into classes based on sex, ethnicity (from census data), and rate of sexual partner change (from the behavioural survey17). We assumed a closed population—that is, all sexual contacts were within the specified age group and study area to simplify the development of equations and estimation of parameters. The rate of entry and exit into the population was 0.1 per year.
Formation of sexual partnerships in the model was determined by mixing matrices describing the probabilities of a person from one ethnic group and level of sexual activity mixing with a person of the opposite sex from each ethnic and sexual activity group. We used empirical data from the sexual behaviour survey17 to determine sexual mixing by ethnic group and levels of sexual activity of individuals in each ethnic group. Equations describing the model and definitions for other model parameters are described in more detail in the appendix. Outputs reported from the mathematical model were predicted incidence rates.
Model parameters
These are summarised in the appendix.
Mixing by sexual activity
We used population based data to stratify the population by sexual activity. We calculated the total number of partnerships formed per year across the whole population and stratified the population into quartiles. We then used the proportions in each quartile to calculate the average rate of partner change for each of six subgroups stratified by sex (male and female) and ethnic group (white, black Caribbean, and black African), giving a total of 24 subgroups (2 sexes × 3 ethnic groups × 4 activity levels). We defined a quantitative measure of the pattern of mixing according to sexual activity group (ε2), which varied from proportionate (random) to fully assortative mixing (like with like).
In a closed population the numbers of partnerships formed by men and women must be equal. Men, however, report more partnerships on average than women12–16 so we also defined a parameter (ν) to balance the number of partnerships reported in the population survey by either increasing female rates of partner change to match those reported by men (νm) or women (νf).
Mixing by ethnic group
We constructed mixing matrices for choice of sexual partner by ethnic group, using the ethnic group of the most recent sexual partner reported in the survey. We examined the pattern of mixing further, estimating the degree of differential homophily15 (preference for partners similar to oneself) by calculating the ratio between the reported probability of mixing between ethnic groups and that expected if mixing were proportional to the numbers of partnerships contributed by each group.
Fitting the model
Maximum likelihood methods22 were used to estimate the fit of the model output to the observed data, assuming a binomial distribution (individuals are either infected or not during the year). We examined the effects of varying values for the following parameters: transmission probability (from 0.45 to 0.65 for men to women and women to men),23 duration of infectiousness (1–10 months for men and 2–12 months for women)21,23 and three unknown parameters: (a) the degree of mixing by activity level (ε2, from 0 to 1—that is, assortative to random mixing); (b) how the rate of partner change is balanced between those reported by men and women (ν, from 0 to 1). If the discrepancy in number of reported partners is mainly the result of undersampling of high risk women or women being more subject to social desirability bias then female rates move towards those reported by men; and (c) the degree of underestimation of female infection rates (under-reporting, from 0% to 50%). The best fitting model provided the most likely values of these parameters. We assumed that there were no ethnic differences in the duration or transmission of disease so these parameters did not influence the relative burden of disease in different ethnic groups.
Incorporation of treatment strategies into the model
We used the parameter values from the best fitting model to investigate the impact of different interventions on the incidence and prevalence of gonorrhoea in the model population. We investigated the impact of interventions that reduce the duration of infection, such as improved access to care, recognition of symptoms, and screening.20 We tested these interventions as population-wide and high risk approaches targeted at black Caribbeans. There is little empirical evidence quantifying the effect of an intervention on the duration of infection so we assumed that the intervention would decrease the overall duration of infection by 10% in those treated (equivalent to, for example, a reduction in duration of infection by 40% in 25% of the population).
RESULTS
Overall rates of infection were highest in black Caribbean men and women (2176 and 1899/100 000/year) and lowest in white men and women (119 and 139/100 000/year) (fig 1).
The population based survey included 463 heterosexual participants aged 16–25 years, a response rate of 58%. The distribution of the number of sexual partners was highly skewed (table 1). Heterogeneity was greatest in black Caribbean and black African men. The number of partners reported by black Caribbean and white women was similar but the observed variance was higher for black Caribbeans. Men reported about one and a half to two times as many partners as women.
Estimating model parameters
Table 2 shows the mean rates of partner change in the four sexual activity classes stratified by sex and ethnic group. The highest activity class (group 1) had 7.5 partners per year but comprised only 4.6% of the population. The majority of the population were in the lowest activity class (group 4) with a partner change rate of 0.5 per year. There were differences in the distribution of partnerships reported by different ethnic groups (table 3). Homophily was greatest in black African men and women (table 4).
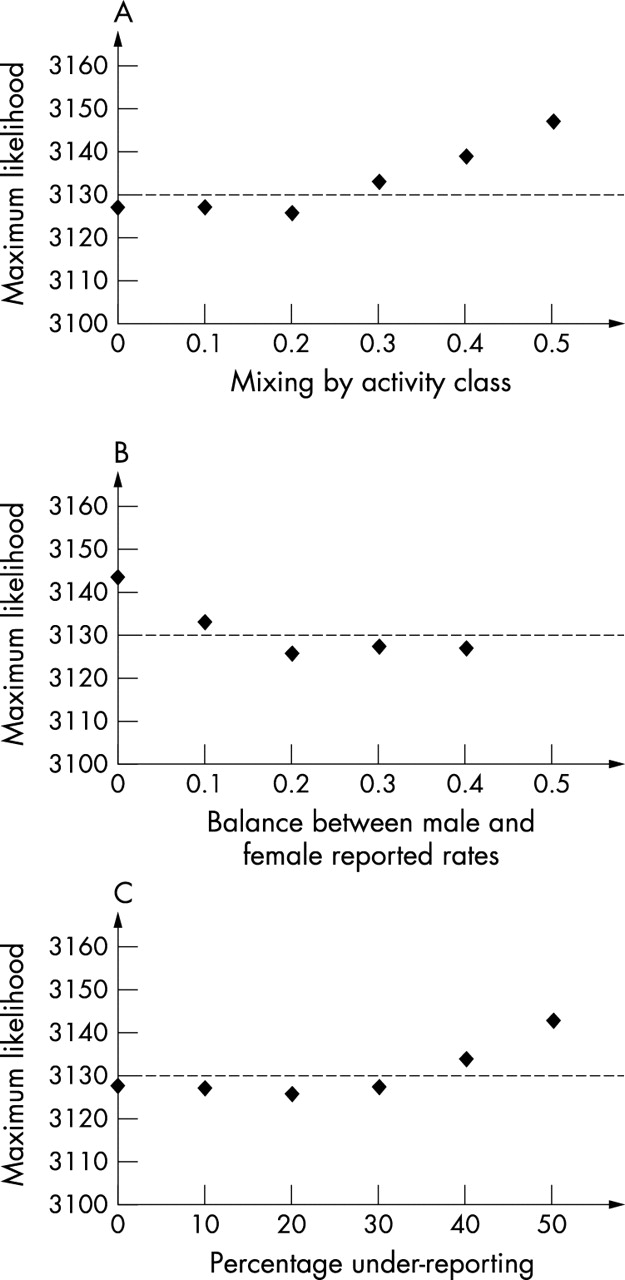
The model outputs gave prevalence values close to the limit of persistence, such that small changes in behaviour would reduce the reproductive number to below one and the epidemic would be extinguished. The model outputs were most sensitive to changes in sexual mixing patterns between different activity groups and the estimated balance between reported rates of sexual partner change by men and women. The best overall fit was obtained with the following values: transmission probability from men to women, 0.6; from women to men, 0.4; duration of infectiousness in men and women, 2 months; assortative sexual mixing (ε2 = 0.2); rate of partner change of women similar to that of men; underestimation of female incidence rates, 20% (fig 2).
Predicted compared with observed rates of infection
Figure 1 shows the simulation output using the best fitting parameter combination, compared with observed rates of infection. The pattern of predicted and observed rates was similar, with higher rates in black Caribbeans and lower rates in white people and black Africans. Predicted rates were higher than observed for white and black African men and women.
Impact of intervention
Figure 3 shows the expected number of new gonorrhoea infections in 16–25 year olds in the absence of intervention and after 1 year of an intervention that reached 25% of the target group and reduced the duration of infection by 40%. An intervention involving the whole population would reduce the incidence by 45%. Involving only black Caribbeans (about 20% of the total population) would reduce incidence by 35%. The number of people needed to take part in the intervention to prevent one incident case ranged from 20 to 22 for targeted interventions compared with 88 for the whole population.
DISCUSSION
By applying empirical data to a mathematical model of the dynamics of gonorrhoea transmission we were able to illustrate the role of mixing according to sexual activity level and ethnic group in contributing to ethnic disparities in rates of infection. We could account for most of the ethnic difference in rates of gonorrhoea in this south London population with simple behavioural parameters. We also showed that focused interventions could be effective in reducing the incidence of infection in the wider community.
Average behaviours did not explain the distribution of gonorrhoea in this population because of heterogeneity in the distribution. The high variance in the distribution of sexual partners in black Caribbeans meant that most had low numbers of partners but a few had higher numbers, which could be the result of more accurate reporting behaviour, cultural factors, or the inclusion of sex workers. The latter is unlikely since the maximum number of reported partners per year is too low. Owing to the dynamic interactions of disease transmission within sexual networks, the high burden of gonorrhoea among black Caribbean women could be explained by high risk behaviour in a few individuals, combined with a strong preference for partners from the same ethnic group, even when rates of partner change are similar to that of the population in general.
Methodological issues
The strength of this study is that we used empirical data, where possible, in the mathematical model. Data on infection rates and sexual behaviour came from studies conducted in the same population. The mathematical model is applicable to public health because it focused on describing the impact of mixing patterns on the distribution of disease as a mechanism to explain the observed disparity in the burden of disease in different ethnic groups and examined the impact of preventative interventions.
The model approximated the interactions of the whole population but for simplicity a closed population was assumed. This allowed us to illustrate the dynamic effects of mixing and behaviour, which is not possible with standard statistical techniques. However, the reality is more complex since partnerships can be formed outside the model population—for example, between young women and older men or with partners outside the study area. Ignoring age mixing would overestimate of the prevalence of gonorrhoea in young men compared to young women. Our sexual behaviour survey showed that only 15% of women had older male partners so the effect of this on predicted rates would be small. There were no data from which to estimate the rate of partnership formation with individuals outside the study area but research from Baltimore has shown that the average linear distance between non-cohabiting sexual partners was only 100 metres.24 We did not include a parameter for concurrent sexual partnerships in the model, although this has been shown to be important in theoretical studies.25 The survey data suggested that concurrency was more common in the black Caribbean population (data not shown), which would further exacerbate ethnic disparities. Future modelling work and intervention programmes should take account of these factors and of recent increases in gonorrhoea rates.2
There were also limitations in some of the empirical data. Where group sizes were small parameter estimates were unstable. Furthermore, we had to estimate the most likely values for unmeasured factors such as the way in which individuals mix according to sexual activity levels and the underestimation of female infection rates. The observed gonorrhoea rates, which were based on attendance at sexually transmitted diseases clinics, excluded cases diagnosed elsewhere and undiagnosed asymptomatic cases.26,27 A population based study in Baltimore found that nearly 8% of 16–35 year olds had untreated chlamydia or gonorrhoea and that the survey prevalence of infection was higher than rates from surveillance data, which included only diagnosed and reported infections.28 In our study population, if proportionately more people from white and black African than Caribbean ethnic groups were treated for gonorrhoea outside genitourinary clinics and these cases were not reported, this could explain why predicted rates of infection in white people and black Africans were higher than those observed.
Ethnic differences in gonorrhoea rates
The overall prevalence of disease is determined by the reproductive number of the organism, which in turn depends upon mixing patterns and sexual behaviours of population subgroups. Even when differences in behaviour or other risk factors are small8 the prevalence in different ethnic groups can vary because of unmeasured differences, different contact rates with other populations, or chance. Small differences in access to care or time to seeking treatment can be magnified by the contact structure of the population leading to wide variations in disease burden.
The pattern of mixing between individuals in different activity classes also varies according to ethnicity.9,10 In the general population in the United States, African-Americans with low risk sexual behaviour have been shown to be more likely than white people to have partners with high risk behaviour.10 Among individuals with gonorrhoea studied in Seattle, the direct links between high and low prevalence groups were most common between African-American men and low prevalence women.9 Like Laumann and Youm,10 we used sexual behaviour data from the general population. In mixing matrices obtained from our model we found some evidence to support this hypothesis, with the probability of women in the lowest activity group having a male partner from the highest activity group being slightly higher for black Caribbean than white women. The best fit to the observed data occurred when sexual mixing between activity classes was assortative, but was sensitive to assumptions about the average rate of partner change. Modelling studies in sexually transmitted diseases clinic attenders21,29 have found near random or weakly assortative mixing, which might reflect greater homogeneity of sexual behaviour than in the population at large.
Interventions to prevent gonorrhoea
The prevalence of gonorrhoea in the population in general is low. The best fit of the model in our study predicted a population prevalence of about 0.1%, which is close to the limit of persistence (reproductive number close to one). Only a modest reduction in duration of infection or transmission probability would lead to eventual extinction of the disease. The hypothetical intervention, which reduced the average duration of infection by 10%, from 2–1.8 months, resulted in a large reduction in the incidence of gonorrhoea. In reality, the persistence of gonorrhoea seems more resistant than expected to interventions. This might be the result of other factors, such as repeated reintroduction of infection from external reservoirs via bridge groups or untreated individuals, differences in the pattern of mixing by activity between ethnic groups,10 concurrency, or stochastic effects within the network.21,30
Targeted interventions to prevent infections such as gonorrhoea, which are concentrated in core groups are more effective than population approaches.31 In our model an intervention involving black Caribbeans only, who comprise about 20% of the population, was more efficient than a whole population intervention. Such interventions must, however, be implemented in a non-discriminatory way.5,32 Within the same study population we have used geographical targeting, collaborating with local youth workers to deliver an intervention combining health promotion with screening using urine tested with nucleic acid amplification assays in settings with large populations of young people from black minority ethnic groups.33 This approach has also been used in Denver, Colorado.34
CONCLUSIONS
Heterogeneity in rates of sexual partner change and sexual mixing patterns appears to be a crucial factor in accounting for observed ethnic differences in gonorrhoea rates in a high prevalence area in London. Our model illustrates how relatively small differences in behaviour, measured by the variance in activity, together with ethnic and sex differences in the strength of differential homophily, can magnify the disease burden in minority groups, owing to positive feedback in the infection transmission system. Targeted interventions to reduce the duration of infection would be effective in reducing gonorrhoea rates in this population.
APPENDIX
We used a deterministic, compartmental model of a bacterial sexually transmitted infection, in a population stratified by sex, activity class (4), and ethnicity (3).
The ordinary differential equations that define the model are:


Subscripts k, l, and s refer to sex, activity class, and ethnicity, respectively. In the case of sex, k = 0 for men, k = 1 for women while k′ refers to the opposite sex to k and for activity l defines the class (from 1 to 4), according to average rate of partner change per year, cklr. Ethnicity r defines the group (1 to 3) that an individual falls into.
Xklr, population of susceptibles of sex k, activity class l, and ethnicity s
Yklr, population of hosts infected of sex k, activity class l, and ethnicity s.
The force of infection, λkls the group specific incidence per susceptible can be calculated from the transmission probability, βk; contact rate, ckls; the proportion of infected individuals and the mixing pattern ρklmst as follows:

The letters m and t define the activity class and ethnicity, respectively, of an individual of the opposite sex (k′) with whom a partnership is formed.
The mixing matrix, Pklmst, has to take account of both ethnicity and activity. We estimated a mixing matrix Mkls, from the behavioural survey data, which defines the probability that a person of sex k, ethnicity s will choose a partner of ethnicity t. This was then input directly to calculate the overall mixing matrix:

where δ is the identity matrix, such that δij = 1 when i = j and δij = 0 when i≠j.
Balancing the numbers of sexual partnerships in the model population
There are various methods for balancing partnerships, as described elsewhere.35,36 In this case there is no disease induced mortality and the population falls within one age group. Parameters are explicitly defined for both sexes, which enables calculation of a mixing matrix for each. The total numbers of partnerships formed by one sex must equal those formed by the other in the model—that is

However, in reality the reported values do not equate and in fact women in general report fewer partnerships than men.12–16 We therefore calculate the discrepancy between empirical data input and that required to balance the numbers of partnerships within the closed population.
The term for this discrepancy, Blmst is defined as follows:

(If the numbers of partnerships balanced exactly, each element of B would equal unity.)
We define a parameter, ν, which determines how each sex varies its activity levels to balance the total number of partnerships. If ν = 0 sex k doesn’t change and k′ is forced to change activity levels to meet the demand from k and vice versa if ν = 1, for ν = 0.5, both sexes adjust equally to a midpoint. Then the adjusted contact rates for each sex can be calculated, such that the adjusted contact rate, c*klmst is as follows:

and for the opposite sex, k′.

These adjusted values are then used in the model to define the contact rates for each sex used to determine the force of infection.
Parameter definitions
Number of sexual partners reported by 16–25 year olds from three ethnic groups in south east London
Average yearly rates of partner change* of 16–25 year olds from three ethnic groups in south east London
Mixing matrix
Differential homophily shown by both sexes and different ethnic groups
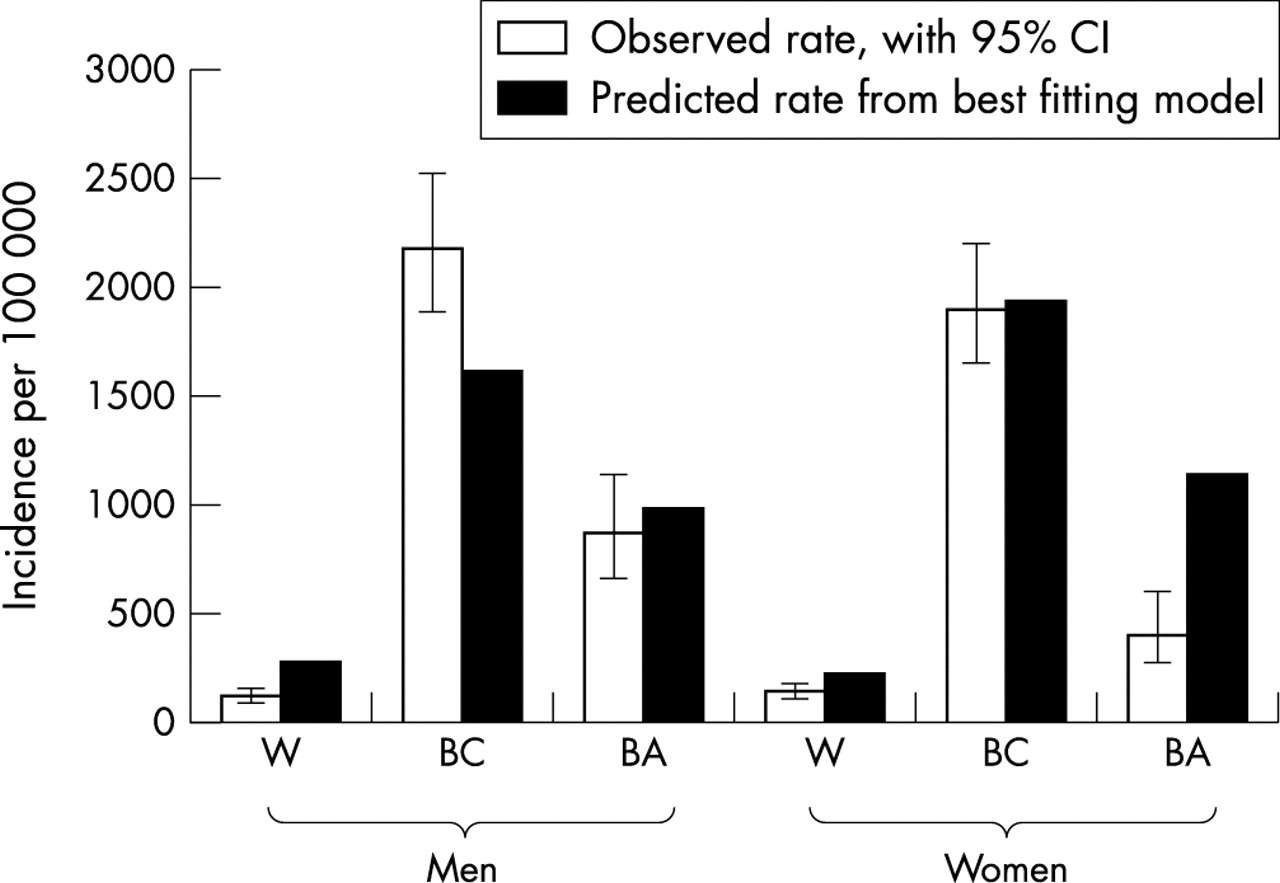
Comparison between observed gonorrhoea rates (per 100 000) and outputs from a deterministic mathematical model incorporating partner choice by ethnic group and level of sexual activity. Model output with the best fit to the observed data, using maximum likelihood methods. Estimated parameter values: transmission probability higher from male to female (0.6) than from female to male (0.4), duration of infection 2 months in males and females, 20% under-reporting in females, close to assortative mixing (ε2 = 0.2) and partnerships balanced towards those reported by men (v = 0.2). W, white; BC, black Caribbean; BA, black African.

Maximum likelihood profiles for parameters estimated by the model. (A) Mixing by level of sexual activity: varies from ε2 = 0, assortative to ε2 = 1, random. (B) Balance between number of sexual partners per year reported by men and women: varies from ν = 0, male rate remains unchanged to v = 1, male rate changes to balance that of women. (C) Degree of under-reporting of female cases: varies from 0%, all female cases reported to 50%, half of female cases not reported. Broken line is the maximum likelihood value with the best fit for the model. Points below the line are statistically equivalent fits to the data, points above the line are worse, compared with the best fit value. Where no data point is shown, the maximum likelihood is too high to be shown.

Impact of intervention after 1 year in different target groups compared with whole population. Assumes that intervention reaches 25% of the population aged 16–25 years in the target group and reduces duration of infection by 40%. This is equivalent to a reduction in the duration of infection of 10%.
Acknowledgments
The data were collected by the Department of Social Medicine, University of Bristol and Department of Public Health Sciences, King’s College London, who received funding from the Department of Health (project number 1216744). The views expressed in the publication are those of the authors and not necessarily those of the Department of Health.
NL is supported by a NHS Career Scientist Award; GG and KT thank the Medical Research Council for grant support; AG and GG thank the Royal Society for grant support.