Article Text

Abstract
Background: The India AIDS Initiative (Avahan) prevention programme funded by the Bill and Melinda Gates Foundation aims to reduce HIV prevalence in high risk groups such as female and male sex workers and their clients, to limit HIV transmission in the general population.
Objectives: To assess the potential effectiveness of the Avahan intervention at the level of coverage targeted, in different epidemiological settings in India.
Methods: A deterministic compartmental model of the transmission dynamics of HIV and two sexually transmitted infections, and sensitivity analysis techniques, were used, in combination with available behavioural and epidemiological data from Mysore and Bagalkot districts in the Indian state of Karnataka, to evaluate the syndromic sexually transmitted infection (STI) management (STI treatment), periodic presumptive treatment of STI (PPT), and condom components of the Avahan intervention targeted to female sex workers (FSW).
Results: If all components of the intervention reach target coverage (that is, PPT, STI treatment and condom use), the intervention is expected to prevent 22–35% of all new HIV infections in FSW and in the total population over 5 years in a low transmission setting like Mysore, and to be half as effective in high transmission settings such as Bagalkot. The results were sensitive to small variations in intervention coverage. The condom component alone is expected to prevent around 20% of all new HIV infections over 5 years in Mysore and around 6% for the STI component alone; compared with 7%–14% for the PPT component alone. Multivariate sensitivity analyses suggested that interventions may be more effective in settings with low FSW HIV prevalence and small FSW populations, whereas HIV prevalence was most influenced by sexual behaviour and condom use parameters for FSW.
Conclusion: The Avahan intervention is expected to be effective. However, to be able to demonstrate effectiveness empirically in the different settings, it is important to achieve target coverage or higher, which in the case of PPT could take a number of years to achieve. These preliminary model predictions need to be validated with more detailed mathematical models, as better data on sexual behaviour, condom use, STI and HIV trends over time, and intervention coverage data accumulate over the course of the programme.
- ART, antiretroviral therapy
- CSW, commercial sex workers
- CT, Chlamydia trachomatis
- FSW, female sex workers
- GC, Neisseria gonorrhoeae
- HSV, herpes simplex virus
- IBBA, Integrated Biological and Behavioural Assessment
- ICHAP, India-Canada Collaborative HIV/AIDS Project
- MSM, men who have sex with men
- PF, prevented fraction
- PPT, periodic presumptive treatment
- STI, sexually transmitted infections
- HIV
- intervention studies
- India
- prostitution
- mathematical model
- Avahan
Statistics from Altmetric.com
- ART, antiretroviral therapy
- CSW, commercial sex workers
- CT, Chlamydia trachomatis
- FSW, female sex workers
- GC, Neisseria gonorrhoeae
- HSV, herpes simplex virus
- IBBA, Integrated Biological and Behavioural Assessment
- ICHAP, India-Canada Collaborative HIV/AIDS Project
- MSM, men who have sex with men
- PF, prevented fraction
- PPT, periodic presumptive treatment
- STI, sexually transmitted infections
The first AIDS cases were reported in India in the mid-1980s.1 Since then, HIV infection appears to have spread rapidly in several regions.2 Both female and male commercial sex workers (CSW) and their clients are believed to be important in facilitating this spread,3 although the relative importance of female versus male CSW may vary from region to region.4 The India AIDS Initiative (Avahan) HIV intervention prevention programme funded by the Bill and Melinda Gates Foundation is a programme addressing this challenge in selected districts of six Indian states with a combined population of 300 million. In at least 62 districts (population 140 million) of the four southern states in India, the intervention programme focuses on CSW, men who have sex with men (MSM), and clients of CSW. Avahan aims to reduce HIV prevalence in high risk groups in order to limit HIV transmission in the general population.5 For CSW and MSM, the different components of the Avahan intervention centre on improving quality and services for sexually transmitted infections (STIs), unlimited free distribution of condoms and promotion of their use, encouraging behaviour change, self help, and reducing vulnerability.
Monitoring and evaluation of the impact of the intervention are also occurring throughout its implementation.5 In addition to ongoing data collection, mathematical modelling will be used to estimate the potential effectiveness of the programme and to guide understanding of how the observed epidemiology in the settings where the intervention is implemented may influence its effectiveness. The full mathematical model for this assessment is currently under development. Despite the limited availability of data, an initial rapid assessment of the potential impact of the interventions targeting female sex workers (FSWs) was carried out. The interventions in the field focus on promoting increased coverage and consistency of correct condom use; treating symptomatic vaginal infections (trichomoniasis, candidiasis, and bacterial vaginosis); treating symptomatic cervical infections (gonorrhoea and chlamydial infection); treating and preventing asymptomatic cervical infections through periodic presumptive treatment (PPT) and treatment based on the results of physical examinations and risk assessment; treating genital ulcers for chancroid and syphilis; treating symptomatic herpetic genital ulcers; and serological screening and treatment for syphilis.
This modelling study aimed to assess the possible range of effectiveness expected in different epidemiological settings assuming the different intervention components were delivered at the target coverage levels envisaged by the Avahan programme. Implications of the results for the evaluation of the intervention are also discussed.
METHODS
Model description and baseline assumption
An adapted version of a deterministic compartmental model (POP 1.07) was used to simulate the transmission dynamics of HIV and two sexually transmitted infections (STI-1, STI-2) (detailed description in appendix on STI website, www.stijournal.com/supplemental). The model comprised a system of ordinary differential equations whose state variables represented the proportions of the population in key stages of the natural history of HIV and STI infections. In the model, infection with HIV was followed by a short and high infectivity stage then by a longer stage of lower infectivity, until the onset of AIDS when sexual activity was assumed to cease. Each STI was assumed to facilitate HIV transmission by a specific cofactor effect, which combined additively in the presence of both STIs. STI-1 was assumed to correspond to a curable infection of short duration, characterised as Neisseria gonorrhoeae or Chlamydia trachomatis (GC/CT), while STI-2 corresponded to a non-curable infection of lifelong duration, to characterise herpes simplex virus type 2 (HSV-2) infection.
The two sex model population was stratified into FSWs, their male clients, and the general population, with the latter being further subdivided into subgroups representing different specified levels of sexual behaviour (that is, inactive, those with long term partners only, and those with both long term and casual partners) (appendix on STI website). Numbers of FSW-client relationships and of casual partnerships between FSW or clients with a partner who has both long term and casual relationships, were determined from data (table 1D, appendix and table on STI website). In absence of data, the mixing of individuals with long term relationships belonging to different sexual activity subgroups was assumed to be proportionate—that is, partners from each subgroup being chosen in proportion to the total number of partnerships in the population supplied by each of the different sexual activity subgroups (appendix on STI website). The modelled probability of infection with HIV, STI-1, or STI-2 depended on the number of sexual partners and sex acts, the proportion of partners infected with the given infection, the stage of infection, the cofactor effect, and the level of condom use (table 1A, B, D, F, appendix on STI website).
Table A Model parameters (see also table 1)
Epidemiological data and baseline parameter values for modelled Bagalkot and Mysore scenarios and range for sensitivity analysis
Pre-intervention and individuals not reached by the modelled intervention
In each sexual activity subgroup, baseline level and consistency of condom use (that is, fraction of sex acts protected) were specified (table 1F). The mean duration of infection for STI-1 only was reduced by treatment, and was followed by reversion to the susceptible class (parameters in table 1A). A baseline fraction of FSW with symptoms is assumed to attend a clinic and get treated (table 1E).
Modelled intervention
The modelled FSW intervention included increased condom use between FSWs and clients, improved syndromic management of STIs, and PPT of GC/CT infections. The condom and STI interventions were assumed to reach a fraction (freached) of the FSW population. Condom use (CondomMain, fcasual-always, fclient-always, Dall) was assumed to increase among all FSWs reached by the condom intervention, whereas only a proportion (fclinic) of FSWs reached by the STI intervention were assumed to attend an STI clinic when they had STI symptoms. Once at an STI clinic, a fraction of FSWs were correctly diagnosed using a syndromic algorithm with a specific test sensitivity (ftreated-clinic) and given treatment of assumed efficacy (Efftreat). In addition, a proportion of all FSWs (fPPT) who attended the STI clinic were given PPT with assumed efficacy for CT/GC (EffPPT-treat), and were told to return with a specific frequency (FreqPPT) for additional PPT. For this reason, the number of FSWs receiving PPT increased as more women attended the STI clinic. Each component of the intervention could be started at the specified time.
The overall condom and STI coverage achieved by the intervention, which depends on the different intervention parameters, are defined in table 1H. This includes fractions of: FSW reached by SW clinics (freached), symptomatic FSW attending the STI clinic that are treated (ftreated-clinic, fclinic, Efftreat); FSW reached receiving PPT(fPPT); sex acts protected in long term partnerships among FSW reached (Condommain); FSW reached using condoms “always” with casual partners (fcasual-always), FSW reached using condoms “always” with clients (fclient-always), as well as the efficacy of PPT (EffPPT-treat) and the average duration of carryover effect of PPT(Dppt).
The model parameters and the Avahan coverage targets are summarised in set 4 (table 1G, H). The model assumptions and modelled interventions are explained in appendix on STI website.
Model parameterisation
Available epidemiological data from the Indian state of Karnataka and other relevant sources were used to estimate demographic, biological, and behavioural model parameters (table 1). The analysis focused on two epidemiological scenarios with differing HIV prevalence in the FSW and general populations, using data from the Southern and Northern Karnataka Districts of Mysore and Bagalkot, respectively. The model was parameterised using data collected by ICHAP (India-Canada Collaborative HIV/AIDS Project) in 2004 in Bagalkot and during the Avahan IBBA (Integrated Biological and Behavioural Assessment) in Mysore and other relevant published and unpublished data (2002–5).11,12,39,47 If site specific data were not available, data from nearby districts,11,12 or aggregate data from Karnataka2 or from neighbouring states were used as necessary. The parameter values were subsequently fine tuned, but constrained within the initial parameter ranges defined from available data, to fit available observed HIV and HSV-2 prevalence data for Mysore and Bagalkot in 2004–5. As prevalence data for GC and CT (that is, STI-1) were inadequate in the Bagalkot district (Mysore IBBA FSW survey indicated GC/CT prevalence of 14%), site specific HSV-2 prevalence data were also used to validate modelled sexual behaviour parameters with the expectation that this would also allow better prediction of STI-1 prevalence. Thus the “Mysore” and “Bagalkot” scenarios are sketches useful to give an assessment of whether the intervention is likely to be effective and to what extent, in contrasting settings.
Sensitivity analyses
A univariate sensitivity analysis was undertaken using the baseline Mysore parameter set, adjusting in turn the value of each parameter to that in the Bagalkot baseline parameter set, thereby allowing identification of which individual parameters were key to explaining the difference in HIV prevalence between the two modelled sites. Additionally, a specific sensitivity analysis of the fraction of sex acts assumed to be protected (that is, quantitative definition of consistency of condom use) in the categories: “sometimes” and “always” was performed. A series of multivariate sensitivity analyses, using Latin Hypercube sampling48–50 (see appendix on STI website) of the behavioural, biological, and intervention parameter space, were undertaken to assess the variability of the effectiveness of the different intervention components according to epidemiological settings and level of intervention coverage. Parameter values are listed in table 1G and I.
RESULTS
HIV transmission
Figure 1A, B compares the predicted HIV prevalence over time for female sex workers and the total population in Mysore and Bagalkot with available data. The difference in predicted HIV prevalence between the two scenarios is much larger for the total population (fig 1B) (2005: Mysore ∼<1%, Bagalkot ∼2.5%) than for FSW (fig 1A) (2005: Mysore ∼<25%, Bagalkot ∼>30%). Univariate sensitivity analysis suggests that the difference in FSW and general population HIV prevalence between the two modelled scenarios is because Bagalkot mainly has (i) lower condom use rates between FSW and clients, (ii) lower monthly numbers of clients/FSW, and (iii) a much larger fraction of the population having no sexual partners and, to a lesser extent, to them having (iv) higher monthly numbers of casual partners, (v) higher numbers of acts with these casual partners, and (vi) lower condom use rates with casual partners (details in supplementary fig A on STI website, www.stijournal.com/supplemental). These changes increased predicted Mysore HIV prevalence towards modelled Bagalkot HIV prevalence except for (ii) and (iii), which necessitated a much longer timescale following the introduction of HIV infection to reach levels shown by data.

Predicted HIV prevalence over time following HIV introduction in 1978 among: (A) FSW population and (B) total population, male and females combined, for Mysore and Bagalkot scenarios (parameters as in table 1A–F). The model was fitted to available HIV prevalence data (vertical lines with symbols indicate mean, lower, and upper 95% confidence limits). (C) Influence of different consistency of condom use definition for FSW clients acts on FSW HIV prevalence immediately before the interventions under the Mysore scenario. Definition of consistency of condom use for categories “always” and “sometimes” are varied between 80–100% and 10–50% respectively. Baseline definitions used in the Mysore (always = 80%, sometimes = 40%); and Bagalkot scenarios (always = 90%, sometimes = 30%) are indicated on the graph. Similar results were obtained for the total population (not shown).
Figure 1C shows that the difference between consistency of condom use assumed in the Mysore and Bagalkot scenarios has a small impact on HIV prevalence in the Mysore scenario and therefore will not influence the impact of the intervention between the two scenarios. However, variation in FSW HIV prevalence over the full range explored for the “sometimes” category (one order of magnitude variation) is approximately twice as large as the variations over the smaller range explored for the category “always,” which highlights the importance of measuring the extent of inconsistency in condom use.
Effectiveness of the interventions
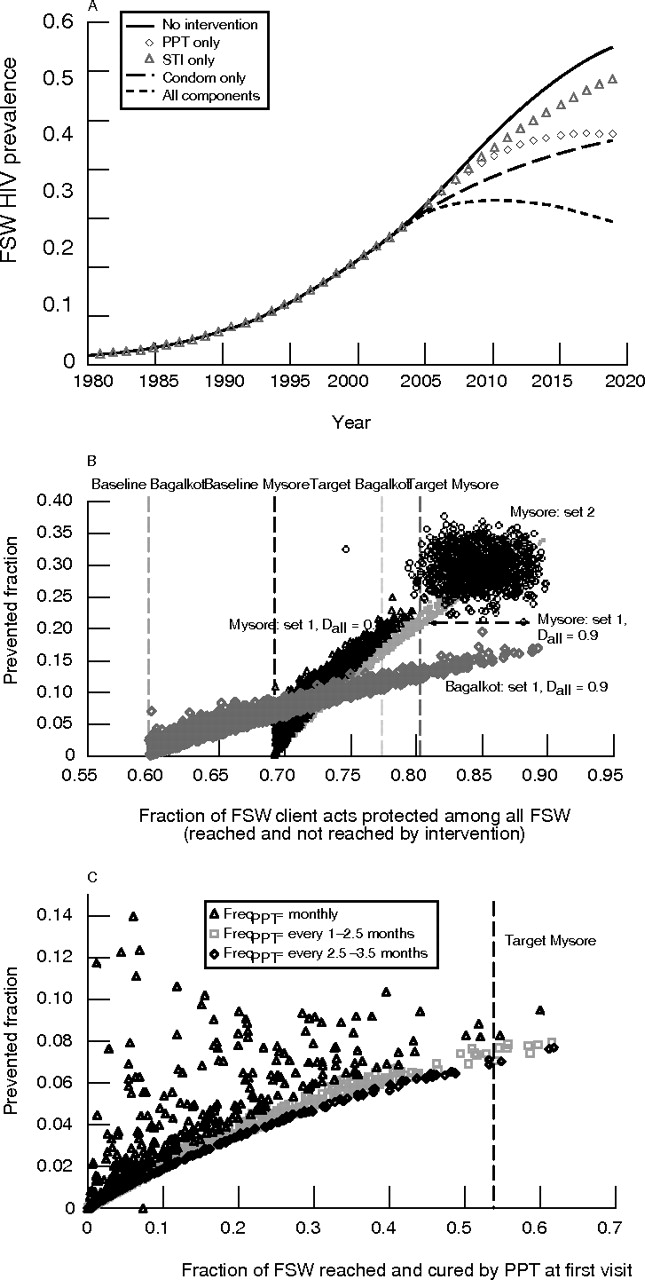
Results of the predicted impact of the different components of the modelled Avahan intervention introduced in 2005 show that the condom component has a greater impact on HIV prevalence over time (fig 2A), and on the fraction of new HIV infections prevented (prevented fraction, PF) in both short and long terms for FSW. In contrast, the STI treatment component only has a relatively modest impact on HIV prevalence whereas the impact of PPT, initially as modest as the STI component, improves over time because coverage increases gradually over time as more women attend the STI clinics and so start receiving PPT. Of note, despite the successful interventions, over the medium term HIV prevalence continues to rise in the intervention scenario, albeit at a slower rate than in the control (baseline). The component treating symptomatic STI-1 infections achieves a relative reduction in FSW prevalence of 5% and 10% by 2010 and 2020 respectively, compared with no intervention, whereas PPT achieves 7% and 27% reduction compared with no intervention. The PF over 5 years and 10 years were, respectively, 12% and 15% for all components, 11% and 12% for the condom component, 0.6% and 3.6% for PPT. This contrasts with the PF suggesting that 55% of HIV infections from 2005 and 2015 will be caused by STI-1. Thus, STI treatment has potentially an important role in HIV prevention, especially over the long term. Similar impacts of the intervention were obtained for the general population as for the FSW (not shown) because of low transmission rates between low risk groups at this stage of the epidemic.

(A) Predicted impact of the Avahan intervention introduced in 2005 on FSW HIV prevalence in Mysore. The parameters used are as described in set 4 (table 1G, H) except DAll = 80%, resulting in overall condom coverage of 72% (that is, fraction of all FSW client contacts protected), compared to 69% at baseline (table 1E–F) and 81% with target coverage (set 4 with DAll = 90%). (B) and (C). Multivariate sensitivity analyses comparing the fraction of new HIV infection prevented over 5 years as a function of overall condom and STI coverage as defined in table 1H for the interventions B) combining all components in Mysore (set1 with DAll = 0.8 (open triangle) and DAll = 0.9 (square dot), set 2 (open circle) and Bagalkot (open diamond) scenarios or (C) PPT component only in the Mysore scenario. Vertical lines indicate baseline (that is, baseline level of condom use) (defined in table E–F) and target (that is, post-intervention level of condom use) coverage (defined in set 4). In (B) four sets of 1000 simulations for each parameter set and in (C) results of 2000 simulations are presented. Note that in set 2 the STI and condom intervention components are at or above target values (table 1G).
Sensitivity analysis
Figure 2B, C compares the effectiveness of interventions that include all the components (fig 2B) and the PPT component only (fig 2C), as a function of overall condom (fig 2B) and STI coverage (fig 2C) as defined in table 1H. For a fixed coverage, the interventions tend to be more effective in Mysore than in Bagalkot (fig 2B), and the predicted effectiveness of the intervention depends on the specific combinations of intervention parameters that make up the overall coverage. If the target condom coverage set by Avahan is achieved (vertical lines on the graphs), the intervention will prevent 20–25% of new infections in Mysore compared to 10–12% in Bagalkot, depending on the fraction of FSW reached by STI and PPT intervention. However, if condom, STI, and PPT targets are reached or exceeded (set 2) this could increase to 22–35% in Mysore. In the short term, even if condom coverage is high, many residual infections occur as a result of imperfect coverage. The condom component alone is expected to prevent around 20% of all new infections over 5 years in Mysore and around 6% for the STI component alone (not shown). PPT alone is expected to prevent 7%–14% new HIV infections over 5 years and about half of these proportions in Bagalkot (not shown). This can vary greatly depending on the frequency of PPT offered (fig 2C). In comparison, the maximum fraction of HIV infections that would be prevented over 10 years by eradicating STI-1 (that is, attributable fraction) is smaller in Bagalkot (∼38%) than in Mysore (∼55%). Although in the short term little can be expected from the PPT intervention, a prevented fraction of between 10% and 20% still corresponds to several hundred infections prevented among FSW and several thousand in the total population respectively in Bagalkot and Mysore.
Figure 3 compares the long term effectiveness of each intervention component in populations with 1% of women in the general population being FSW and a 20% FSW HIV prevalence using various intervention (table 1G) and epidemiological parameter values (table 1H). The ranking of intervention components is consistent with previous univariate results (fig 2A). For example, for the range of intervention parameters explored, the “all components” intervention is expected to prevent on average (25th, 75th percentiles) 9%–22% of all new HIV infections over 15 years, compared to <5%–12% for the condom component only and less than 7–8% for the other components. Further sensitivity analysis suggests that the intervention tends to be more effective in low than high prevalence settings and slightly more effective in populations with smaller compared to larger FSW populations, independently of HIV prevalence (supplementary fig B, C on STI website, www.stijournal.com/supplemental). Note that the impact of the FSW intervention in the general population and in clients (not shown) depends largely but not exclusively on the success in the FSW population. It also depends on increases in condom use in non-FSW-client relationships following the intervention (table 1G).

Multivariate sensitivity analysis that compares the long term effectiveness of each intervention component under various intervention and epidemiological parameter values (epidemiological parameters varied over the ranges specified in table 1H; note that in the “all interventions” scenario only, condom use parameters for those in casual partnerships were also varied). Results show box and whisker plots (1st, 25th, 75th, and 99th percentiles) of the fraction of new HIV infection prevented over 15 years. The different intervention components are evaluated in populations with 1% FSW and FSW HIV prevalence of 20% (all components (All interv), condom component (SW Cdm), PPT, or STI component: set 3, table 1H and I). The variability in estimates for “all interventions” is larger because it has more intervention parameters than single components. There are 80 simulations for each single component and 300 simulations for the combined interventions. More detailed analysis by size of FSW population and FSW prevalence are presented in supplementary figure B, C on STI website (www.stijournal.com/supplemental).
DISCUSSION
Our preliminary modelling work was useful to assess the potential impact of the Avahan intervention targeted to FSW, and the degree to which, even within a particular region, its impact may differ.
Our analysis explored the relative effectiveness of different components of the Avahan intervention at current Avahan target levels as implemented in a low (Mysore) and high (Bagalkot) epidemic scenario for India, yet levels of both epidemics are relatively low compared to sub-Saharan Africa. The results suggest the same intervention is likely to be half as effective (in terms of preventing new HIV infections) in the Bagalkot setting as in Mysore. However, these predictions are subject to considerable variability as a result of uncertainty in model parameters as a result of lack of reliable data.
Results from uncertainty and sensitivity analyses suggest that, if all components of the intervention (that is, for PPT, STI treatment, and condom use) reach target coverage, the intervention could prevent between 22–35% of all new HIV infections in a setting like Mysore over 5 years (fig 2B), and about half that in a setting such as Bagalkot. However, small variation in coverage (for example, increase from baseline to 75% versus baseline to 80%) can lead to relatively large differences in effectiveness (15% versus ∼25%). The degree to which the model predicts that a substantial population level impact is achievable through targeted intervention activities supports the importance of the Avahan intervention and its objectives.
In all simulations, the intervention that combined all components was more effective than any of the individual components—the condom intervention among FSW clients, PPT, or syndromic STI treatment of FSWs. However, effectiveness of PPT increased over time because the coverage of PPT increased as more women attended the STI clinic. The projected impact of PPT was particularly sensitive to the frequency of treatment, with higher frequencies (every month) being needed to reach maximum effectiveness (fig 2C). These results highlight the observation that the coverage and frequency of PPT interventions are key in attaining their full potential impact on HIV transmission. Because HSV-2 therapy was not included in the projections the impact of STI intervention may have been underestimated. On the other hand, it may overestimate the impact of PPT if the assumed increase in PPT coverage with increased clinic attendance may not occur or if FSW do not persist with PPT.
Our results have broader implications for targeted FSW interventions in other settings with similar epidemiological conditions. While increasing condom use was the most effective component, the treatment of STIs also has an important role in HIV prevention if high enough coverage for a prolonged time period can be achieved. However, because many infections may be missed by syndromic management because of its low sensitivity, other strategies such as PPT or rapid STI tests may be important to achieve greater impact.
The estimated effectiveness of the Avahan intervention in the specific settings modelled depends on the coverage of the FSW population attained by the intervention, but also on the existing epidemiological context. The different intervention components were more likely to have a greater impact in settings with lower HIV prevalence and with smaller FSW populations (for example, Mysore versus Bagalkot). This has important implications for the design and the evaluation of interventions. The epidemiological parameters that had the greatest influence on projected prevalence were those relating to sexual behaviour, particularly numbers of clients per FSW, and the pattern and consistency of condom use by FSWs. Further simulations suggest that in the context simulated, the mixing patterns of the long term relationships have little impact on the number of HIV infections averted (that is, 19.9% of infections are averted for proportionate versus 19.0% for assortative). The difference in the definition of consistency of condom use (for categories “always” and “sometimes”) between the two modelled scenarios did not have great impact upon these projected prevalences and therefore could not explain difference in intervention effectiveness between settings (fig 1C). However, in general the definition of condom use consistency and the size of the FSW population (not shown) has a big influence on the predicted course of the HIV epidemic. This emphasises the need to accurately and precisely measure condom use rates and FSW population size, so that the resultant data reflect reality as accurately as possible, and to assess the reliability of model based conclusions to variation in these parameter assumptions.
Key messages
-
Given current knowledge about HIV in southern India, mathematical modelling suggests that focusing interventions among high risk groups (FSW, MSM, and clients of sex workers) can be a very effective strategy because of the low potential for HIV transmission among the general population
-
Comparing the potential impact of different components of intervention activity in the short term, increases in the consistency of condom use in SW client, and casual relationships has greatest impact but the combined HIV intervention can be substantially more effective than any individual intervention component
-
STI treatment also has an important impact on HIV transmission, but is only achieved when sufficient coverage is attained, which may only be reached over a longer time frame. The full impact of STI treatment requires that asymptomatic infection is also treated
-
Current time frames used in the evaluation of HIV prevention are likely to be too short to fully capture the benefits of HIV prevention. Particularly for interventions with a strong STI component, longer time frames of 5 years or more are needed
The validity and precision of model projections depend on the quality of the data used to parameterise them. Although there are plans to considerably expand coverage of antiretroviral therapy (ART) in India, currently coverage is in general very low, and so ART effects were not factored into the modelling at this time. As more comprehensive data on sexual behaviour, HIV and STI trends in different risk populations accumulate during the course of the programme, and ART becomes increasingly available where the Avahan intervention is implemented, more sophisticated mathematical models incorporating more accurate and detailed information on the key determinants of HIV in India are to be developed to consider these issues further and validate these preliminary model predictions.
APPENDICES
APPENDIX 1
Technical description of model
The model simulates the transmission of HIV resulting from heterosexual contact between eight behavioural subgroups of males and females. The heterosexual transmission of two STIs between these subgroups is also simulated. The model is formulated in Borland C++ (Inprise Corporation, Scotts Valley, CA, USA), as a set of deterministic ordinary differential equations that describe the movement of individuals between discrete subpopulations—based upon their sex (r = 0 and r = 1 denotes males and females, respectively), sexual behaviour, STI, and HIV infection status. These are described in turn below. A summary of the notation used is given in table A.
In the model, the population is divided into eight subgroups with different levels of sexual activity and condom use (j = 0, sexually inactive, j = 1, just has long term “main” sexual partners and a specified average consistency of condom use, j = 2–4, has long term and casual sexual partnerships and the consistency of condom use with the casual partnership is low (“none” and j = 2), medium (“sometimes” and j = 3), or high (“always” and j = 4), j = 5–7, has long term, casual, and commercial sexual partnerships and the consistency of condom use with the commercial partnership is either low (“none” and j = 5), medium (“sometimes” and j = 6), or high (“always” and j = 7)*). We consider three levels of consistency of condom use among the casual and commercial sexual partners, as variations in the distribution of condom use will have most effect on the overall patterns of HIV transmission.
As with other HIV compartmental models, each behavioural subgroup is divided into those who are susceptible to HIV infection (x), those who are recently HIV infected and in the initial high viraemia phase (h), and those who have progressed into the low viraemia phase (y). We assume that those with late stage HIV infection are chronically ill, and cease being sexually active. New individuals enter the susceptible population at a fixed per capita recruitment rate (Λr). Susceptible individuals become infected with HIV at a per capita rate that is determined by the per capita risk associated with their sexual behaviour (πsex). When susceptible individuals become infected with HIV they are initially highly infectious (for an average period 1/ν). They then enter a long period of low infectivity (average duration 1/δ). In the model individuals remain in the population until they die or cease sexual activity because of chronic HIV related illness (average duration 1/δ). Equation 1 describes the HIV infection dynamics among the population†.

The probability that a susceptible individual becomes HIV infected per unit time from unprotected sex (πsex) is one minus the probability of not getting infected over this time. The probability of not becoming infected per unit time is the product of the probabilities of not being HIV infected from any sexual act with the different partners they have from each behavioural subgroup. If for each type of partnership, we let drj denote the total number of sexual partners that an individual in subgroup [r,j] has per unit time then, mathematically, the probability that a susceptible individual becomes HIV infected from their sexual partnerships (πsex) per unit time is given by:

where the function φrjp is defined as the probability that a susceptible in behavioural subgroup [r,j] will become HIV infected per unit time from a particular sexual partnership with an individual in behavioural subgroup [r′,p]. The function, ρrjp, is defined to represent the extent to which individuals within any behavioural subgroup form sexual partnerships with individuals of different levels of sexual activity, and has the following form for long term partnerships:

Here δjp is the dirac-delta function, and equals 1 if j = p and 0 otherwise, and the parameter A determines how assortative the mixing is and can be varied from 0 to 1 (1 is complete like with like assortative mixing and 0 is random or proportionate mixing). The form and derivation of the ρrjp function is described in full in an article by Garnett and Anderson.51 The product drjρrjp then gives the total number of a particular type of sexual partnership an individual from subgroup [r,j] forms with those from subgroup [r′,p]. In the context of this model the product drjρrjp of casual and commercial sex contacts are determined by data on number of sex acts and size of the risk population, whereas the long term main partnerships are assumed to be distributed randomly (that is, proportionate mixing).
The parameter φrjp is the product of the probability that an individual from that behavioural subgroup is infected and the probability that the infected partner transmits HIV to the susceptible individual over that time period (defined as Drjp). The probabilities of HIV transmission between a susceptible and infected individual per unit time are derived from Baggaley et al14 and Weinstein et al.52 The probability per unit time (Drjp) that a susceptible (in subgroup [r, j]) acquires HIV infection from having sex with an HIV infected individual (subgroup [r′,p]) can be calculated in a similar manner. If in each unit of time, an individual in behavioural subgroup [r, j] has ηj sex acts with each sexual partner; fj is the probability that a condom is used per sex act; e is the per sex act efficacy of the condom; βr is the probability of HIV transmission per sex act from sex r′ to sex r; αs is the extent to which STI co-infection of either partner increases the probability of HIV transmission, and αsex is the extent to which the initial high viraemia phase increases the probability of HIV transmission, then Drjp can be written:

where ys denotes the number infected with an STI and

Here the variables Φ, Ε, Γ, and Η denote the probabilities that a susceptible person, who is having sex with an HIV infected person, does not become HIV infected per unit time in the following different situations; neither partner has a particular STI and the HIV infected partner is not in the high viraemia phase (Φ); at least one partner has an STI and the HIV infected partner is not in the high viraemia phase (Ε); neither partner has an STI but the HIV infected partner is in the high viraemia phase (Γ); at least one partner has an STI, and the HIV infected partner is in the high viraemia phase (Η). Equations 4 and 5 are extended to include the possibilities of each partner having STI-1 or STI-2, but are not shown here for simplicity. The overall cofactor for when two STIs are present is additive.
STI dynamics
The model simulates the transmission of two STIs between sexual partners. Both HIV susceptible and HIV infected individuals can acquire an STI. The per capita probability of STI transmission per unit time (πs) is analogous to the per capita probability of HIV infection per unit time (πsex) (equation 2). If the probability of STI transmission per sex act is βstd, and ys is the number infected with an STI, then for each partnership the probability that a susceptible individual is infected with a STI per unit time (defined as Dsrijop) is:
If we let xs denote the number susceptible to an STI, and ys denote the number infected with an STI, then the transmission dynamics of the STI can be described using a set of deterministic differential equations (equation 7). For this we assume that individuals remain infected for an average period of time (1/μr), and then become susceptible to the STI once more.
Equations 6 and 7 are defined similarly for two STIs.
Latin Hypercube sampling
Latin Hypercube sampling is a multivariate procedure that allows the sampling of a large number of parameters at the same time to create a series of different parameter sets (that is, different parameter values in each). This procedure is widely used in epidemiology as it enables the exploration of a wide range of parameter values economically (that is, with fewer simulations than with a full factorial design). The method is fully described in a previous paper by Blower and Dowlatabadi.50
Acknowledgments
This work was carried out under the India AIDS Initiative (Avahan), which is funded by the Bill and Melinda Gates Foundation. The contents of this paper do not necessarily reflect the views of the foundation. The authors have no competing interests to declare. Charlotte Watts, Peter Vickerman and Anna Foss are also funded from the DFID funded AIDS Knowledge Programme. The views expressed are those of the authors and cannot be taken to reflect the official opinion of the institutions to which the authors are affiliated.
CONTRIBUTORS JRW participated in the planning of the analysis, gathered already published and unpublished behavioural and epidemiological data for Mysore, performed simulations and sensitivity analysis, analysed data, interpreted results, and wrote the manuscript; MCB planned the analyses, performed sensitivity analyses for Mysore, developed templates for data analysis, interpreted results, and helped to write the manuscript; PV developed the mathematical model, helped to design the study, fitted the model to Mysore data, interpreted results, and participated in writing the Methods and Results sections; AF gathered already published and unpublished behavioural and epidemiological data for Bagalkot, fitted the model to Bagalkot data, performed the Bagalkot multivariate sensitivity analysis, and helped revise the manuscript and interpret results; CW and CML helped in designing the study and the manuscript; RGW, SRP, BMR, JB, CML, SM, MA all provided published and unpublished epidemiological and behavioural data for specific sites, helped with the interpretation of the data, and contributed to the manuscript and description of the intervention.
REFERENCES
Supplementary materials
Files in this Data Supplement:
Footnotes
-
↵* In general the user can specify the rate of change of sexual partners corresponding to different sexual activities and the average number of sex acts per unit time for each type of partnership.