Article Text

Abstract
Background: Several developed countries have initiated chlamydia screening programmes. Screening for a sexually transmitted infection has both direct individual and indirect population-wide effects. Mathematical models can incorporate these non-linear effects and estimate the likely impact of different screening programmes and identify areas where more data are needed.
Methods: A stochastic, individual based dynamic network model, parameterised from UK screening studies and data on sexual behaviour and chlamydia epidemiology, was used to investigate the likely impact of opportunistic screening on chlamydia prevalence. Three main strategies were considered for <25 year olds: (1) annual offer to women; (2) annual offer to women or if changed partner within last 6 months; (3) annual offer to men and women. Sensitivity analyses were performed for key screening parameters including uptake rate, targeted age range, percentage of partners notified, and screening interval.
Results: Under strategy 1, continuous opportunistic screening of women <25 years of age is expected to reduce the population prevalence by over 50% after 5 years. Prevalence is also expected to decrease in unscreened older women and in men. For all three strategies screening those aged over 25 results in small additional reductions in prevalence. Including men led to a faster and greater reduction in overall prevalence, but involved approximately twice as many tests as strategy 1 and 10% more than strategy 2. The frequency of attendance at healthcare sites limits the number of opportunities to screen and the effect of changing the screening interval.
Conclusions: The model suggests that continuous opportunistic screening at high uptake rates could significantly reduced chlamydia prevalence within a few years. Opportunistic programmes depend on regular attendance at healthcare providers, but there is a lack of high quality data on patterns of attendance. Inequalities in coverage may result in a less efficient and less equitable outcome.
- Natsal, National Survey of Sexual Attitudes and Lifestyles
- NCSP, National Chlamydia Screening Programme
- PID, pelvic inflammatory disease
- SIS, Susceptible-Infected-Susceptible
- Chlamydia trachomatis
- screening
- mathematical model
- sexual network
- transmission dynamics
Statistics from Altmetric.com
- Natsal, National Survey of Sexual Attitudes and Lifestyles
- NCSP, National Chlamydia Screening Programme
- PID, pelvic inflammatory disease
- SIS, Susceptible-Infected-Susceptible
Genital chlamydia infection is a prevalent bacterial sexually transmitted infection (STI) internationally and a leading cause of preventable infertility.1,2Chlamydia trachomatis infection is most common in young, sexually active adults.3 In the United Kingdom, approximately 3–10% of women aged under 25 years are infected.4 Treatment with antimicrobials is simple and cheap; however, chlamydia is often asymptomatic.5 If left untreated, infection may result in long term sequelae such as pelvic inflammatory disease (PID), ectopic pregnancy, and infertility.6 In England in 2002, the National Chlamydia Screening Programme (NCSP) began opportunistic screening in clinical and non-clinical settings, including primary care.7 Eligible attendees are offered a chlamydia test, irrespective of reason for attending. Several other countries have chlamydia screening programmes, including the United States, Sweden, and the Netherlands.8,9,10
Screening and treating those infected with chlamydia not only benefits the individuals identified by the programme, but also confers indirect benefits on the wider population, by preventing onward transmission. However, these dynamic, non-linear effects are difficult to predict and field studies of chlamydia screening are necessarily restricted in duration and the range of scenarios that can be investigated. Mathematical models offer a means to estimate the direct and population level effects of different interventions.11–14 Programmatic questions can also be addressed—for example, what is the effect of screening men as well as women?
We use a transmission dynamic mathematical model (as this is the appropriate method to evaluate interventions against infectious diseases11,15,16) extensively parameterised to represent current sexual behaviour and chlamydia transmission dynamics in England.14 Different screening strategies were simulated to investigate the potential impact of opportunistic screening on population prevalence. The insights obtained are widely applicable to countries considering chlamydia screening.
METHODS
We used an individual based, stochastic dynamic sexual network model of chlamydial infection, extended from that of Ghani et al,13 to include age structure, age dependent sex partner preferences, partner notification, and opportunistic screening.14 A detailed description of the model and its parameterisation are given elsewhere14; a brief summary is presented.
The model population consists of 40 000 individuals (20 000 men and 20 000 women) aged 16–44 who form and break sexual partnerships according to age dependent sexual behaviour and mixing patterns. The model has a Susceptible-Infected-Susceptible (SIS) structure, in which susceptible individuals are infected by an infected partner. Infected individuals return to a susceptible state, either through natural resolution of infection, actively seeking treatment, partner notification or screening (fig 1).
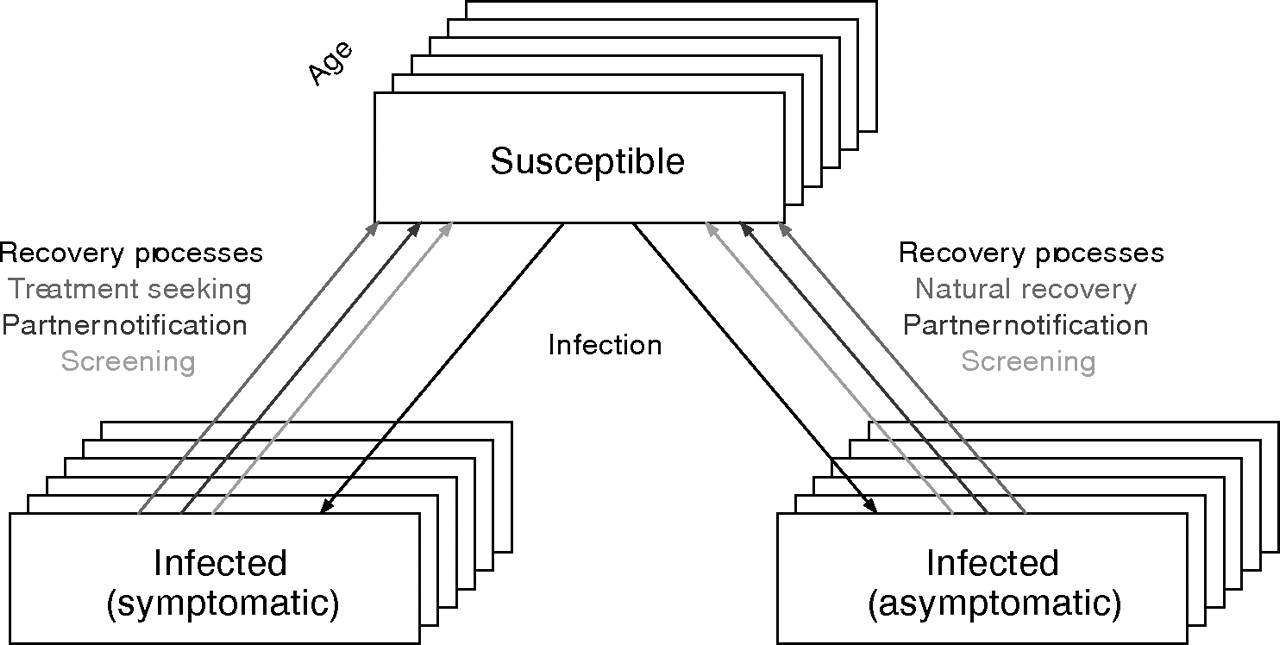
Illustration of chlamydia infection and recovery processes in the model.
Parameters were obtained directly from appropriate data and literature or were estimated by fitting the model to UK data on sexual behaviour, chlamydia epidemiology and health care seeking behaviour.14 The National Survey of Sexual Attitudes and Lifestyles (Natsal) 2000 survey, the Chlamydia Screening Pilot, the Chlamydia Recall Study and other analyses of UK data were all used to inform parameter estimates.4,14,17–20 The baseline parameter values for sexual behaviour, infection, and health care are given in table 1.
Baseline parameter values used in mathematical model
The model incorporates the effect of changing behaviour with age.14 At the end of each year, individual preferences for number of partners and duration of partnership are adjusted (table 1). Partnerships become more stable and fewer new partnerships are formed, as individuals get older. The probability of a partnership forming between two individuals depends on their ages but not activity level.14
Individuals actively seeking treatment are assumed to recover faster (average duration of 1 month), compared to those who do not (6 months). Those with untreated infection may receive treatment via partner notification or screening (fig 1). The model was fitted to data on chlamydia prevalence in women attending GP clinics4 and the proportion reporting ever having received chlamydia treatment (Natsal 2000),17 to estimate the proportion of new infections which result in treatment seeking, the transmission probability, and the level of partner notification most consistent with the observed data. The proportion ever treated (owing to active treatment seeking or partner notification) at baseline is comparable to observed treatment rates in the United Kingdom.14
In the Chlamydia Recall Study, 85% of women reported that they had attended any healthcare setting within the last 12 months20; this is similar to the GP attending figures reported by Salisbury et al.24 This was used to calculate a per day probability of attendance of:
pa = 1 − (1 − 0.85)(1/365)
The number of individuals attending per day was chosen from a Poisson distribution with mean pa. For each screening strategy the number of individuals attending healthcare sites eligible for opportunistic screening per year was calculated.
Screening strategies
In England, the NCSP recommends once yearly screening for women and men under 25 years of age or more frequently if there is a change of sex partner.7,25 The model, parameterised with the best fitting values, was used to explore the effect of a variety of different opportunistic screening strategies. Results are shown as the average of 40 stochastic realisations.
Three main strategies were defined and compared with a no-screening, baseline situation (box). Strategies 1–3 were implemented for different age groups (<20, <25, <30, <35, <40 years old). Variations on strategy 2 were used to investigate the effects of different programmatic algorithms—for example, differential rescreening intervals depending on previous test result, age, or sexual behaviour.
As screening is offered opportunistically, the planned screening interval will be shorter than the actual screening interval, as the woman (or man) has to attend an appropriate healthcare setting after they become eligible for a screen. Accepting or refusing a screen previously is assumed not to affect current or future behaviour. On each day an average of N.pa people attend, where N = population size and pa = per day probability of attendance. Those eligible are offered a screen, and a proportion of those offered, accept. In all the base case scenarios there are no individuals or subpopulations more or less likely to attend or to accept screening, but in practice differences may exist, owing to the effects of patchy coverage of a screening programme or individual variation in the probability of attendance or acceptance.
Sensitivity analyses
To investigate the impact of differences in the probability of acceptance, partner notification efficacy, variability in coverage, or uptake of a screening programme and the use of different screening intervals on the efficacy of the programme, additional analyses were performed. The following modifications were made to strategy 3 (for those aged <25 years). This was chosen as it most closely approximates the NCSP recommendations.
Acceptance
The probability of accepting a screen when offered was varied (between 10–70%). An additional pessimistic simulation was performed assuming acceptances of 10% (women) and 1.4% (men) to capture the male:female ratio of screens currently observed in the NCSP.26 The base case acceptance rates used (50%) were roughly midway between those observed in pilot screening programmes in the United Kingdom: the ClaSS study achieved an acceptance rate of 35%22 and the Chlamydia Screening Pilot, 78%19 overall (range 54%–100% depending on setting).
Partner notification efficacy
The efficacy of partner notification when screening is introduced was changed from 20% to 50% (applies to partners of those screened and those actively seeking treatment). Recent data suggest this level of partner completed therapy may be achievable.20,27
Unequal coverage
The model population was divided into two groups: 50% attend/are offered/always accept screening and 50% don’t attend/are not offered/never accept screening (baseline = all attend, all offered, all have 50% probability of accepting each time a screen is offered).
Screening interval
The screening interval was varied between 3 months and 24 months for strategies 1 and 2 (baseline interval 12 months).
Limited acceptance
Individuals only accept a screen once. Evidence suggests that the probability of accepting a screen drops after the first screen.28
RESULTS
The prescreening equilibrium population prevalence (ages 16–44) was 3.5% (SD 0.4%) in men, 2.9% (SD 0.3%) in women and 3.2% (0.4% standard deviation) overall, averaged over 920 realisations. There was stochastic variation between realisations. Screening strategies 1–3 resulted in a significant decrease in the population prevalence. Table 2 shows the impact on population prevalence over time and the number of screens performed under each strategy (<25 years old) after 10 years. Strategy 1 reduced prevalence from 3.2% to 1.4% after 5 years and to a new stable level of 0.9% within 10 years. Including additional screening if recent partner change has occurred (strategy 2) increased the effectiveness of the screening programme and including men (strategy 3) resulted in further benefits. Approximately half of those eligible are screened each year under strategy 3 (<25 year olds). The more complex algorithms (strategies 2b–d) had similar effectiveness to strategy 2.
Reduction in model population prevalence (males/females, all ages) under different screening strategies: 1, 5 and 10 years after introduction of screening
Screening strategies implemented
Strategy 1 Offer annual screen to women
Strategy 2 Offer annual screen to women and if changed their partner in the past 6 months
Strategy 3 Offer annual screen to women and men
Strategy 2b Offer annual screen to women <25 years old if initial test result is negative, women <25 years old twice a year if initial test result is positive, and women <25 years old if they have changed their partner in the last 6 months.
Strategy 2c Offer annual screen to women 16–20 years old, women 21–24 years old biennially, and women <25 years old if they have changed their partner in the past 6 months.
Strategy 2d Same as strategy 2c and stop the screening offer if a woman has no partner change in the last 6 months and two consecutive negative chlamydia tests. Screening restarts if she subsequently changes her partner.
The effect of strategies 1, 2, and 3 (<25 year olds only) on chlamydia prevalence in different age groups is shown in figure 2. Before screening, prevalence was highest in the youngest age group and decreased with age (fig 3). Screening had the greatest impact in those targeted, although the prevalence also decreased in older women (fig 3) and in men (not shown). For all three strategies, screening those over 25 years of age resulted in small additional reductions in prevalence, but more screens were performed on negative individuals.
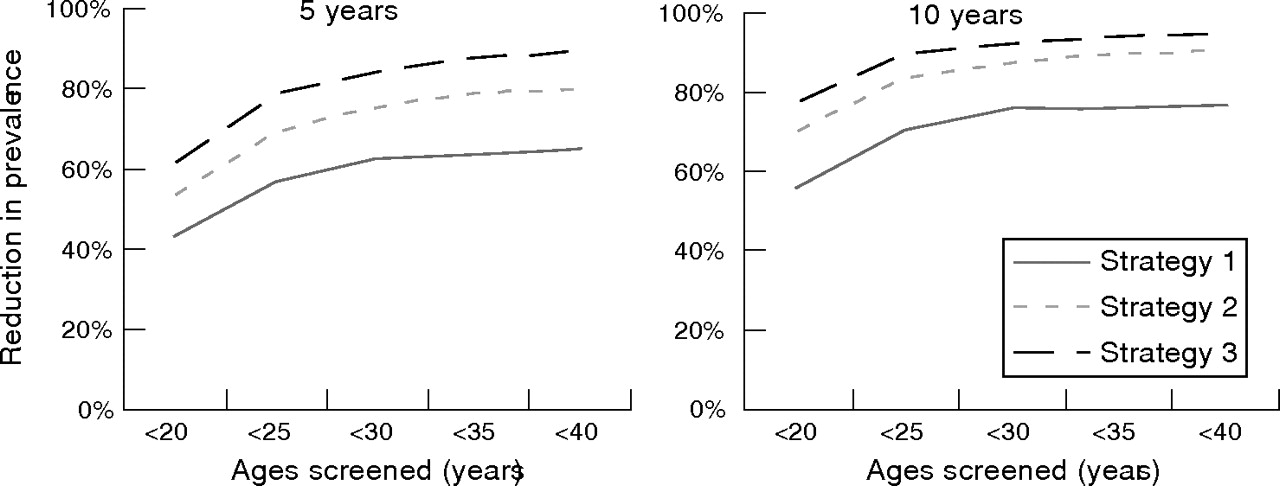
Reduction in population prevalence (men and women, all ages) 5 years and 10 years after screening implementation, for strategies 1, 2, and 3 with different age limits.

Age specific impact of screening strategies 1 (A), 2 (B), and 3 (C) (under 25 years) on chlamydia prevalence in women using the base case parameter set.
Including men (strategy 3) led to a faster and greater reduction in overall prevalence (to 0.7% after 5 years, fig 3), but twice as many tests were performed compared with strategy 1 and 10% more compared to strategy 2. Strategies screening only women also led to a significant reduction in male prevalence through partner notification and a reduction in risk of infection (indirect protection or herd immunity).
The effect of changing the logistical parameters of acceptance, partner notification, and unequal coverage was investigated under baseline strategy 3 (<25 year olds only) (table 2). Reducing the acceptance made screening less effective, but increasing acceptance above 50% had little additional benefit. Chlamydia prevalence after 5 years was 2.0%, 1.0%, 0.7%, and 0.5% for an acceptance of 10%, 30%, 50% and 70%, respectively. Changing the proportion of partners effectively notified from 20% to 50% when screening was introduced increased the impact of screening. However increasing PN to 50% with no screening also decreased the prevalence by about 7% after 10 years. Screening was less effective if only a fraction of the population was involved in the screening programme (table 2) and inequalities in health are generated. If the population is divided into those who attend/accept (or have access to screening) and those who do not, the overall prevalence is reduced, but the reduction is greater in those who are screened than in those who are not (fig 4).
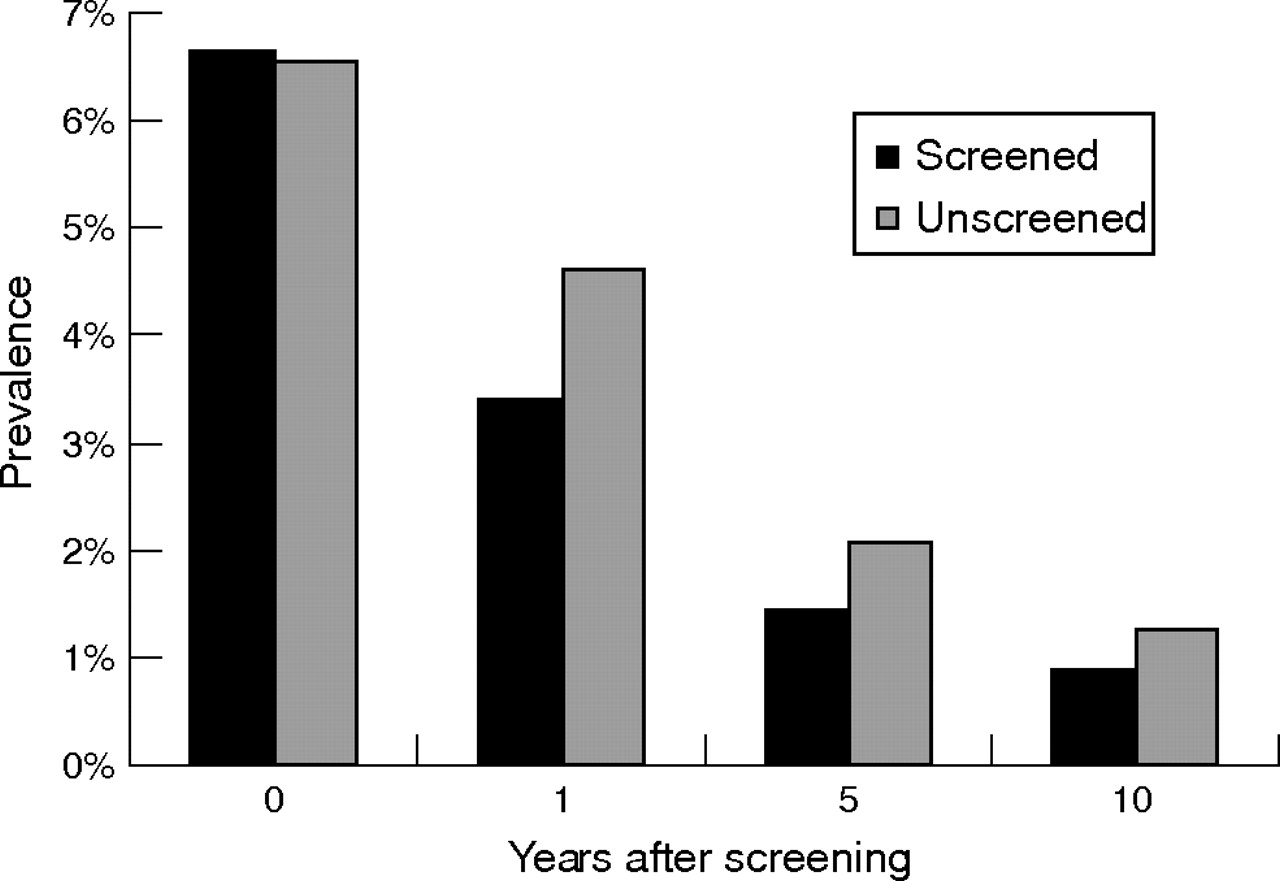
Prevalence of chlamydia (16–24 year old men and women) in the screened and unscreened populations over time (strategy 3, annual screen offer to men and women <25 year olds).
The average number of screens per person indicates the screening frequency and is presented in figure 5 for strategies 1 and 2. In the model, women attend just under twice per year on average. The maximum screening frequency equals half the attending frequency (for acceptance at 50%), when a screen is offered at every attendance. Under strategy 1 (annual screening of women) the average number of screens increased as the screening interval decreased. Under base case assumptions women aged 24 have had on average four screens since age 16—that is, annual opportunistic screening roughly equates to one screen every 2 years under base case assumptions of attendance and acceptance rates. When the screening interval was halved from 12–6 months, the average number of screens per woman per year increased from 0.5 to 0.7. With no screening interval (continuous eligibility), screening frequency saturated at 0.9 screens per woman per year. This was also the case for screening strategy 2 and changing the screening interval did not affect the average annual number of screens per person (fig 5), because young women changed partners more frequently in the model than they attended healthcare sites, hence were nearly always eligible for screening. Attendance is the rate limiting step.

Average number of screens per woman by age under screening strategy 1 (screen women aged 16–24 annually) and strategy 2 (screen women aged 16–24 annually and if partner change in past 6 months), assuming different screening intervals.
DISCUSSION
The effects of different opportunistic screening strategies on the prevalence of chlamydia in the general population and in those targeted were investigated. Modifications were made to the individual based mathematical model of STI transmission developed by Ghani et al.13 The extended model is a tool for public health decision makers to explore a range of planned interventions and “what if” scenarios. The model has been parameterised to reflect chlamydia transmission and epidemiology in the United Kingdom, but the conclusions drawn from it may be broadly applicable to other similar countries.
All strategies (1–3) resulted in a substantial reduction in prevalence, providing acceptance was at least 50%. The screening strategies investigated were based on opportunistic testing of individuals attending healthcare settings (box). Screening based on recent partner change (strategy 2) allowed more frequent screening in the population and reduced overall and age specific prevalence more than annual screening alone (strategy 1). The more complex algorithms (strategies 2b–d) had a similar effect to strategy 2 because most women were eligible to be offered a screen each time they attended, so the strategies could not be distinguished. Including annual screening for men (strategy 3) caused a further reduction in prevalence compared with strategy 1, but the added benefit was small in relation to the increase in number of screening tests performed. If, however, acceptance is low screening may only have a small impact on prevalence as transmission continues. Attendance was assumed to be about twice per year and was the limiting factor to the impact of screening at different time intervals. For an opportunistic programme, the observed screening interval is longer than the recommended interval because attendance occurs infrequently. More data are required to define the average number of attendances per person at different settings offering chlamydia screening.
A mathematical model is an abstraction from reality, which aims to capture the important components to aid understanding and inform decisions. However, the predictions should not be regarded as truth, but rather as the likely outcome, if our description of reality is accurate. The strengths and weaknesses of the model are discussed further elsewhere.14 We believe that the model represents an improvement over previous analyses of chlamydia screening effectiveness29–34 although the model and results are broadly comparable to those of Kretzschmar et al.12 We have used a transmission dynamic model,14 which is able to capture the indirect benefits of population level programmes. It has been extensively parameterised to represent current sexual behaviour, treatment, partner notification practices, and chlamydia transmission dynamics in the United Kingdom. The proportion ever treated was used to validate the treatment seeking parameters, whereas previous models have not taken these data into account.12 The model is individual based, thus enabling variability in infection risk and complex screening options, such as partner notification and flexible screening intervals based on individual clinical histories to be investigated.
The model predicted large reductions in prevalence under baseline scenarios. These are comparable to other model predictions—for example, Kretzschmar et al predicted a reduction from 4.2% to 1.4% prevalence after 10 years.12 The effects of screening on prevalence may be large if the reproductive number (R0) is low, as appears to be the case for chlamydia. The assumption was made for model fitting that chlamydia prevalence was at equilibrium but diagnoses have increased steadily since 2000.35 This would also lead to overestimating the likely impact of screening since in reality the programme would have to first slow the rate of increase before a reduction in prevalence would be seen. Finally, the average rate of partner change modelled is higher than recorded in young women.14 This may, in part be because of under-reporting of sexual partners by females18,20 or may be the result of the underlying model structure. The effect of this may be that the impact of screening based on partner change rates (strategies 2) are overestimated in this group, if the reported female rates are true. The positivity observed in NCSP is somewhat higher than we modelled (11% v 8% in 16–19 year olds and 9% v 6% in 20–24 year olds). Although this is positivity not prevalence, it seems likely that the prevalence now may be somewhat higher than we have modelled. The qualitative results would be unchanged, but the reduction may be slower to occur.
The proportion seeking treatment predicted by the model fitting14 is very low. The data on the number of people who reported receiving treatment (Natsal 2000) may be an underestimate because of recall bias and changes in testing practice before 2000. However, KC60 data show that in 2000 there were only approximately 12 000 reports of chlamydia for men under 25 and 24 000 in women in England (www.hpa.org.uk). If partner notification was 50% (and each woman had on average one partner), the male reports could be explained entirely by partner notification. Low diagnosis rates, twice as high in women as in men, are consistent with the Natsal 2000 data on self reported history of chlamydia. These data imply that before screening active treatment seeking rates were very low, particularly in men. The proportion symptomatic used by Kretzschmar et al was 50% for men and 30% for women12 (these values are similar to those used in other modelling studies34,36). However, such high rates of diagnosis combined with a prevalence of up to 10% in the under 25s would result in far greater numbers of reports of chlamydia diagnoses (either through routine surveillance or self reported history) than were observed. Thus we believe that our estimates of treatment seeking behaviour before screening are more realistic than have previously been assumed.
The maximum achievable coverage is determined by the provision of screening, and the rate of attendance and acceptance of those services. The behaviour of individuals may be mediated by demographic or socioeconomic factors and perception of risk.10,19 Heterogeneity in acceptance and attendance reduced the overall effectiveness of the intervention (fig 4). Those who do not access screening benefit through herd immunity effects because of lower average population prevalence. However, those who access the intervention gain a greater benefit than those who do not, generating inequalities in health.
Increasing effective partner notification from 20% to 50% increased the effectiveness of screening. The Chlamydia Recall Study quantified the effectiveness of partner notification as 48% of known partnerships.20 This is higher than the 20% estimated,14 but the prospective nature of the study, recalling people for testing and extra follow up interviews and phone calls, may have increased the effective coverage of partner notification compared with routine practice. Recent data from the NCSP indicate an effective partner treatment rate of 49%, suggesting that a target of 50% completed partner treatment is achievable.27
In countries with well established opportunistic screening programmes (for example, Sweden, Canada), initial decreases in chlamydia diagnoses have been followed by an increase, sometimes to above prescreening levels.9,37 Assuming that the change reflects a true increase in prevalence, there are several possible interpretations including (a) changes in sexual behaviour, increased number of partners or reduced condom use, (b) difficulties maintaining adherence—for example, people get screened once but do not believe themselves to be at risk in the future, (c) worsening provision of or access to sexual health services. It is also possible that early treatment may interfere with the development of acquired immunity38 to chlamydia, as shown in a mouse model.39 Further work to understand the observations is needed, but the impact of screening may be harder to realise than hoped.
Key messages
-
Achieving a sustained reduction in chlamydia prevalence may be possible with continuous opportunistic screening but high acceptance, universal coverage, repeated testing, and effective partner notification are needed
-
The model predictions are strengthened by the use of appropriate, high quality data to validate and fit the model
-
The screening interval has little impact on the effectiveness of screening, because attendance and acceptance are the limiting factors
The model results suggest that an opportunistic screening programme could reduce chlamydia prevalence, providing that the healthcare settings offer screening to the entire eligible population when they attend, partner notification is maintained or improved, attendance rates to these healthcare settings remain high, and a significant proportion of those offered screening accept the invitation.
Acknowledgments
Thanks to Dr A Ghani for providing her original model, Nigel Gay for scientific consultation and reviewers for comments. We also gratefully acknowledge the Natsal 2000 research team and the Chlamydia Recall Study Team for providing data.
CONTRIBUTORS
KMT wrote the first draft of the paper, designed and implemented changes to the computer program; EJA performed the simulations and analyses; WJE supervised and advised on the modelling and programming work; KMT, EJA, WJE, DSL contributed to the interpretation of results, contributed to the experimental design and implementation, critically reviewed drafts, and contributed to writing the paper; LE provided data from the Chlamydia recall study and critically reviewed drafts; KB provided statistical advice on data from the Chlamydia Recall study and critically reviewed drafts. All authors have seen and approved the final version and have no conflict of interest.
REFERENCES
Footnotes
-
Source of funding: funding for the work was provided by the Health Protection Agency and the Department of Health (England).
-
Conflict of interest: none.
-
Patients’ consent, permission to publish, and ethical approval were not necessary for this study.
Linked Articles
- Brief Encounters