Article Text

Abstract
Objectives: We evaluated two methods to describe detection of herpes simplex virus (HSV) from the genital mucosa.
Methods: We assessed genital swabs from HSV-2 seropositive people participating in longitudinal studies of HSV DNA detection at the University of Washington Virology Research Clinic. We determined the length of observation period necessary to ensure some HSV detection for most individuals. We compared two measures to assess differences in shedding according to HIV status, the shedding rate ratio, defined as the proportion of total samples with detectable HSV in HIV-1 seropositive versus HIV-1 seronegative participant, and the ratio of “shedders”, defined as the proportion of people with any shedding over the interval in HIV-1 seropositive versus HIV-1 seronegative people.
Results: While only 17% (51/308) of HSV-2 seropositive people shed on their first day on study, 77% (238/308) had some genital shedding over 30 days (any HSV DNA detected on genital swabs). Shedding rate ratios (SRR) for HIV-seropositive versus HIV-seronegative people varied from SRR = 1.42 using 10 samples to SRR = 1.35 using 50 samples. The ratio of “shedders” (RS) approached 1 as the observation period increased (RS = 1.13 using 10 samples to RS = 1.01 using 50 samples). In a hypothetical case, the ratio of “shedders” was shown to exceed 1 when shedding rates were equal.
Conclusions: Most HSV-2 seropositive people shed HSV from the genital mucosa. Dichotomisation of people into “shedders” and “non-shedders” or “high” and “low” shedders yields inferences that depend upon sampling interval length. Overall shedding rates provide consistent measures regardless of the number of swabs collected.
Statistics from Altmetric.com
Viral shedding (defined as having virus detected on swabs of the genital mucosa) is a common outcome in herpes simplex virus (HSV)-related studies. Detection of viral shedding can be used to confirm infection, to demonstrate infectiousness and as a measure of disease severity. For example, the frequency of HSV reactivation shedding has been associated with disease severity,1 2 as well as risk of HSV transmission to an infant3 4 or to sexual partners,5 and has been used as a means of demonstrating the effectiveness of antiviral therapy.6 7
For those infected with HSV, mucosal shedding may occur infrequently and may last only a few days or hours.8 Frequency of HSV reactivations is difficult to predict and may depend on host immune status, time since acquisition of infection and concurrent infections.9 10 As a consequence, not all people will shed during short observation periods. Nevertheless, many studies summarise viral shedding patterns by assessing the presence of detectable virus at a single time point. In other cases, the term “shedder” has also been applied in studies of viral detection of HSV4 8 11–17 and HIV,11 13 16 to describe an individual who has any detectable shedding over repeated sampling. While the term “shedder” may not be used explicitly, the dichotomous classification is often made between those who shed over the observation period and those who do not.
We consider the implications of the dichotomisation of shedding patterns into any detection (“shedder”) in describing shedding frequency both theoretically and using data from studies of HSV mucosal shedding. Then we consider the impact of this classification on detection of group-level differences in HSV shedding frequency and in other contexts.
METHODS
Participants and setting
HSV-2-seropositive participants enrolled in a variety of studies performed self-collection of genital mucosal swabs at home for HSV polymerase chain reaction (PCR) at the University of Washington Virology Research Clinic (UW VRC) between 1992 and 2002.5 7 10 18–20 A single Dacron swab was collected daily for a period of at least 30 days by participants, swabbing the genital and perianal area. The human subjects review committee at the University of Washington approved each study and all participants gave written informed consent.
Laboratory methods
HSV-2 serostatus was determined using western blot.21 Quantitative, real-time HSV PCR was performed from swabs for HSV DNA as previously described.22 23
Statistical methods
Literature review
We performed a review of recently published studies whose procedures involved repeated measurement of HSV-2 via PCR. We compared number of swabs collected with measurements of the overall shedding rate (number of swabs positive out of swabs collected) and with the proportion of participants designated as “shedders” (proportion of people with detectable HSV DNA at any time) using Spearman’s correlation coefficient.
Clinical data evaluation
We assessed shedding rates, proportion of people with any shedding, and shedding episode characteristics. An episode was defined as any period of HSV DNA detection including no more than one consecutive missed or negative swab. We computed the rate ratio on all available samples using Poisson regression24 with HIV status as the only covariate. Using a fixed number of samples per person (between 1 and 50 samples) we estimated: (1) the ratio of shedders (RS) by dividing the proportion of participants with any (or “high”) shedding detected in one group by the other, and (2) the shedding rate ratio (SRR) using Poisson regression which estimates the ratio of group-specific overall shedding rates (swabs positive out of total swabs collected in one group divided by the other).
Theoretical model
In order to examine the implications of the dichotomisation “shedder” on shedding rates and characteristics other than those observed, we modelled HSV-2 episode duration and the period between episodes using the geometric distribution.25 The geometric distribution is the discrete analogue to the exponential distribution used by others26 27 to describe reactivations. We then constructed the probability of observing at least one episode (any shedding) for a given average episode length (μ) and average non-shedding interval length (λ) during a time period of length L. It is 1 minus the probability that the observation period begins during the interval between episodes multiplied by the probability that no episodes begin within the succeeding L − 1 days:

We computed this probability over a range of values for μ, λ and L and computed the associated shedding rate.

We also computed the ratio of “shedders” and the shedding rate ratio between two hypothetical groups A and B, varying numbers of samples and episode characteristics in order to assess their relative values.
RESULTS
Review of HSV shedding studies
We first reviewed studies published between 2005 and 2008 in which HSV-2 detection by PCR was performed, using a Medline search on the keywords “shedding” and “HSV”. We selected studies whose procedures involved repeated measurement of HSV-2.4 8 11–17 From each relevant paper, we recorded the overall shedding rate (swabs positive out of total swabs collected) and also the proportion of “shedders” (proportion of people in whom HSV DNA was detected by PCR at any time). The probability of any HSV detection increased with observation length (table 1, top portion). For example, 25% of HIV-1 seronegative HSV-2-seropositive people in Burkina Faso shed HSV at least once over four samples,15 while 54% of HIV-1/HSV-2 seropositive people in Burkina Faso shed HSV at least once over six samples,16 despite the overall shedding rate being lower in the latter study (9% and 4%, respectively). The proportion of people having HSV DNA detection on at least one sample did not correlate with overall shedding rate (Spearman’s rho = 0.10, p = 0.78). The rate of any HSV detection was, however, strongly correlated with total number of samples collected (Spearman’s rho = 0.70, p = 0.01). Therefore, the detection of any shedding appeared more closely related to the length of sampling period than to the underlying viral shedding frequency. In some studies we reviewed (table 1, bottom portion) the rate of any HIV detection was also available, and this varied by the number of samples collected.11 13 16
Observed shedding characteristics among VRC study participants
Between 1992 and 2002, 308 HSV-2 seropositive participants performed daily home collection of genital swabs for at least 30 days (median 60 days, range 30–174) and were included in these analyses. Of these, 89% were white and 128 (42%) were women. None was on suppressive antiviral therapy for HSV, 156 (51%) were HSV-1-seropositive and 83 (27%) were HIV-seropositive. Of 19 082 swabs collected, 3664 (19%) were HSV DNA positive by PCR.
We measured characteristics of HSV-2 reactivations or shedding episodes, defined as consecutive periods of HSV detection. We identified 912 episodes (mean duration 3.6 days, median 2.0). The mean and median interval between episodes of HSV-2 reactivation was 9.4 days and 7.0 days, respectively.
Observed shedding rate ratio versus ratio of shedders
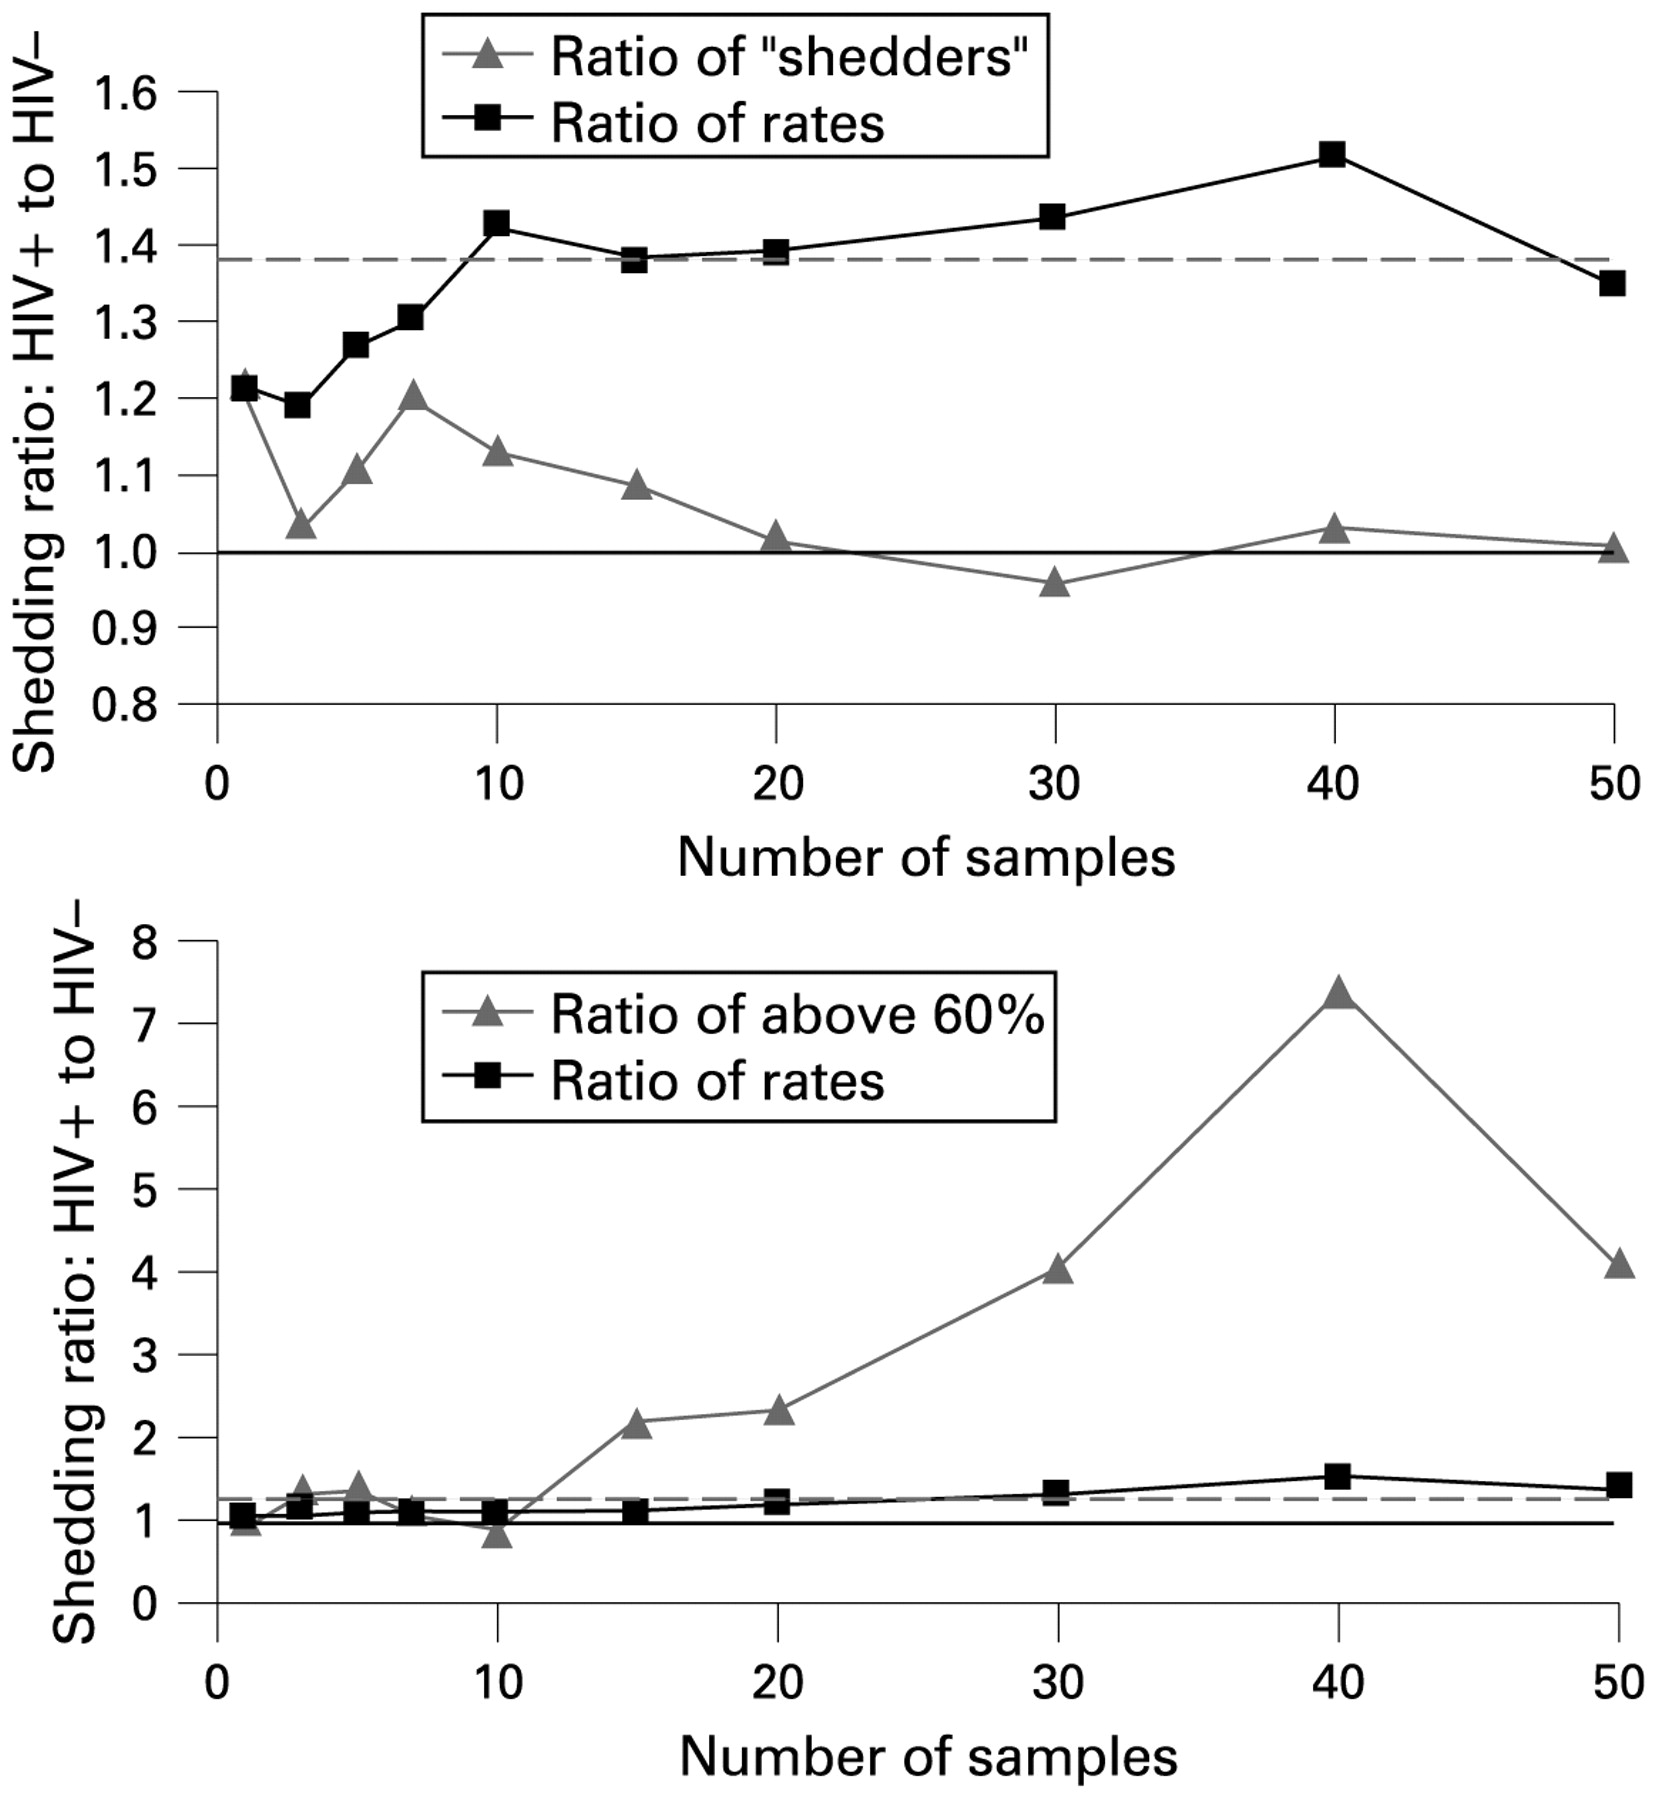
We next evaluated demographic and clinical factors that influenced shedding rates from UW VRC study participants. We examined HIV status as a risk factor for increased shedding. The overall swab-specific shedding rate was 24% (1223/5030) among HIV-seropositive individuals and 17% (2441/14052) among HIV-seronegative individuals. Using Poisson regression on all available swabs, the shedding rate for HIV-seropositive participants was 1.39-fold higher than for HIV-negative participants (95% CI for RR 1.13 to 1.74, p = 0.002). We then computed the shedding rate ratio and ratio of “shedders” over a range of observation periods (fig 1 top). Both methods were highly variable with less than 10 days of sampling. As the observation interval increased, the shedding rate ratio based on HIV status approached the value 1.39 obtained using all available data (from SRR = 1.42 using 10 samples to SRR = 1.35 at 50 samples). However, the ratio of shedders (proportion of HIV-seropositive people with any shedding versus HIV-negative participants) approached 1 (RS = 1.13 with 10 samples to RS = 1.01 at 50 samples).

(Top) Ratios indicating impact of HIV seropositivity on herpes simplex virus (HSV) shedding measured using either ratio of “shedders” (proportion having any shedding over the interval) or shedding rate ratio (number of swabs with detectable HSV DNA out of samples obtained). The broken line indicates risk ratio for shedding based on Poisson regression (1.39) and the solid line at 1 indicates no difference. (Bottom) Ratios indicating impact of HIV seropositivity on HSV shedding measured using either ratio of those having a shedding rate above 60% in each group (HIV-seropositive participants versus HIV-negative participants) or shedding rate ratio (number of swabs with detectable HSV DNA out of samples obtained). The broken line indicates risk ratio for shedding based on Poisson regression (1.39) and the solid line at 1 indicates no difference.
Observed dichotomisation into high versus low shedding
We also examined the consequences of dichotomising into “high shedders” versus low or no shedding using the data described above. We selected several cut-offs and defined those above the cut-off as “high shedders”. Figure 1B shows the results following dichotomisation at 60% shedding. The shedding rate ratio before dichotomisation remained at 1.39 for HIV seropositivity as described above; however, there were 7.4 times as many “high shedders” among HIV seropositives versus seronegatives over 40 samples and 4.1 times as many “high shedders” among HIV seropositives over 50 samples.
Predicted proportion who shed (classified as “shedders”)
To confirm findings based on observed HSV shedding data, we computed shedding rates and estimates of group differences using expected values under the geometric distribution. Table 2 provides the probability of detecting any shedding for a range of average shedding characteristics: s (shedding rate), μ (episode duration) and λ (between-episode interval duration) and observation lengths L.
The predicted probability of observing any shedding, or of classifying a participant as a “shedder”, increased with observation length and decreased with increasing episode duration and interval duration. Shown in bold in boxes are values corresponding to average shedding characteristics of VRC study participants: with a hypothetical shedding rate of 15%, average episode length of 4 days, 35% of participants were predicted to shed over 7 days and 77% over 30 days. These predicted rates matched the observed data in the cohort previously described: 17% (51/308) shed on the first day, 42% (130/308) shed at least once over 7 days and 77% (238/308) shed at least once over 30 days. Predicted rates also matched observed rates for a group of people sampled four times daily (not shown).8
The episode durations and non-shedding interval lengths observed in the participants previously described corresponded well to the geometric distribution with the same mean.
Predicted shedding rate ratio versus ratio of shedders
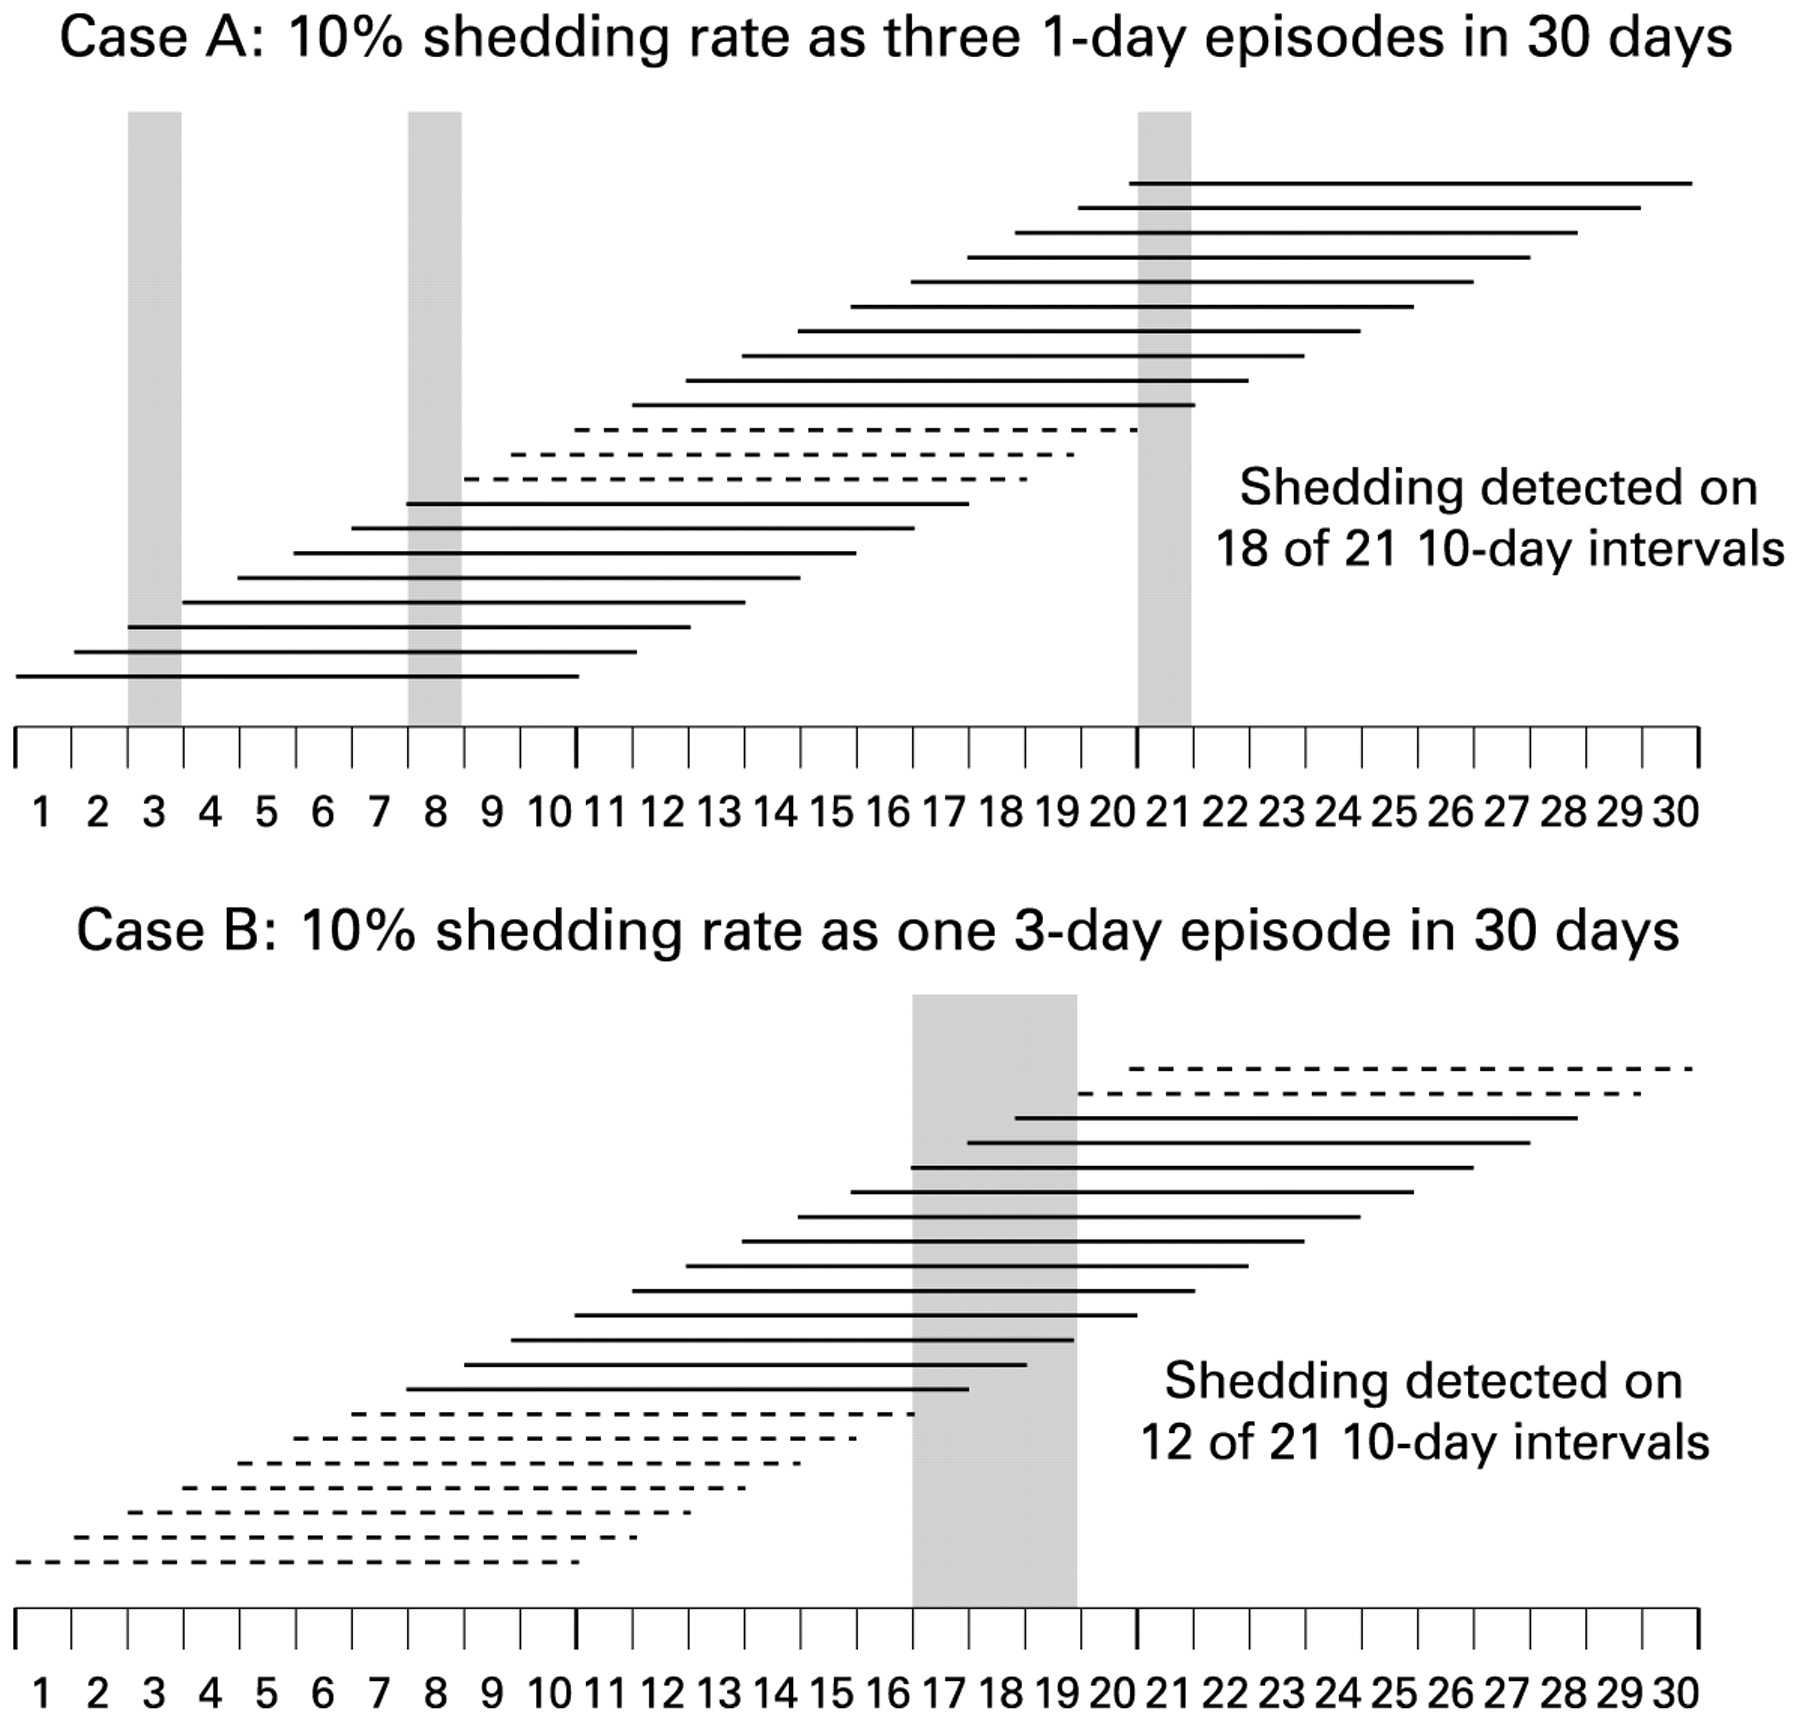
We computed the shedding rate ratio and the ratio of “shedders” based on the geometric distribution with hypothesised average episode characteristics. For example, if groups A and B shed 10% of the time, but group A has shorter episodes on average than group B (1 day versus 3 days (μA = 1, λA = 9, μB = 3, λB = 27)), then the shedding rate ratio was 1 (10%/10%) but the ratio of shedders over 3, 10 and 20 samples was, respectively, 1.7 (29%/17%), 1.9 (69%/36%) and 1.6 (91%/58%) (see appendix 1 on STI website). People in group A were more likely to be classified as “shedders” over a few samples since any shedding was more likely to be detected over an observation period when episodes were short and frequent versus long and rare (example data over a 30-day period is shown in fig 2). In this circumstance, the ratio of shedders created group differences where episode characteristics differ but shedding rate does not.
Classification rates of “shedders” depends on episode duration: two hypothetical cases are shown in which shedding occurs on exactly 3 of 30 days (10%). Viral shedding on each day is indicated by vertical grey bars, solid horizontal lines indicate detection of any shedding over the corresponding 10-day period and broken lines indicate no shedding was detected. Any shedding is detected on 18 of 21 intervals when episodes last a single day and on only 12 of 21 intervals when episodes last 3 days.
Predicted group differences with non-episodic viral shedding
We examined ratios of “shedders” when shedding patterns follow the binomial distribution. The probability of any shedding over an interval is shown in appendix 2 on the STI website. Similar difficulties also occurred in this setting: the probability of being a “shedder” increased with the length of observation interval (see appendix 2 on STI website), and the ratio of “shedders” in different groups was found to be either larger or smaller than the shedding rate ratio (see appendix 3 on STI website).
DISCUSSION
Most HSV-2 seropositive people have genital HSV detected over observation periods lasting 30 days or longer, and the proportion classified as “shedders” increases with the number of samples collected. In fact, it is likely that most if not all HSV-2 seropositive people shed HSV in the genital tract if observed for long enough periods.20 Therefore, the term “shedder” is context specific.
It is appealing to dichotomise individuals into “shedders” and “not shedders” or into “high shedders” versus others since the computation is straightforward and may provide a qualitative distinction between those who shed frequently and those who do not. However, the data presented here demonstrate the trouble with drawing conclusions based on the quantitative ratio of “shedders” or “high shedders”. Real data examples using HIV status and HSV shedding show that dichotomisation can cause group differences to appear larger or smaller than shedding rate ratios, depending on observation length. Theoretical examples also confirm these differences.
Conclusions based on dichotomisation of the data may be misleading, particularly for studies that attempt to determine risk factors for viral transmission to others. The dichotomisation may provide an arbitrary and context-dependent distinction between groups when defining risk factors for shedding, and it may not be predictive of disease status or infectiousness. A better summary measure is overall shedding rate: number of positive samples out of all swabs taken on people in that group. Even the shortest observation intervals provide accurate information on shedding rate, though more samples increase precision. Group differences can then be described using Poisson regression. And zero-inflated models can be of use when most people are not observed to shed.28 29
Comparisons among “shedders” do not currently appear to be appropriate in any context as their value depends on the length of observation. However, some authors have provided group comparisons based both on “shedders” and the shedding rate ratio11 16 17 30 31 and some of the findings are discrepant. For example, in a crossover design with six samples per arm, Nagot16 found a significant decrease in the rate of genital HIV-1 RNA detection while on valaciclovir using Poisson regression to compute rate ratios (RR = 0.77, p = 0.006) but found no effect of treatment using the ratio of shedders (RS = 0.93, p = 0.30). Mayaud30 found a difference in HSV-2 shedding rate by HIV-1 serostatus and use of highly active antiretroviral therapy (p<0.001) but no difference in the rates of “shedders” over 12 visits between these groups (p = 0.17). Cowan11 found a 40% reduction in HSV-2 shedding with aciclovir using the ratio of shedders over 13 samples (p = 0.004) and a 76% reduction (p<0.001) using the shedding rate ratio. Thus the difference in inference by method of measurement indicates that comparisons based on “shedders” may not be reliable.
Limitations of our methods include an imperfect ability to distinguish overlapping reactivations from the ganglia within a single shedding episode.27 Recent work has shown that frequent sampling allows identification of more distinct episodes.8 However, our purpose was to assess shedding frequency rather than reactivation duration. Further, we did not consider subject-level variability in episode characteristics. However, we anticipate the impact of this additional consideration to be negligible.
Dichotomisation at a predetermined cut-off, whether that cut-off is any shedding or some fixed rate, can result in non-differential misclassification and subsequent bias since those with lowest shedding rates or longest episode lengths are most likely to be classified as non-shedders or low-shedders. Others have warned of the potential for bias in related contexts. Copeland demonstrated that non-differential misclassification can attenuate risk ratio estimates while differential misclassification can attenuate or exaggerate it.32 Irwig et al showed the potential for attenuation of exposure-response relation when dichotomising a continuous outcome at cut-offs related to the observed standard error.33 We have found similar bias for cut-offs determined a priori in both episodic and non-episodic shedding patterns. Based on this evidence, dichotomisation of shedding is discouraged and group comparisons based on proportion of “shedders” in each group are considered unreliable. Computation of overall shedding rates and group comparisons using Poisson regression is recommended.
Key messages
Most herpes simplex virus (HSV)-2 seropositive people are expected to shed HSV from the genital mucosa.
Dichotomisation of people into “shedders” versus “non-shedders” over repeated samples leads to inference that varies by the number of samples collected.
Poisson regression is recommended as it can accurately determine group differences in shedding rates regardless of the length of the sampling interval.
Acknowledgments
The authors thank Lawrence Corey for direction regarding the manuscript’s focus and breadth. We also thank Catherine Crespi for several critical reviews which helped clarify important concepts. An earlier version of this work was previously presented in Seattle at the 16th meeting of the International Society for Sexually Transmitted Diseases Research, July 2007.
REFERENCES
Footnotes
Funding: This work was funded primarily through NIH grants P01 AI-30731-13 and K24 071113-01.
Competing interests: AM and CJ have received grant support from the National Institutes of Health. AW has received grant support from the National Institutes of Health, GlaxoSmithKline, Antigenics and Astellas. She has been a consultant for Medigene, Aicuris and a speaker for Merck Vaccines.
Contributors: AM performed the analyses and wrote the initial draft of the manuscript. CJ and AW contributed the clinical relevance of the paper and critical edits to the manuscript.
Linked Articles
- Brief encounters