Article Text

Abstract
Objectives To determine trends and correlates of chlamydia positivity among young heterosexuals attending Australian sexual health services and to compare these with population-based notification data.
Methods Data from 18 sexual health services and the national notification scheme were analysed. A χ2 test assessed trends in chlamydia positivity among young heterosexuals tested from 2006 to 2010, and logistic regression was used to determine correlates of positivity. Nucleic acid amplification tests were used throughout the study period.
Results During 2006–2010, 64 588 heterosexuals aged 15–29 years attended the sexual health services for the first time and the annual chlamydia testing rate was consistently >80%. Overall, chlamydia positivity increased by 12%, by 8.3% in heterosexual men (from 13.2% in 2006 to 14.3% in 2010; p-trend=0.04) and by 15.9% in women (from 11.3% in 2006 to 13.1% in 2010; p-trend<0.01). Independent correlates of chlamydia positivity in sexual health service patients were being aged 15–24 years, residing in a regional/rural area, being Aboriginal and/or Torres Strait Islander, being a non-Australian resident and attending in 2010 compared with 2006. Over the same period, the population-based notification rate increased by 43% against a background of a >100% increase in testing.
Conclusions The sexual health service network suggests a moderate increase in chlamydia prevalence in young heterosexuals tested at sexual health services, in contrast to the steep increase shown by notifications. This highlights the caution needed in interpreting chlamydia trends without a corresponding testing denominator.
- Testing denominators
- young people
- notifications
- chlamydia infection
- Chlamydia trachomatis
- sexual health
- epidemiology (clinical)
- epidemiology (general)
- bacterial infection
- prevention
- primary care
- chlamydia
- anogenital cancer
- AIDS
- bacterial vaginosis
- behavioural science
- biostatistics
- HIV
- syphilis
- partner notification
- contact tracing
- gay men
- HIV clinical care
- commercial sex
- herpes
- AIN
- kaposis sarcoma
Statistics from Altmetric.com
- Testing denominators
- young people
- notifications
- chlamydia infection
- Chlamydia trachomatis
- sexual health
- epidemiology (clinical)
- epidemiology (general)
- bacterial infection
- prevention
- primary care
- chlamydia
- anogenital cancer
- AIDS
- bacterial vaginosis
- behavioural science
- biostatistics
- HIV
- syphilis
- partner notification
- contact tracing
- gay men
- HIV clinical care
- commercial sex
- herpes
- AIN
- kaposis sarcoma
Introduction
Rising chlamydia notifications have led some Western countries to launch national chlamydia screening programmes.1 ,2 Perhaps inevitably, this resulted in even more notifications (the more you test the more you diagnose3). The most widely used surveillance mechanism for monitoring chlamydia trends is based on the routine notification of diagnosed cases to a central agency. Such passive surveillance can be established on an ongoing basis, provides full geographic coverage, provides information on basic demographics (age and sex) and is relatively cheap. However, the key limitation is that notifications depend on the patterns of testing in a population. In addition, it provides limited information on patient risk behaviours, an important determinant of infection. Studies have previously demonstrated that notifications are highly correlated with testing,4–6 so when chlamydia testing rates are low, which is the case in many countries including Australia,7 notifications will grossly underestimate the true burden of disease. Conversely, any successful testing initiative has the potential to cause an increase in notifications. Thus, passive surveillance has substantial limitations as a means of evaluating prevention and control programmes.
Clinical sites that provide chlamydia testing have the potential to provide denominator data, which enables positive tests to be interpreted within the context of overall testing patterns. However, if these clinical sites themselves have relatively low levels of testing (eg, general practices in Australia7) and testing in these sites is increasing, as is occurring in Australia, then even using the proportion of tests that are positive can provide misleading data because over time more low-risk individuals are likely to be tested. To overcome this, we have analysed data from a sexual health network that has consistently high levels of testing, and thus, the positivity rate can be used as a proxy for chlamydia prevalence among those attending the clinic.8 ,9 This paper presents data on chlamydia trends in young heterosexuals from a national sentinel surveillance network of sexual health services and compares these with trends in national chlamydia notification and testing in Australia.
Methods
Data were collated from three sources: the Australian Collaboration for Chlamydia Enhanced Sentinel Surveillance (ACCESS) programme, the National Notifiable Disease Surveillance System and a registry of Medicare-rebated chlamydia tests.
Australian Collaboration for Chlamydia Enhanced Sentinel Surveillance
The methods of the ACCESS systems have been described in detail elsewhere.10 Briefly, the Commonwealth Department of Health and Ageing provided funding to implement six sentinel networks (five clinical and one laboratory) for surveillance of chlamydia testing and positivity. The sexual health service network involves 25 services (comprising 44 clinics); located across all states and territories, except South Australia (which was unable to participate due to database incompatibilities); 16 in metropolitan and nine in regional or remote areas. There are a total 83 clinics in Australia; thus, ACCESS includes 53% of the largest services in the country, accounting for >90% of all consultations. All services use compatible computerised medical records systems to collect information as part of routine care and provide deidentified line-listed data on following variables: patient unique identifier, sex, age, postcode, country of birth, Aboriginal and/or Torres Strait Islander status, visit date, visit number, gender of sexual partners, current sex work, and implied Australian resident status (born in Australia or arrived in Australia prior to last 2 calendar years), specimen site and the date and result of the chlamydia test. Throughout the study period, clinics collected first pass urine or vaginal or cervical swab specimen for chlamydia testing from patients presenting to the clinic for the first time. Australia adopted nucleic acid amplification testing (NAAT) between 1999 and 2002.11 Thus, chlamydia testing by NAAT was standard practice throughout the study period.
Statistical analysis
This analysis focused on the time period: 1 January 2006 to 31 December 2010 and included 18 sexual health services that were able to provide data for the entire 5-year period. Heterosexuals aged 15–29 years attending these services for the first time were included and were defined as patients reporting only sexual partners of the opposite sex within the previous 12 months. Men who have sex with men (n=10 967 (12.5%); chlamydia positivity =8.5%) and sex workers (n=4076 (4.6%); chlamydia positivity =7.1%) were excluded from the analysis. Postcode was used to determine whether patients resided in metropolitan, regional or rural areas, based on the Australian Bureau of Statistics geographical remoteness classification system.12 The proportion of young heterosexuals diagnosed with chlamydia was calculated by dividing the total number of new chlamydia diagnoses by the total number of tests (chlamydia positivity). Indeterminate chlamydia results were excluded from the analysis. Data on genital symptom status and behavioural risks were not available at the time of analysis.
A χ2 test for trend was used to determine if there was a significant trend (p<0.05) in annual testing and positivity rates over time. Poisson regression was used to determine if there was a significant trend (p<0.05) in numbers of patients seen at the services. Univariate and multivariate logistic regression analyses were undertaken to determine factors associated with chlamydia testing and positivity. The multivariate model considered all variables (including year of attendance) approaching significance (p<0.1) in the univariate model and used forward stepwise methods. Prevalence ratios were calculated for the associations with chlamydia testing, and ORs were calculated for the associations with chlamydia positivity. All analyses were conducted using STATA V.12 (StataCorp) except prevalence ratios estimations, which were calculated in SAS V.9.2 using PROC genmode.13
National notifications
Laboratories (and doctors in some states) are required to report all diagnosed chlamydia cases routinely with age, sex and postcode information.14 Cases diagnosed at sexual health services are included in the notifications. Chlamydia notification data from all states and territories were extracted from the National Notifiable Disease Surveillance System.14
Statistical analysis
We calculated annual percentage change in notification numbers and notification rate per 100 000 population in 15–29-year-olds with estimated populations derived from Australian Bureau of Statistics.15
Medicare-rebated tests
Medicare is Australia's universal health insurance scheme that rebates services provided by most healthcare providers and laboratories. Data were extracted from the Medicare website.16 Data on chlamydia tests were not available from November 2005 to April 2007 because chlamydia tests were temporarily indistinguishable from NAATs for other organisms. After April 2007, chlamydia tests were separately reported again. Thus, 2005 was taken as the comparison year. Tests conducted at sexual health services are not rebated by Medicare and thus not included in the Medicare data.
Statistical analysis
Medicare chlamydia test data from all states and territories were included. We calculated annual percentage change and testing rate per 100 000 population in 15–34-year-olds (data not available for 15–29-year-olds separately) from 2005 to 2010 and conducted a χ2 test for trend.
Ethical approval for ACCESS was granted by the Human Research Ethics Committees of St Vincent's Hospital and the University of New South Wales. Further ethical approval was then granted by the separate Human Research Ethics Committees who oversaw each of the 25 sexual health services participating in ACCESS. Ethical approval was not sought for notifications and Medicare data analyses as they are secondary analyses of publically available data.
Results
Australian Collaboration for Chlamydia Enhanced Sentinel Surveillance
Between 2006 and 2010, 146 890 patients attended the 18 sexual health services for the first time; 64 588 heterosexual patients aged 15–29 years were included in the analysis, of whom 52.5% were women. The median age of female clients in this age group was 22 years (IQR: 19–25 years) compared with 24 years (IQR: 21–26 years) in men. The majority (70.3%) resided in a major city, 61.9% were born in Australia, 22.4% were presumed to be non-Australian residents and 4.6% were Aboriginal and/or Torres Strait Islander.
There was an increase in the total number of young heterosexual patients attending sexual health services for the first time (11 476 in 2006 to 14 650 in 2010, p-trend<0.01) and in the proportions of the following subgroups: males (45.7% to 49.4%, p-trend<0.01), non-Australian residents (14.8% to 25.8%, p-trend<0.01), people born overseas (31.6% to 41.3%, p-trend<0.01) and people residing in regional or rural areas (29.1% to 31.6%, p-trend<0.01). There was no significant change in proportions of Aboriginal and/or Torres Strait Islander patients attending over time (p-trend=0.57).
Between 2006 and 2010, 84.9% of the 15–29-year-old heterosexual patients had a chlamydia test at their first visit. The chlamydia testing rate remained over 80% in both sexes every year (table 1), and there was a marginally significant increasing trend in the chlamydia testing rate in men and women (p-trend=0.05). Multivariate analysis showed that the following factors were independently associated with chlamydia testing in men: being aged 15–19 years (adjusted prevalence ratio (APR) 1.04, 95% CI 1.03 to 1.06) and aged 20–24 years (APR 1.02, 95% CI 1.01 to 1.03) compared with 25–29-year-olds, residing in a regional/rural area (APR 1.03, 95% CI 1.02 to 1.04) compared with a metropolitan area and attending in 2010 (APR 1.04, 95% CI 1.03 to 1.06) compared with 2006. Similarly, the following factors were independently associated with chlamydia testing in women: being aged 15–19 years (APR 1.02, 95% CI 1.01 to 1.04) and aged 20–24 years (APR 1.01, 95% CI 1.00 to 1.02) compared with 25–29-year-olds, residing in a regional/rural area (APR 1.01, 95% CI 1.00 to 1.02) and attending in 2010 (APR 1.03, 95% CI 1.01 to 1.04) compared with 2006. Factors independently associated with not getting tested for chlamydia in both men and women were: being an Australian resident (APR 0.94, 95% CI 0.93 to 0.95 and APR 0.92, 95% CI 0.91 to 0.94, respectively) and being born in Australia (APR 0.98, 95% CI 0.97 to 0.99 and APR 0.95, 95% CI 0.94 to 0.97, respectively).
Trends in chlamydia testing and positivity in heterosexuals aged 15–29 years attending sexual health services for the first time, by sex, 2006–2010
Over the 5-year period, 6876 of the young heterosexual patients had a positive chlamydia test at the first visit. The overall chlamydia positivity was 12.5%, higher in men (13.3%) than in women (11.8%). There was a significant upward trend overall in chlamydia positivity, increasing by 12.3% (from 12.2% in 2006 to 13.7% in 2010; p-trend<0.01), by 15.9% in women (from 11.3% to 13.1%; p-trend<0.01) and by 8.3% in men (from 13.2% to 14.3%; p-trend=0.04) (table 1). Between 2009 and 2010, there was a 7.0% increase in chlamydia positivity; between 2008 and 2009, the increase was 6.7%, and for other years, the per cent change was <3%. The sex ratio of chlamydia diagnosis between men and women overall was 1:1.
In multivariate analysis, factors independently correlated with chlamydia positivity (table 2) in men were being aged 15–19 years (adjusted odds ratio (AOR) 1.22, 95% CI 1.09 to 1.38) and aged 20–24 years (AOR 1.32, 95% CI 1.21 to 1.43), residing in a regional or rural area (AOR 1.57, 95% CI 1.44 to 1.72), being Aboriginal and/or Torres Strait Islander (AOR 1.57, 95% CI 1.33 to 1.84) and attending in 2010 (AOR 1.12, 95% CI 1.00 to 1.26). Similar factors were associated with chlamydia positivity in women: being aged 15–19 years (AOR 1.71, 95% CI 1.53 to 1.92) and aged 20–24 years (AOR 1.58, 95% CI 1.43 to 1.74), residing in a regional or rural area (AOR 1.31, 95% CI 1.20 to 1.43), being Aboriginal and/or Torres Strait Islander (AOR 1.56, 95% CI 1.35 to 1.81) and attending in 2010 (AOR 1.26, 95% CI 1.12 to 1.42).
Factors associated with chlamydia positivity in heterosexual aged 15–29 years attending sexual health services for the first time, 2006–2010
National notifications
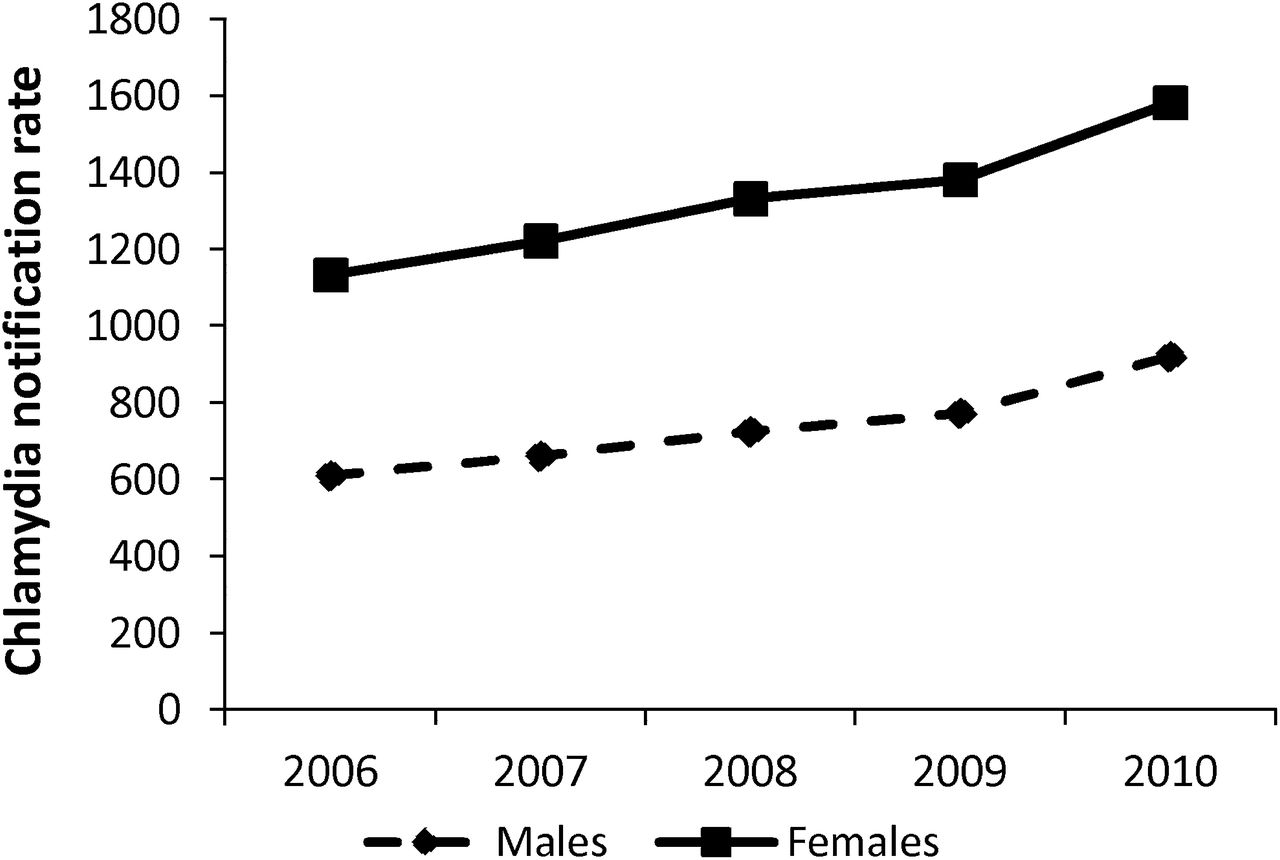
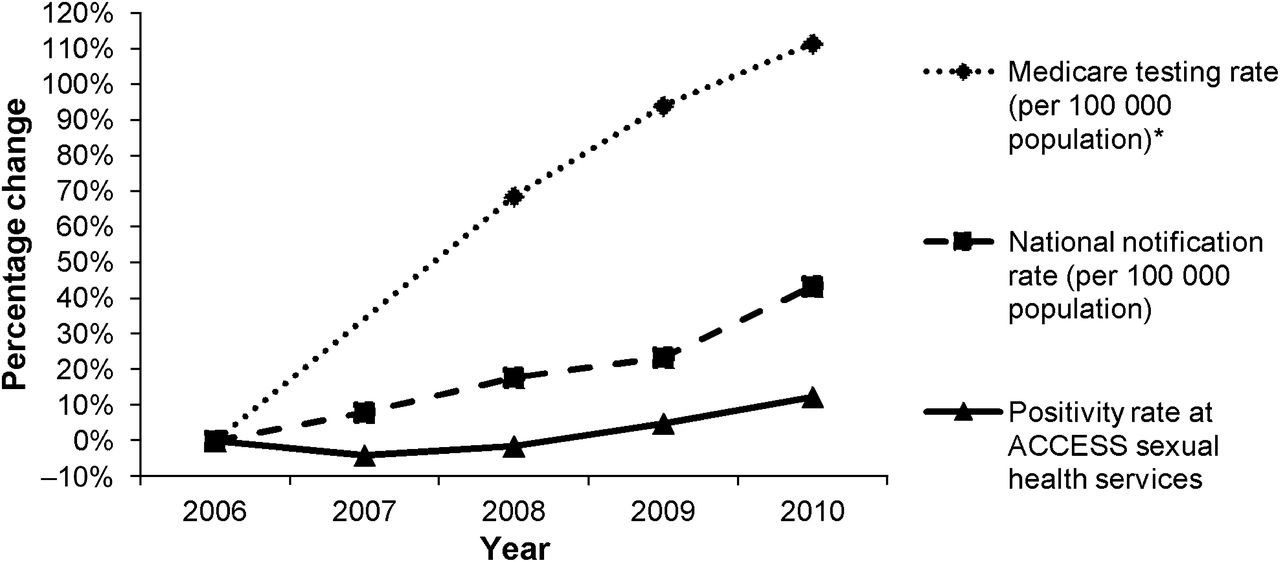
Chlamydia notification numbers in 15–29-year-olds increased by 60.6% from 37 235 in 2006 to 59 815 in 2010. The increase in notifications was greater in men (70.2%) than in women (55.3%), and the greatest annual increase in notifications was 18.6% between 2009 and 2010, compared with <13% in all other years. The chlamydia notification rate of the 15–29-year-old population increased by 43.3% in the same time period (figure 1), from 867.7 per 100 000 in 2006 to 1243.3 per 100 000 in 2010 (p-trend<0.01). The increase was more in men (50.7%) than in women (39.6%). In 2010, the notification rate was 921.3 in men and 1581.5 per 100 000 in women (figure 2). The greatest annual increase in notification rate was 16.3% in 2009–2010 compared with <10% in all other years.

Percentage change in national chlamydia notification rate and positivity rate at ACCESS sexual health services in 15–29-year-olds, 2006–2010, and national Medicare testing rate* in 15–34-year-olds, 2005–2010.
National chlamydia notification rates in people aged 15–29 years, by sex and year, 2006–2010.
Medicare-rebated tests
Among 15–34-year-olds, the chlamydia testing rate increased by 111.5% from 4238 per 100 000 in 2005 to 8962 per 100 000 in 2010 (p-trend<0.01), with a 9.0% increase in 2009–2010 compared with 15% in 2008–2009 (figure 1).
Discussion
This is the first study that uses a national sentinel surveillance network to examine chlamydia trends and compares them with national notifications and testing data. Data from a clinical network with high levels of testing suggest that, after adjusting for demographic risk factors, there has been a modest increase (overall 12%) in prevalence of chlamydia in the country in past 5 years. This is in contrast with a rapidly rising increase in prevalence shown by the national notification rates (43%) over the same time period, and when notifications are seen in light of the 111.5% increase in Medicare-rebated testing rates (2005–2010), there appears to be a decrease in prevalence, highlighting that notifications alone can be misleading.
The strength of our study was combining multiple national data sources. In addition, the national scale of the ACCESS system reduces concerns about using data from a single clinic or region and yielded more comprehensive data on patient demographics and risk factors than the passive notification system. Also a very high proportion of people attending sexual health services receive a chlamydia test at their first, which means the positivity estimates approximate prevalence in the clinic patient population. One might expect that the testing rates to be even higher than the 82%–90% observed at the first visit; however, some clinics triage clients, which results in the test being recorded on their second visit rather than the first.
A potential limitation of the ACCESS system is representativeness. Sexual health services' patients are more likely to seek care because of symptoms or perceived sexually transmitted infection risk, and thus, the positivity estimates of 12% are not an accurate measure of the burden of chlamydia in the general population (4.9% in young Australian women17). Genital symptom data are currently not collected as part of the ACCESS study. However, previous reports from one large ACCESS sexual health service showed that 55.9% of heterosexual men18 and 42% women4 were either symptomatic presentations or contacts of people with infection. Trends in more symptomatic sexually transmitted infections (such as syphilis and gonorrhoea) reported from sexual health services have better reflected population-based notifications.19 ,20 In addition, the majority of chlamydia diagnosis in Australia take place at general practice clinics,21 which means the ACCESS system only reflects a small subset of diagnoses in Australia. The General Practice Network in ACCESS has reported a slightly lower positivity estimate of 8.9% in 16–29-year-olds, but as testing rates are very low in this setting, these data are likely to be misleading for trend analyses.
Another limitation of clinic-based sentinel surveillance networks that use routinely collected data is the potential for bias due to a change in patient profile.10 In our analysis, we observed an overall increase in the total number of patients seen at the sexual health services, which we attribute to service efficiencies (computer-assisted history taking, express clinics and reduced burden of genital warts22) resulting in increasing proportions of some subpopulations over time. However, the comprehensive data on patient demographics and risk factor data in ACCESS allowed us to adjust for this shift and we found that attendance in the final year of the study was independently correlated with chlamydia positivity. That being said, the positivity estimates could not be adjusted for any changes in sexual behaviour over time.
Our analysis demonstrated that heterosexuals who attended services in the last year of the study, who were younger, non-Australian residents, Aboriginal and/or Torres Strait Islander or resided in regional or rural areas were more likely to test positive for chlamydia. The higher prevalence in regional or rural areas could be a reflection of less access to health services.23 Aboriginal and Torres Strait Islander people are known to be at higher risk of chlamydia compared with non-Indigenous people,24 and prevalence has been found to be higher in non-residents compared with Australian residents in sexual health services due to higher risk-taking behaviour.25
The rise in chlamydia positivity seen at sexual health services, particularly in the last few years, although not as marked as notification data, is still concerning. National sexual behaviour data from secondary school students have shown increasing risk behaviour that could be driving the rise in chlamydia prevalence. In 2008, 43.1% of female students reported ever having sexual intercourse compared with 33.3% in 2002.26 Also the proportion of sexually active students reporting more than three sexual partners in the past 12 months was 29.7% in 2008, up from 19.9% in 2002; and in 2008, only 50.5% sexually active students reported always using condoms in the last year.26
The ideal way to monitor prevalence in the general population is to conduct repeated population-based cross-sectional surveys. However, such studies are often too expensive for surveillance purposes. Using sentinel surveillance systems to report on prevalence in at-risk populations, although not ideal, is a good option as they are cheap and are easy to maintain on long-term basis. Nationally, many countries (including Australia14 and the USA27) report chlamydia trends using numbers of cases notified and rates per 100 000 population and do not take into account testing as the denominator. The UK,28 however, has recently begun to report positivity rates with testing as the denominator, as we do in this study. In addition, the UK Department of Health has recently completed a consultation to determine if it should include chlamydia diagnosis rates (positive tests per 100 000 population) as well as positivity in 15–24-year-olds as an indicator of chlamydia control.29 We recommend to include testing data as the denominator, as shown in this analysis, because if we simply report the numbers of cases diagnosed in sexual health service from our study, the extent of the increase would appear much greater than positivity rates that take into account testing denominator. Also the analysis showed that without testing data, comparison of trends between sexes can be misinterpreted. Sexual health services data show that the sex ratio of chlamydia infections in men and women was 1:1 and also that the positivity was similar in men and women in 2010. This is quite different from the ratio seen in the national notification numbers of 1:1.6 (22 703 notifications in young men compared with 37 112 in women in 2010).14 This imbalance in the notification numbers is most likely attributable to less testing of men and more frequent testing of women (because of the risk of long-term complications) outside sexual health services.7 ,30
In conclusion, this sentinel surveillance system highlights the value of using testing data as a denominator in determining trends in chlamydia on a population level. The sexual health service network suggests that chlamydia prevalence in young heterosexual men and women is rising moderately in Australia. This is in contrast to the steep rise observed by the notification rates.
Key messages
-
When chlamydia testing rates are high, the positivity rate can be used as a proxy for chlamydia prevalence among clinical populations.
-
At Australian sexual health services, the increase in chlamydia positivity in young heterosexuals was much less than the increase in population-based chlamydia notifications.
-
Caution is needed in interpreting chlamydia notification trends without testing denominators, as most of the increase in notifications was attributable to increased testing.
Acknowledgments
We thank all sentinel sites that provided data for ACCESS (see web appendix 1). ACCESS is a collaboration between the Kirby Institute, the Burnet Institute, the National Serology Reference Library, the National Perinatal Statistics Unit and the National Aboriginal Community Controlled Health Organisation.
References
Supplementary materials
Supplementary Data
This web only file has been produced by the BMJ Publishing Group from an electronic file supplied by the author(s) and has not been edited for content.
Files in this Data Supplement:
- Data supplement 1 - Online appendix
Footnotes
↵* See acknowledgements and web appendix 1.
-
Funding The ‘ACCESS project’ was funded by the Australian Government Department of Health and Ageing from 2007 to 2010, as part of the National Chlamydia Pilot Program. The views expressed in this paper are not necessarily the views of the department.
-
Competing interests None.
-
Patient consent Individual patient data are not shared as part of the study; only deidentified data are shared. Thus, getting individual patient consent was not a requirement for this study.
-
Ethics approval Ethics approval was provided by Human Research Ethics Committees of St Vincent's Hospital and the University of New South Wales and the 25 ethics committees overlooking each sexual health service.
-
Provenance and peer review Not commissioned; externally peer reviewed.
Linked Articles
- Correction