Article Text

Abstract
Objectives Size estimates of populations at higher risk for HIV infection are needed to help policy makers understand the scope of the epidemic and allocate appropriate resources. Population size estimates of men who have sex with men (MSM), female sex workers (FSW) and intravenous drug users (IDU) are few or non-existent in Nairobi, Kenya.
Methods We integrated three population size estimation methods into a behavioural surveillance survey among MSM, FSW and IDU in Nairobi during 2010–2011. These methods included the multiplier method, ‘Wisdom of the Crowds’ and an approach that drew on published literature. The median of the three estimates was hypothesised to be the most plausible size estimate with the other results forming the upper and lower plausible bounds. Data were shared with community representatives and stakeholders to finalise ‘best’ point estimates and plausible bounds based on the data collected in Nairobi, a priori expectations from the global literature and stakeholder input.
Results We estimate there are approximately 11 042 MSM with a plausible range of 10 000–22 222, 29 494 FSW with a plausible range of 10 000–54 467 FSW and approximately 6107 IDU and plausibly 5031–10 937 IDU living in Nairobi.
Conclusions We employed multiple methods and used a wide range of data sources to estimate the size of three hidden populations in Nairobi, Kenya. These estimates may be useful to advocate for and to plan, implement and evaluate HIV prevention and care programmes for MSM, FSW and IDU. Surveillance activities should consider integrating population size estimation in their protocols.
- Africa
- Developing World
- Epidemiology (General)
- HIV
Statistics from Altmetric.com
Introduction
Throughout the world, HIV disproportionately affects marginalised populations, particularly men who have sex with men (MSM), female sex workers (FSW) and intravenous drug users (IDU).1–3 However, little is known about their role in the HIV epidemics of sub-Saharan Africa where the general population is also severely affected. Societal marginalisation may contribute to the lack of appropriate prevention programmes focusing on these populations, which in turn, may contribute to ongoing HIV transmission. Also, partly due to their stigmatisation, the true size of these populations is unknown, leading to an underestimation of potential need for prevention, treatment and care programmes, The situation may be exacerbated in countries where their very existence may be denied.
Size estimates of key populations at highest risk for HIV infection are needed to help policy makers and programme administrators understand the scope of the problem, plan appropriate interventions and allocate sufficient resources. Population size estimates are needed to set appropriate programme targets, assess adequacy of programme coverage and in producing national estimates and projections of the HIV epidemic. Population size estimation for most at-risk populations (MARPs) for HIV infection has been made a priority by WHO, the Joint United Nations Programme on HIV/AIDS (UNAIDS) and the US President's Emergency Plan for AIDS Relief (PEPFAR), with specific inclusion in countries with generalised epidemics.4–6 In conjunction with bio-behavioural surveillance activities conducted among MSM, FSW and IDU in Nairobi during 2010–2011, we implemented several methods to estimate the size of these populations. To our knowledge, this is the first time multiple size estimation methods have been used in conjunction with bio-behavioural surveillance activities among MARPs. Previous population size estimations of populations at risk for HIV infection have relied on ratio and modelling methods independent of bio-behavioural surveillance or featured only one method such as unique object multipliers within an integrated biological and behavioural survey.7 ,8
Methods
Overall approach
In the absence of a gold standard method for estimating the size of a population, such as a census, estimates of hidden populations are imprecise and prone to potentially severe biases. Therefore, our overall approach was to implement multiple methods simultaneously to minimise potential bias resulting from a single method to produce the most well-supported estimate of population sizes using available survey and service statistic data. As described in greater detail below, we used three practical methods that were determined feasible for each population and location during a formative assessment. These included variations of the ‘multiplier method’, the ‘Wisdom of the Crowds’ (WOTC) method and an approach that drew on published literature. In the process, the median of the three estimates was hypothesised to be the most plausible size estimate with the other results forming the upper and lower plausible bounds. Data were also shared in a consensus forum and with population community representatives to finalise point estimates and plausible bounds based on the empirical data collected in Nairobi, a priori expectations from the global literature and stakeholder input. All methods were embedded within a bio-behavioural survey designed to estimate prevalence of HIV and related risk behaviours among three populations at higher risk for HIV infection. Participants were recruited using respondent-driven sampling (RDS), a probability-based peer recruitment sampling method.9 Recruitment started with 18 seeds (six each for FSW, MSM and IDU), who were asked to recruit their peers from their personal social networks. Seeds were identified through formative research and diversified on age, sexual identity and marital status. Seeds were not selected purposefully from services that served as sources of multiplier service counts. The median personal network size of participants ranged from 4 to 8. Equilibrium on all key analysis variables was reached before the 10 recruitment waves attained in the sample.
Multipliers
Multiplier methods entail using two basic sources of data on the population in question.10 First, respondents are asked questions during a population-based survey such as the bio-behavioural survey about the use of specific services or facilities (eg, in the last 12 months, did you receive sexually transmitted infection (STI) treatment at X clinic?), membership in a group (eg, they must be FSW, MSM or IDU) or participation in a research study in a specific time period. Second, unduplicated counts of the population of interest of the corresponding service or group membership during the same specific period are obtained. Using these two data sources, the multiplier method provides a population size estimate by the formula: N = n/p, where N is the population size estimate, n is the number of the population using a particular service (or who are members of a group or participated in a study) in a specified time period and p is the proportion of the survey population reporting using the particular service (or being a member of a group or participating in a study) in the same time period. For the estimate to be unbiased, the number of individual contacts determined from programme data should be unduplicated, the time period for individual contacts should be specified, MARP membership should be confirmed, the data sources used as multipliers must be independent of one another and the proportion reporting using the service must come from a representative or statistically adjusted sample.
Several sources of programmatic data were explored as multipliers for this study. These included services delivering peer outreach, clinic and education services. When possible, several sources of data were used simultaneously to minimise the potential influence of biases of any one multiplier and to produce upper and lower plausible bounds of the estimate. The final choice of multipliers used was determined by the availability and quality of the unduplicated client counts available during the formative phase of the project. Questions corresponding to each multiplier were embedded in the bio-behavioural survey conducted among each MARP group. Questions were designed to elicit information about attendance/use of a specific service during a specifically described period (eg, Can you tell me the name or location of the clinic or drop-in centre you last went to? Followed by a list of names of clinics/drop-in centres). These questions were asked of a sample of each MARP accrued through a quasi-population-based RDS survey. The results were adjusted for sampling method.
Wisdom of the Crowds
The ‘WOTC’ method is based on the assumption that the central tendency in the response of a population on the number of population members approximates or is proportional to the actual number of members in that population.11–13 The key to this approach are several assumptions: (1) persons in a large sample tend to have unique information or perspectives about the population in question and (2) when individuals in the sample are asked the same question, individual responses are not influenced by others in the sample and in aggregate, any extreme outliers in responses tend to cancel each other out. The method entailed adding questions to the interviewer-administered bio-behavioural survey instrument; for example, participants were asked about how many MSM they believe to be present in a particular location. Median, range and quartile descriptive statistics can be calculated.
Literature review
Our literature review began with a synthesis of previously published study data on the population and demographic profile of high-risk populations in the region and international data on the prevalence of these populations in regions similar to Kenya's. The synthesis of data entailed an extensive review of the published and grey literature searching for relevant data from similar cities and regions, which could be used to calculate benchmark population size estimates. Literature-based methods drew on published population sizes for the general population, typically stratified by age and gender, and estimates of the population of MSM, FSW and IDU in various populations. The literature-based method leverages existing estimates that are from a similar context/geographic region and that can be applied to a new context/geographic region where such research has not yet been conducted. Using information from the literature review, we inferred a rough estimate of the population size for MSM, FSW and IDU in Nairobi by multiplying the number of adult men and/or women in Nairobi, Kenya, obtained from Kenya Census data by the numbers of MSM, FSW or IDU reported for Nairobi or surrounding regions using published data.
Stakeholder consensus
During the analysis phase, the modified Delphi method14 was conducted with a convening of stakeholders to synthesise the new information and estimates gathered during the study and to interpret results. Stakeholders included representation from Kenyan government, research, HIV programming and community advocacy sectors. This entailed the presentation of preliminary point estimates for population sizes, identifying the median estimate of all methods used and also eliciting feedback and expert opinions from stakeholders on the estimates. In addition to input on point estimates of the population size, a goal of this phase was to establish upper and lower plausibility bounds for the estimates based on the shared local and international data and on the expert opinion of our Delphi panel. Plausibility bounds are not the same as statistical CIs but rather bounds established that make ‘plausible sense’ in our context.
Bio-behavioural survey
The Centers for Disease Control and Prevention (CDC) supported behavioural surveillance study that took place in Nairobi for MSM, FSW and IDU and broadly followed UNAIDS/WHO recommendations for surveillance among populations at most risk for HIV infection.15 RDS was used to recruit participants from all three study populations. RDS is a chain referral sampling method designed to reduce the biases generally associated with chain referral methods in order to yield a probability-based sample.9 It is specifically designed to sample hard-to-reach and hidden populations such as FSW, IDU and MSM. MSM included in the study were men who reported sexual activity (oral or anal) with another man at least once in the last 6 months. FSW included in the study were those who reported selling sex to a man in the past 3 months. IDU included in the study were men and women who used needles for injection drug use in the past 3 months. To minimise duplicate enrolment in the study, biometric identifiers were collected and verified as unique from each participant. The resulting numbers of unduplicated MARPs sequentially sampled from 2 July 2010 to 16 October 2010 were 563 (MSM), 593 (FSW) and 263 (IDU).16
Face-to-face behavioural interviews were administered using computer-assisted personal interviews in private by trained nurse counsellors. Population-based population estimates of size estimation variables and 95% CI were estimated using RDS Analysis Tool (RDSAT), which weighted estimates to account for participant network size and homophily.17
Results
Multipliers
For MSM in Nairobi, we obtained service data delivered to MSM over the period from 1 July 2010 to 15 October 2010 by four organisations in the Nairobi area (table 1). These included a previously completed cohort study that recruited and followed MSM for HIV vaccine trial preparation, clinical services delivered by local clinics and two peer education services. Estimates for the MSM population size using the multipliers ranged from 3261 to 22 222 in Nairobi. In terms of FSW, three sources of service data were accessible for this exercise. These included HIV testing services, clinic services and peer education services targeting the Nairobi area during the period from October 2009 to January 2010. The resulting estimates ranged from 16 550 to 649 000 FSW living in Nairobi. For IDU, four sources of service data were accessible for estimation. These included Nairobi focused sexually transmitted disease services, HIV testing and two drop-in services during the period from 1 January 2010 to 31 December 2010. Estimates for IDU living in Nairobi ranged from 5031 to 22 727 using these multipliers.
Population size estimates of MSM, FSW and IDU using service multipliers, Nairobi, November 2010
Wisdom of the Crowds
Based on responses from all MSM participants in the bio-behavioural survey about the perceived number of MSM living in Nairobi, the median size estimate for this population was 10 000 (IQR 48 000). Similarly, based on responses from all FSW and IDU, the median size estimates were 10 000 (IQR 496 000) and 3000 (IQR 4700), respectively.
Literature review
We identified one source for the denominator of how many males aged 18 years or older existed in Nairobi (table 2).18 In addition, the proportion of MSM in the adult male population in Kenya (1.2%) was obtained by examining the range of MSM occurrence in Africa in the literature and taking the lower quartile value.19 We took the lower quartile value to conservatively (ie, not overestimate) estimate the prevalence of MSM in Nairobi. The median estimate from these two sources of demographic data and using the MSM population of 1.2% was 13 608 MSM living in Nairobi. Data from the 2009 Nairobi Census18 documenting the number of adult women (18 years and older) and a prevalence of FSW among adult women of 2.8% from the literature were used to estimate 29 494 FSW living in Nairobi.20 Finally, using the 2009 Nairobi Census data and an estimated 0.3% prevalence of IDU from the literature, we estimate 6562 IDU living in Nairobi.21
Population size estimates of MSM, FSW and IDU using literature and demographic data, Nairobi, November 2010
Stakeholder feedback
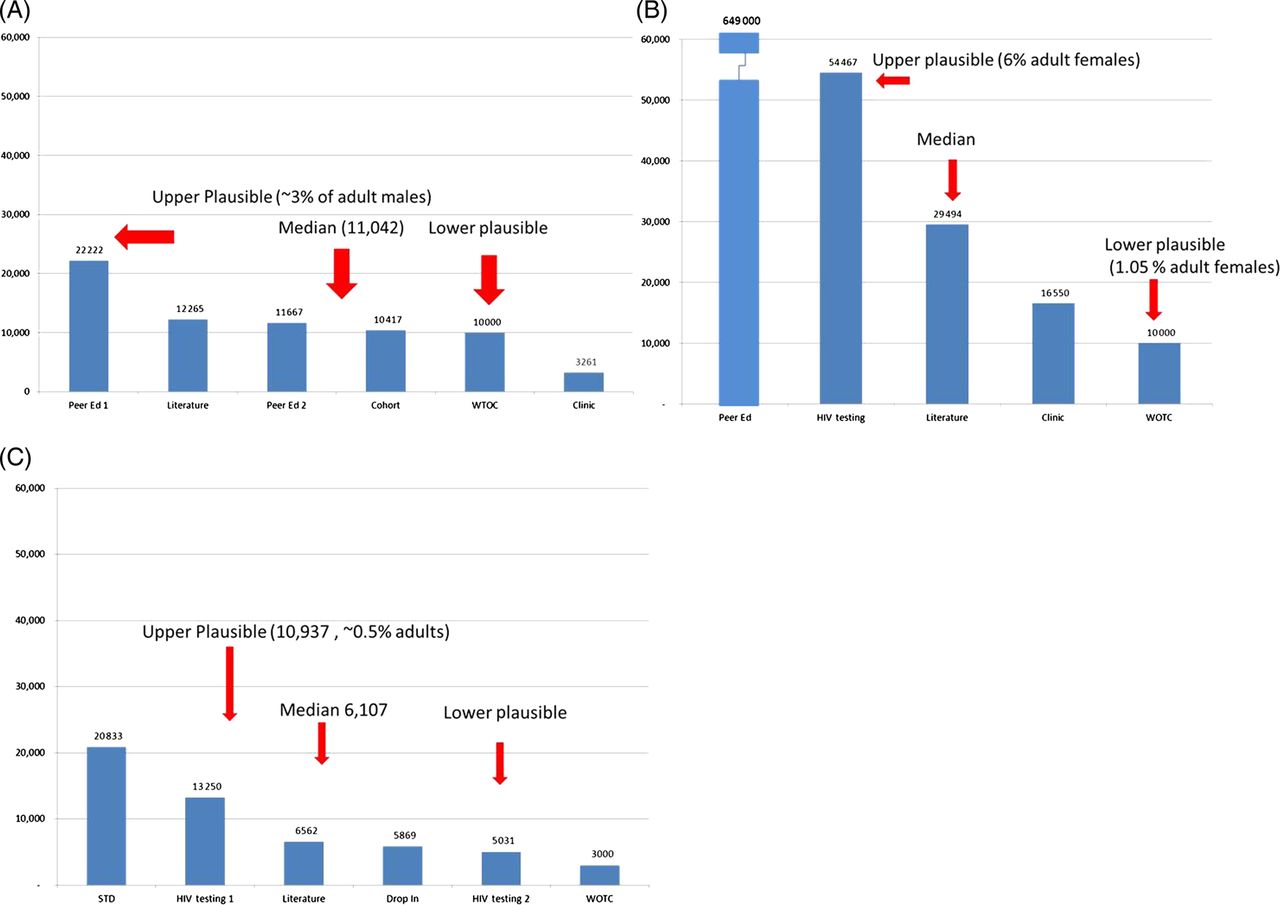
Based on the available data, stakeholders concluded that a median of 11 042 males in Nairobi was the best-supported estimate for the size of the MSM population in Nairobi. A value of 10 000 was agreed to be the lower plausible bound given the likelihood that important subgroups of MSM may not have been reached by the biological and behavioural survey, nor had access to MSM-friendly services used for service multiplier data. Men who were believed to be less likely to have participated in the survey or seek MSM-friendly services included MSM currently married to women, African MSM of higher socioeconomic status and Asian-Kenyan MSM. Given these gaps, stakeholders concluded that the upper bound of MSM in Nairobi was 22 222 (approximately 3% of adult men in Nairobi). For FSW, stakeholders debated that the estimates presented represented full-time or regular FSWs and did not capture part-time or casual FSW (ie, FSW who do not rely on sex work for their main income or support). With this assumption in mind, they found the median of 29 494 to be a plausible estimate with 10 000 and 54 467 being the lower and upper plausible estimates, respectively. Stakeholders brought knowledge of previous size estimation efforts of IDU to the discussion of the present estimates. Previously unpublished estimates ranged from over 12 000 (Reychad Abdool, personal communication) in Nairobi to 30 000 IDU in Kenya overall.20 With this context in mind, stakeholders were reasonably comfortable with a median estimate of 6107 with 5031 and 10 937 as the lower and upper plausibility bounds, respectively (table 3 and figure 1).
Summary of population size estimates of MSM, FSW and IDU using three methods, Nairobi, November 2010
Population size estimates of high-risk populations, Nairobi, Kenya for 2010/11. (A) MSM population size estimates, median and plausibility bounds, Nairobi, 2010. (B) FSW population size estimates, median and plausibility bounds, Nairobi, 2010. (C) IDU population size estimates, median and plausibility bounds, Nairobi, 2011. Access the article online to view this figure in colour.
Discussion
We triangulated data from a wide range of sources to estimate the size of three hidden high-risk populations in Nairobi, Kenya, using multiple practical methods. We estimate that there are approximately 10 208 MSM and that there may plausibly be over two times that number residing in Nairobi depending on the unknown extent that the bio-behavioural survey and service activities failed to reach more hidden MSM subgroups. For FSW, we estimate 29 494 FSW with a plausible range of 10 000–54 467 FSW living in Nairobi. We estimate that there are approximately 6107 IDU and plausibly 5031–10 937 IDU living in Nairobi. Moreover, we employed multiple methods for each population coupled with a robust quasi-population-based survey using RDS. Taken together, this approach lends strength to our results. Furthermore, these estimates were accepted as reasonably accurate and precise enough for use by local stakeholders involved in HIV prevention and care planning.
Our study has several limitations. First, we were only able to employ three estimation methods and had access to few sources of service data for the multiplier method. Estimation exercises benefit greatly from employing multiple methods and multiple sources of data. Our estimates could have been even more robust should more methods and/or data had been available. Second, service multiplier data may not accurately reflect unduplicated clients served by a provider. While our bio-behavioural study used biometric identifiers (eg, fingerprint scanning technology) to minimise duplication, these methods were not employed by service providers. Future efforts that use service multiplier data should encourage improved data collection within service settings by developing partnerships between surveillance and service providers that target high-risk populations. High-quality service data and accurate population estimates would greatly contribute to improving service coverage efforts while assisting surveillance activities with monitoring the HIV epidemic. This calls for careful consideration when interpreting service multiplier data. Third, WOTC estimates have been shown to be influenced by knowledge of other participants’ opinions.22 We reduced this potential bias by asking the WOTC question in a one-on-one interview rather than in group settings. Third, it is possible that individuals posed as MARP members to participate in the bio-behavioural survey. We minimised this possibility by implementing stringent assessment of each participant’s responses to behavioural questions through a subjective evaluation by study staff and in the few cases where there were significant doubts regarding membership those participants were not included in this analysis. Last, estimates such as these assume that behaviours are fixed and do not vary over time when in fact this assumption overly simplifies high-risk group membership. For example, FSW may be FSW only part time or only in the distant past or, in the case of MSM, may only engage in MSM behaviour very occasionally. Noting that behaviours and thus group membership vary over time, it is important to note that these estimates represent a snapshot of the size of the high-risk population at one point in time and cannot represent the true size of the population over a longer period of time.
Nevertheless, this study is one of the first to use a wide range of sources of data and employ multiple methods to estimate the size of three high-risk populations in Nairobi. Moreover, these estimates underscore the certainty of these populations’ existence in Nairobi and thus have value of advocacy for populations whose existence may be denied. These size estimates may serve as a basis for HIV prevention and care planning by national HIV coordinating bodies and donor organisations. Future HIV surveillance efforts should include population size estimation exercises to refine and improve our present estimates using the methods used in the present study and adding additional methods such as unique object distribution. Only if the size of high-risk populations is known, can the response to the epidemic be appropriately planned and prioritised.
Key messages
-
Size estimates of populations at higher risk for HIV infection can help policy makers understand the scope of the epidemic and allocate appropriate resources.
-
Multiple methods embedded in behavioural surveys can provide these estimates.
-
In Nairobi we estimate approximately 11042 men who have sex with men (range 10,000–22,222), 29 494 female sex workers (10,000–54,467) and 6216 (5031–10,937) intravenous drug users.
-
These estimates can be used for prevention and care/treatment planning.
Acknowledgments
The authors thank the National HIV and STI Control Programme (NASCOP), the National AIDS Control Council, the University of Manitoba's Sex Worker Outreach Programme (SWOP), Liverpool Voluntary Counseling and Testing, the Gay and Lesbian Coalition of Kenya (GALCK), Nairobi Outreach Services Trust (NOSET), the Kenya AIDS Vaccine Initiative, United Nations Office on Drugs and Crime (UNODC), Casino STI Clinic and the participants for sharing their service data and other respective supportive roles in the successful completion of this research. We also thank NOSET. This study was funded by PEPFAR through CDC and through the Population Council's cooperative agreement of Award No. 5U62PS224506. The contents and opinions expressed herein are solely the responsibility of the authors and do not necessarily represent the official views of the CDC.
References
Footnotes
-
Handling editor Jackie A Cassell
-
Contributors JO supervised study staff, conducted stakeholder meetings and implementation and co-led writing of the manuscript. SG was the principal investigator, conducted stakeholder meetings and co-wrote the manuscript. NM contributed to the manuscript and provided oversight to the study; HM provided oversight to study site operations and reviewed the manuscript; WT co-designed the study, developed study tools and reviewed the manuscript; DB co-designed the study, developed study operating procedures and tools and reviewed the manuscript; DK advised protocol development and formative data gathering and reviewed the manuscript; AK reviewed the manuscript; TO reviewed the manuscript; and HFR co-designed the study, developed study tools, conducted the analysis and led writing of the manuscript.
-
Competing interests None.
-
Ethics approval The study received ethical review and approval from the CDC Center for Global Health associate director for science, the Population Council institutional review board and the University of Nairobi/Kenyatta National Hospital ethics and review committee.
-
Provenance and peer review Not commissioned; externally peer reviewed.
-
Data sharing statement Data may be available via individual requests to the corresponding author.